Fund Factsheet - January 2021
←
→
Page content transcription
If your browser does not render page correctly, please read the page content below

Fund Factsheet - January 2021

OUR PRODUCT SUITE
ETF
EXCHANGE
EQUITY HYBRID DEBT TRADED OFFSHORE
FUNDS FUNDS FUNDS FUNDS FUNDS
EDELWEISS EDELWEISS EDELWEISS EDELWEISS ETF -
LARGE CAP FUND ARBITRAGE FUND OVERNIGHT FUND BHARAT BOND ETF EDELWEISS
APRIL 2023 ASEAN EQUITY
Asset Allocation Duration Range 1 day
Marketcap Net Equity Debt Arbitrage OFF-SHORE
FUND
No 0-35% 65-100%
Large Mid Small Open Equity
EDELWEISS EDELWEISS EDELWEISS EDELWEISS ETF -
LARGE & MID CAP FUND EQUITY SAVINGS FUND BHARAT BOND ETF EDELWEISS
LIQUID FUND
APRIL 2025 GREATER CHINA
Asset Allocation Duration Range 0-3 months EQUITY
Marketcap
Net Equity Debt Arbitrage OFF-SHORE
FUND
Large Mid Small 10-40% 0-35% 25-55%
EDELWEISS EDELWEISS EDELWEISS EDELWEISS ETF -
FLEXI-CAP FUND BALANCED ADVANTAGE BHARAT BOND ETF EDELWEISS
LOW DURATION FUND
FUND APRIL 2030 EUROPE
Asset Allocation
Duration Range 6-12 months DYNAMIC EQUITY
Marketcap
Net Equity Debt Arbitrage OFF-SHORE
FUND
Large Mid Small 30-100% 0-35% 0-50%
EDELWEISS EDELWEISS EDELWEISS EDELWEISS ETF -
EDELWEISS
MIDCAP FUND AGGRESSIVE HYBRID BANKING & PSU DEBT BHARAT BOND ETF EMERGING
FUND FUND APRIL 2031 MARKETS
Marketcap Asset Allocation Duration Range 1-10 yrs
OPPORTUNITIES
Net Equity Debt
OFF-SORE
Large Mid Small 65-80% 20-35% FUND
EDELWEISS EDELWEISS
CORPORATE BOND EDELWEISS
SMALL CAP FUND
FUND EDELWEISS US VALUE
Marketcap
Duration Range 1-5 yrs
ETF - NIFTY 50 EQUITY
OFF-SHORE
FUND
Large Mid Small
EDELWEISS
MONEY MARKET FUND EDELWEISS
EDELWEISS US TECHNOLOGY
Duration Range 0-12 months
ETF - NIFTY BANK EQUITY
FUND OF FUND
EDELWEISS
GOVERNMENT EDELWEISS
SECURITIES FUND NIFTY 100
Duration Range 1-10 yrs
QUALITY 30
Macaulay duration range & credit profile is indicative. AAA refers to sovereign/A1+ & equivalent, AA refers to AA+/AA/AA-, A refers to A+/A/A-
Market-cap allocation range is indicative. Asset Allocation range is indicative.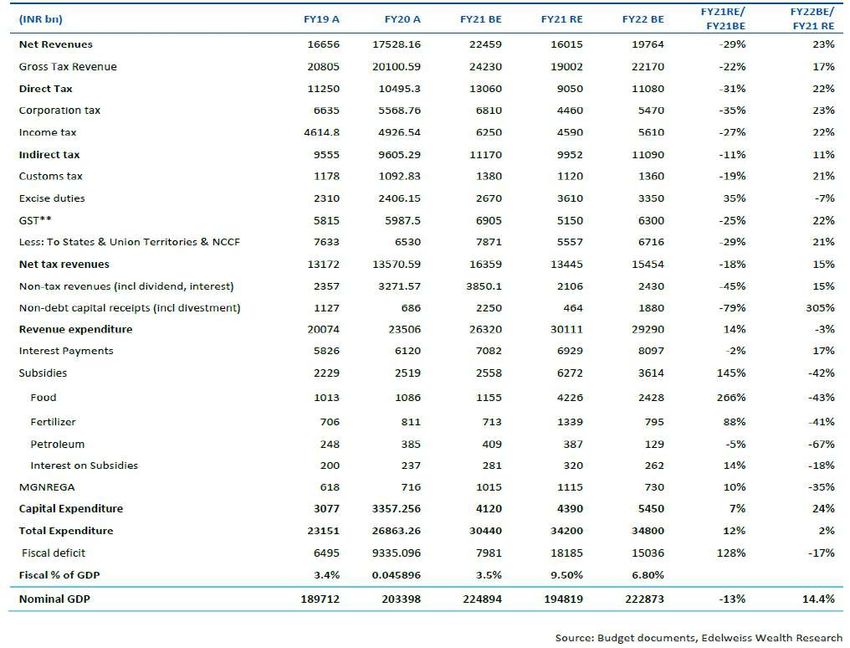
Index

 Markets & Beyond                                                     Page No.
 •   Penned by CEO                                                        2
 •   Market Insights                                                      4

 Equity Funds
 •   Edelweiss Large Cap Fund                                             7
 •   Edelweiss Large & Mid Cap Fund                                       8
 •   Edelweiss Flexi-Cap Fund                                             9
 •   Edelweiss Mid Cap Fund                                              10
 •   Edelweiss Small Cap Fund                                            11
 •   Edelweiss Long Term Equity Fund (Tax Savings)                       12

 Hybrid Funds
 •   Edelweiss Arbitrage Fund                                            13
 •   Edelweiss Equity Savings Fund                                       14
 •   Edelweiss Balanced Advantage Fund                                   15
 •   Edelweiss Aggressive Hybrid Fund                                    16

 Debt Funds
 •   Edelweiss Overnight Fund                                            17
 •   Edelweiss Liquid Fund                                               18
 •   Edelweiss Money Market Fund                                         19
 •   Edelweiss Low Duration Fund                                         20
 •   Edelweiss Banking & PSU Debt Fund                                   21
 •   Edelweiss Corporate Bond Fund                                       22
 •   Edelweiss Government Securities Fund                                23
 Passive Funds
 •   Bharat Bond ETF APRIL 2023                                          24
 •   Bharat Bond ETF APRIL 2025                                          25
 •   Bharat Bond ETF APRIL 2030                                          26
 •   Bharat Bond ETF APRIL 2031                                          27
 •   Edelweiss ETF - Nifty 50                                            28
 •   Edelweiss ETF - Nifty Bank                                          29
 •   Edelweiss ETF - Nifty 100 Quality 30                                30
 •   Edelweiss MSCI India Domestic & World Healthcare 45 Index Fund      31
 Fund of Funds
 •   Bharat Bond FOF APRIL 2023                                          32
 •   Bharat Bond FOF APRIL 2025                                          33
 •   Bharat Bond FOF APRIL 2030                                          34
 •   Bharat Bond FOF APRIL 2031                                          35
 Overseas Fund of Funds
 •   Edelweiss Asean Equity Off-Shore Fund                               36
 •   Edelweiss Greater China Equity Off-Shore Fund                       37
 •   Edelweiss Europe Dynamic Equity Off-Shore Fund                      38
 •   Edelweiss Emerging Markets Opportunities Equity Offshore Fund       39
 •   Edelweiss US Value Equity Off-Shore Fund                            40
 •   Edelweiss US Technology Fund                                        41
 Schedule
 •   SIP Performance                                                     42
 •   Fund Performance - Direct Plan                                      43
 •   Dividend History                                                    45
 •   Schemes managed by Fund Manager                                     47
 •   Investing made Simple                                               48
 •   How to Read Factsheet                                               49

Penned by the CEO

                    Radhika Gupta
                    MD & CEO, Edelweiss Asset Management

Dear Investor,

No discussion about February is complete without the Big B, the Budget. This year, much as I enjoyed listening to the
budget, I also enjoyed hearing the Economic Survey presented a day before the budget, presented much unlike an
economics speech, with stories, anecdotes, and even examples from 3 Idiots. The Budget has already been discussed
threadbare, and while the discussions typically centre on policies, the micro of taxation, and deficits, this year, what I took
away from the Budget and Economic Survey were powerful principles of how we should think about money. And just as
the nation has a budget, each of us has our own personal budget, our own income and expenditure, to which these
principles apply just as beautifully.

Principle 1: Growth allows debt, but not the reverse

“The state collects tax for the greater welfare of its citizens in the same way as the sun evaporates water, only to return it
manifold in the form of rain.” — Kalidasa's Raghuvansham

Given the COVID-19 crisis, there is a need for the government to spend (funded by borrowing), but in such a time, the
conundrum is does austerity foster growth, or will growth make borrowing sustainable. In the Indian context, it is the
latter, because the interest rate paid by the government has historically been less than India's growth rate (not the case
for all nations), and a growth-oriented budget is justified in this context. Similarly, in personal finance, when we debate
debt versus income, it is important to realize that if there is income, debt will become sustainable, but debt without
income leads to a debt trap.

Principle 2: The importance of being counter-cyclical

As the government makes a choice for fiscal expansion, it is accompanied by concern about the implication for growth,
sovereign ratings, and external vulnerabilities. The Economic Survey makes the point that fiscal policy and governments
must be counter-cyclical, essentially spend when the chips are down to smoothen out economic cycles. In fact, the
fiscal multiplier, which is the return derived by the economy from an additional rupee of spending, is unequivocally
greater during a crisis than during a boom. This is not different from investing in a crisis, which has a higher multiplier on
wealth creation. The investor who entered in March 2020 earned much more than the ones who invested in January 2020.

Principle 3: Emergency medicine should not become a staple diet

The Spanish philosopher George Santayana reminds us that, “Those who do not learn from history are condemned to
repeat it.” Emergency times call for unique measures, including forbearance on bank loans in the COVID crisis, and a
relaxation on norms for restructuring assets for banks during the Global Financial Crisis (these restructured assets no
long had to be classified as NPAs). While this measure helped borrowers tide through temporary hardship, it extended
its welcome by many years, and should have been discontinued when the economy recovered, leading to detrimental
consequences. Similarly, in personal finance, investments can be redeemed in a crisis to help tide through, but
redeeming long term investments in normal time for impulsive needs makes for a bad habit.

                                                                                                                             2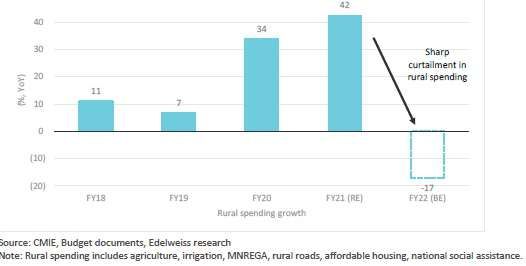
Penned by the CEO

Principle 4: Productive vs. Non-Productive Expenditure

A bold feature of this budget was to focus on increasing capital expenditure that goes into building infrastructure rather
than traditional revenue expenditure that typically affects current consumption like subsidies. Money will be spent on
building long term assets, that has a multiplier effect because it creates jobs, brings new consumers into the economy
and helps growth. Revenue expenditure is quick and convenient and helps in the short term, but capital expenditure is
painful in the short term, but builds value in the long term. In personal finance, we all have to define and focus on capital
expenditure – spending in building long term investment assets that improves our future income, rather than just current
consumption. Ask yourself if the money you save should go into buying a car that adds to your monthly expenses and
depreciates, or an education that adds to your job prospects.

Principle 5: My Problems. My Solutions.

The final and overarching takeaway from the budget, was that India as an economy is unique in its per capita income,
population density, and economic conditions, and cannot be compared to economics with ten times the per capita GDP.
Neither in its response to COVID or how it chose to impose a lockdown, or in how it chooses to revive its economy, India's
problems are unique and need its own solutions, that are not a copy of the West. In investing too, we say that personal
finance is first personal, and the right investing answer is the one that works for your goals and your circumstances.
Resist the urge to copy and do what is right for you.

Just as we hope India recovers and charts a new course aided by a landmark Budget, we at Edelweiss MF also wish you
the best as you plan your own personal budgets. Thank you for trusting us with your hard earning money, and happy and
peaceful investing.

Radhika

Disclaimer: Ms. Radhika Gupta is the MD & CEO of Edelweiss Asset Management Limited (EAML) and the views
expressed above are her own.

MUTUAL FUND INVESTMENTS ARE SUBJECT TO MARKET RISKS, READ ALL SCHEME RELATED DOCUMENTS
CAREFULLY

                                                                                                                           3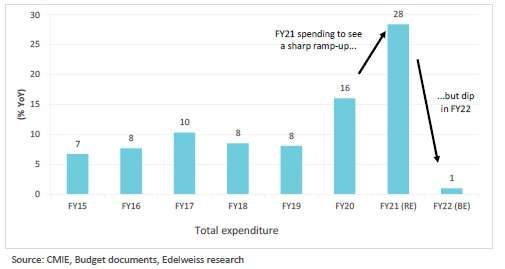
Union Budget 2021 – Impact Analysis
Feb 2, 2021

KEY HIGHLIGHTS
Ÿ   Union Budget 2021 puts focus back on growth and expansion with significant increase in capex allocation but with reduced
    dependance on off-balance sheet financing predominantly done through CPSEs.
Ÿ   The budget also spells out crucial steps for the financial services sector including privatization of public sector banks; transfer of
    bad loans to a 'bad bank'; increase in FDI limit in the insurance sector; and sufficient resources kept aside for recapitalization.
Ÿ   The budget has created a roadmap for infrastructure growth proposing a dedicated development finance institution; 15% y-o-y
    increase in capex allocation in the nine core sectors; and boosting private sector capital via asset monetization.
Ÿ   PM Aatmanirbhar Health Yojana to spend INR 64,100 crore over 6 years, in addition to National Health Mission. Health budget
    estimates are at Rs. 2.23 lakh cr. in FY22 up from Budget expectation of Rs. 94 thousand cr. in FY21. Rs.35 thousand cr. allocated
    for COVID-19 vaccines in FY22.
Ÿ   The push for 'Make in India' is visible in stipulating higher customs duty for PLI linked segments like mobile components, solar
    inverters, cotton; Agriculture Infrastructure and Development Cess (AIDC) to be introduced in specific products. As of now Rs.
    2.5 per litre has been imposed on petrol and Rs. 4 per litre on diesel.
Ÿ   For the banking sector, proposals to strengthen the financial system like the creation of more ARCs, Direct Finance Institution to
    fund infrastructure, PSU bank recapitalization, etc. should go a long way in strengthening the financial sector.
Ÿ   On the direct tax front, no material changes were announced. There were expectations of a potential imposition of a COVID cess
    on the rich or corporates, which was avoided.
Ÿ   On Indirect tax front, import duties on inputs such as gold and steel have been reduced while that on chemicals etc. has been
    increased. While an additional cess on petrol and diesel has been introduced, excise duty on the same has been reduced by a
    similar amount. This is unlikely to have much impact on consumers, but it is likely to weigh on state revenues. This is because the
    amount collected through the cess is not liable to be shared with states.
Ÿ   Tax changes for ULIPs: The budget now limits exemptions on proceeds from unit-linked insurance plans that have so far allowed
    large investors to receive tax-free returns. For ULIPs taken on or after Feb. 1, the maturity proceeds of policies with an annual
    premium of more than Rs. 2.5 lakh will be taxable on a par with equity-linked mutual fund schemes; however, any amount
    received on death continues to be exempt without any limit on the annual premium. Also, Individuals holding multiple ULIPs with
    an aggregate premium more than Rs. 2.5 lakh will have to pay tax on the proceeds.

Views on Bond Market by Dhawal Dalal – CIO, Fixed Income
The Union Budget for FY22 was delivered on the backdrop of expectations of pandemic-driven contraction of 7.7% in India's
economic output for FY21 and rebounding of economic growth of 11% in FY22 as highlighted by the Economic Survey. Therefore, it
was quite natural to expect a growth-oriented Union Budget.
The Union Budget for FY22 was focused on ensuring that the ongoing economic revival remains well supported through higher
spending in the infrastructure sector and significant boost to the capital expenditure for FY22. To that extent, the capital expenditure
for FY22 is budgeted at Rs. 5.5 trillion – a solid growth of 34% over the previous year. This higher spending is expected to percolate
into higher level of economic activities in multiple sectors and boost demand for capital goods.
From the bond market's perspective, fiscal deficit for FY21 was revised higher to 9.5% of the GDP. This was sharply higher than
market expectations of ~8%. The upwardly revised fiscal deficit for FY21 was accompanied by announcement of additional
borrowing of Rs. 80,000 cr. to be completed in the next two months. This should take the total gross borrowing to Rs. 13.9 trillion in
FY21. The Union Budget for FY22 has projected fiscal deficit of 6.8% of GDP and gross borrowing of Rs. 12 trillion. This is higher than
the consensus estimates of 5.5% to 6% for the fiscal deficit and around Rs. 11 trillion of gross borrowing in FY22.
Prices of sovereign bonds reacted negatively on the announcement of additional borrowing for FY21 as well as higher-than-
expected gross borrowing & fiscal deficit for FY22. Yield of the benchmark 10Y IGB (5.85% IGB 2030) hardened by around 16 bp from
its lowest level of the day to 6.05% after the Budget speech was concluded. Similarly, yield of benchmark 5Y IGB (5.15% IGB 2025)
hardened by around 25 bp from its low to 5.53% during the same time amid heavy trading volume on NDS-OM.

                                                                                                                                        4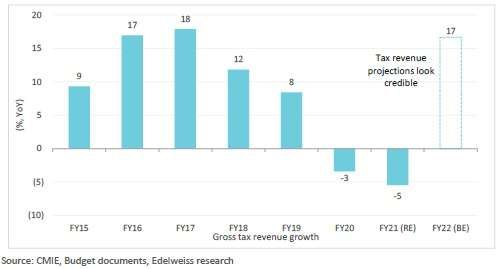
Union Budget 2021 – Impact Analysis
Feb 2, 2021

Yields of AAA-rated CPSE bonds tracked the movement in yields of IGB amid thin trading volume. Yields of liquid 5Y AAA-rated CPSE
bonds inched up by around 22-25 bp while yields of liquid 10Y AAA-rated CPSE bonds inched up by around 10 bp from their
yesterday's valuations.
Adverse price action in the bond market is aided by expectations of gradual reduction in the banking system liquidity, normalization
of economic activities, prospects of revival of credit growth going forward, demand-supply imbalance in IGB in FY22, recent sharp
price increase in key industrial commodities and fears of inflation in global economies by a section of influential market
participants.
That said, we expect yields of IGB to remain range-bound in the medium-term due to several supporting factors. Firstly, the RBI is
expected to maintain the accommodative stance in FY22 and keep sufficient
liquidity in the banking system to support economic growth. The RBI is also expected to absorb around Rs. 2 trillion of IGB in FY22
through OMO bond purchases. This should alleviate some pressure on bond prices and help address demand-supply dynamic to
some extent. Secondly, headline consumer inflation is expected to trend lower and remain well within the RBI's range of
expectations in H1FY22. This should support RBI's accommodative stance. Thirdly, the GOI is likely to increase portion of T-Bills in
its net borrowing for FY22, thus helping reduce pressure on IGB to some extent. Lastly, the shape of the yield curve remains quite
steep despite recent hardening of yields. Yields spread between 1Y IGB and 10Y IGB still remains around 185 basis points. This
makes level of 10Y IGB still quite attractive for investors from real yield's (yields net of current inflation) perspective.
What should investors do?
We recommend investors to continue to focus on high quality AAA-rated liquid PSU bonds maturing in 7-10Y maturity bucket for
investment horizon of at least two years. This positioning will not only provide attractive yield to the investors but also reduce
potential price volatility in future in our opinion. Our analysis suggests that corporate bonds maturing in 2 to 4-year segment is a
crowded trade and prone for a sharp pull-back in yields when interest rate cycle begins to normalize in future. Risk to our view comes
from a sharp revival in global economic growth in CY21, sudden increase in geo-political risk, pressure on natural resources & global
supply-chains, secular increase in inflation well beyond G7 central banks' expectations in CY22-23.
Views on Equity Market by Harshad Patwardhan, CFA – CIO, Equities
In November last year, after US elections & positive news on vaccines, we had cautioned our clients about the risk of being
Underweight on Indian equities link to report With today's budget, we believe that risk has gone up a notch even at higher market
levels.
Government's message from the budget is clear: relentless focus on inducing growth and generating employment. Big push to
domestic manufacturing and boost to infrastructure are the key elements of its strategy. Huge focus on privatization of PSUs and
monetization of government assets is meant to raise resources but will also improve productivity. It's a big positive that government
has refrained from raising taxes. This, in a way, is our long-awaited fiscal stimulus. Government has also taken bold steps to
encourage foreign investment and untie banks' hands to support growth.
This move should add fuel to the ongoing recovery and support corporate earnings growth. Positive for equity markets, particularly
for industrial & BFSI sectors. Midcap and small caps will likely outperform. Risks to our view arises from poor execution of
government plans & second wave of infection. Also, don't forget volatility and corrections- which are part of the game.
Story in Charts:
Fiscal Deficit has been relaxed…                                      Gross tax revenue projections seem credible…

                                                                                                                                    5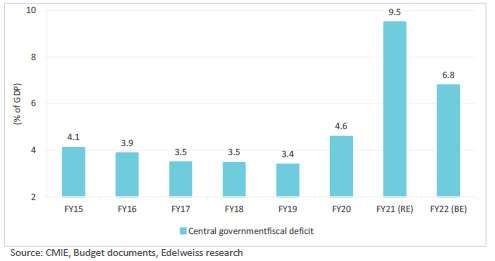
Union Budget 2021 – Impact Analysis
Feb 2, 2021

Total spending ramps up sharply in FY 21…                           Rural Spending likely to see slowdown…

Budget Math – Consolidation begins after 2022…

DISCLAIMER
The view of the Fund Managers should not be construed as investment advice. Investor must make their own investment
decisions based on their specific investment objectives and financial positions and using such AMFI qualified advisors as may
be necessary. Opinions expressed are not necessarily those of Edelweiss Asset Management Limited (EAML) or any of its
Directors, Officers, Employees, and personnel. Consequently, EAML or any of its Directors, Officers, Employees, and personnel
do not accept any responsibility for the editorial content or its accuracy, completeness or reliability and hereby disclaim any
liability about the same.
Mutual Fund Investments are subject to market risks, read all scheme related documents carefully.
                                                                                                                                  6
Edelweiss An open ended equity scheme
predominantly investing in large
Large Cap Fund cap stocks
Inception Date 20-May-09
Investment Objective (As on 29th January, 2021)
Fund Managers Details
The investment objective is to seek to generate long-term capital appreciation from a portfolio predominantly consisting equity and equity- Fund Managers Experience Managing Since
related securities of the 100 largest corporate by market capitalisation listed in India. However, there is no assurance that the investment
objective of the Scheme will be realized and the Scheme does not assure or guarantee any returns. Mr. Bharat Lahoti 13 years 02-May-17
Mr. Hardik Varma 05 years 11-November-19
Top Holdings as on January 29, 2021 Portfolio Analysis: Sector-Wise Fund Size
Month End AUM Monthly Average AUM
Name of Instrument Industry % to Net Financial Services 32.88% Rs. 218.73 Crore Rs. 226.58 Crore
Assets
IT 17.12%
HDFC Bank Ltd. Financial Services 9.17% NAV (as on January 29, 2021)
Consumer Goods 10.69%
Infosys Ltd. IT 8.18%
Pharma 10.21%
Direct Plan Dividend Option 25.0100
ICICI Bank Ltd. Financial Services 7.45%
Direct Plan Growth Option 46.0800
HCL Technologies Ltd. IT 4.12% Oil & Gas 4.50%
Bharti Airtel Ltd. Telecom 4.11%
Regular Plan Dividend Option 20.4000
Automobile 4.49%
Reliance Industries Ltd. Oil & Gas 3.69% Regular Plan Growth Option 42.9600
Telecom 4.11%
Larsen & Toubro Ltd. Construction 3.08%
Kotak Mahindra Bank Ltd. Financial Services 2.99% Construction 3.08% Minimum Investment Amount
Axis Bank Ltd. Financial Services 2.64% Cement & Cement Products 1.83% Rs. 5000/- and multiple of Re. 1/- thereafter
Tata Consultancy Services Ltd. IT 2.62%
Fertilisers & Pesticides 1.61%
State Bank Of India Financial Services 2.58% Additional investment amount
Housing Development Finance
Rs. 500/- per application & in multiples of Re. 1/-
Corp Ltd. Financial Services 2.46% Market Capitalization (% of total) thereafter
Bajaj Finance Ltd. Financial Services 2.28%
Divi's Laboratories Ltd. Pharma 2.06%
Exit Load
ITC Ltd. Consumer Goods 2.04%
6.25% • If the Units are redeemed / switched out on or
Hindustan Unilever Ltd. Consumer Goods 1.96%
Maruti Suzuki India Ltd. Automobile 1.86% before 365 days from the date of allotment – 1.00%
Ultratech Cement Ltd. Cement & Cement Products 1.83% • If the Units are redeemed / switched out after 365
Nestle India Ltd. Consumer Goods 1.71% days from the date of allotment – Nil
Avenue Supermarts Ltd. Consumer Goods 1.64%
HDFC Life Insurance Company Ltd. Financial Services 1.31% Total Expense Ratios~:
Mahindra & Mahindra Ltd. Automobile 1.18% Regular Plan 2.49%
Torrent Pharmaceuticals Ltd. Pharma 1.11%
Direct Plan 1.05%
Dr. Reddy's Laboratories Ltd. Pharma 1.11% 93.75%
Power Grid Corporation Of India Ltd. Power 1.08%
Eicher Motors Ltd. Automobile 1.00%
Cipla Ltd. Pharma 0.95%
Large cap Mid cap
Larsen & Toubro Infotech Ltd. IT 0.92%
Gland Pharma Ltd. Pharma 0.86%
Tata Consumer Products Ltd. Consumer Goods 0.81%
Other 21.20%
Quantitative indicators Quantitative indicators As on January 29, 2021
21.73% Sharpe 0.97 Active 60
Ratio** bets
Std. Beta Total stocks
deviation 0.19 29.16% in portfolio
Top 10 stocks@ Net Equity Portfolio Turnover Ratio^ Total Portfolio Turnover Ratio^
This product is suitable for investors who are seeking*
48.05% 99.61% Equity F&O 3.37
1.40 1.97 • To create wealth in the long term
• Investment predominantly in equity and equity related
**Risk free rate of return (FIMMDA Overnight MIBOR) 3.47% | @ Top 10 Stock also includes the Future and Options securities including equity derivatives of the 100
largest companies by market capitalization, listed in
India.
Fund Performance as on January 29, 2021 *Investors should consult their financial advisers if in
doubt about whether the product is suitable for them.
Benchmark Additional Benchmark
Scheme - Regular Plan
(Nifty 50 TR Index) (S&P BSE Sensex TR Index)
Period
Returns* Value of Rs. 10000 Returns* Value of Rs. 10000 Returns* Value of Rs. 10000 Investors
Invested Invested Invested AT
E
understand
ER
OD
1 Year 12.94% 11,290 15.27% 11,522 15.09% 11,505 that their
M
3 Year 7.62% 12,463 8.70% 12,841 10.08% 13,336 principal
LOW
will be at
5 Year 12.89% 18,343 13.94% 19,214 14.65% 19,826
Very
Since Inception - Regular Plan 13.26% 42,960 11.77% 36,779 12.29% 38,845 RISKOMETER
High Risk
Past performance may or may not be sustained in future and should not be used as a basis for comparison with other investments.
* CAGR Return.
Notes:
1. Different plans shall have different expense structure. The performance details provided herein are of Regular Plan of Edelweiss Large Cap Fund. Returns are for Growth Option only. In case the
start/end date is non business day, the NAV of previous day is used for computation.
2. The scheme is currently managed by Mr. Bharat Lahoti (Managing this fund from May 2, 2017) & The scheme is currently managed by Mr. Hardik Varma (Managing this fund from May 11, 2019)
Please refer page no. 47 for name of the other schemes currently managed by the Fund Managers and relevant scheme for performance.
3. Standard deviation and Sharpe ratio are annualized.
4. ^ Lower of sales or purchase divided by average AUM for last rolling 12 months.
5. Active bets are those where the fund have exposure away from the weightage as compared to benchmark. Source: Bloomberg.
7Edelweiss An open ended equity scheme
investing in both large cap and
Large & Mid Cap mid cap stocks
Fund
Inception Date 14-Jun-07
Investment Objective (As on 29th January, 2021)
Fund Managers Details
The investment objective of the Scheme is to generate long-term capital appreciation from a diversified portfolio of predominantly Large Cap Fund Managers Experience Managing Since
and Mid Cap equity and equity-related securities However, there can be no assurance that the investment objective of the Scheme will be
realised. Mr. Harshad Patwardhan, 25 years 14-Jun-07
CFA.
Top Holdings as on January 29, 2021 Portfolio Analysis: Sector-Wise Fund Size
Month End AUM Monthly Average AUM
Name of Instrument Industry % to Net Financial Services 29.60% Rs. 603.82 Crore Rs. 629.17 Crore
Assets
Consumer Goods 10.98% NAV (as on January 29, 2021)
HDFC Bank Ltd. Financial Services 6.07% IT 9.76% Direct Plan Dividend Option 18.4980
Infosys Ltd. IT 6.03%
Industrial Manufacturing 7.73% Direct Plan Growth Option 42.0560
ICICI Bank Ltd. Financial Services 5.69%
Cholamandalam Investment Construction 6.88% Regular Plan Dividend Option 16.7230
& Fin Co Ltd. Financial Services 3.04% Automobile 5.46% Regular Plan Growth Option 38.2970
State Bank Of India Financial Services 3.01%
Bharti Airtel Ltd. Telecom 2.93% Oil & Gas 5.19%
Axis Bank Ltd. Financial Services 2.90% Pharma 4.74% Minimum Investment Amount
Larsen & Toubro Ltd. Construction 2.82%
Cement & Cement Products 3.50% Rs. 5,000/- per application & in multiples of Re. 1/-
Reliance Industries Ltd. Oil & Gas 2.82%
Ultratech Cement Ltd. Cement & Cement Products 2.56% Telecom 2.93% thereafter
Dixon Technologies (india) Ltd. Consumer Goods 2.26%
Mphasis Ltd. IT 2.26% Additional investment amount
Housing Development Finance Asset Allocation
Market Capitalization
(% of (%
total)
of total) Rs. 500/- per application & in multiples of Re. 1/-
Corp Ltd. Financial Services 2.22% thereafter
Gujarat Gas Ltd. Oil & Gas 1.92%
Ashok Leyland Ltd. Automobile 1.73%
SRF Ltd. Industrial Manufacturing 1.68% Exit Load
7.64%
Coromandel International Ltd. Fertilisers & Pesticides 1.60% • If the Units are redeemed / switched out on or
The Phoenix Mills Ltd. Construction 1.55% before 12 months from the date of allotment – 1.00%
HCL Technologies Ltd. IT 1.47% • If the Units are redeemed / switched out after 12
Crompton Greaves Cons months from the date of allotment – Nil
Electrical Ltd. Consumer Goods 1.46%
Minda Industries Ltd. Automobile 1.44%
Cummins India Ltd. Industrial Manufacturing 1.42% 38.90% Total Expense Ratios~:
Jindal Steel & Power Ltd. Metals 1.35% Regular Plan 2.43%
53.47%
Equitas Holdings Ltd. Financial Services 1.31%
Kansai Nerolac Paints Ltd. Consumer Goods 1.27% Direct Plan 0.86%
Hindustan Unilever Ltd. Consumer Goods 1.25%
Honeywell Automation India Ltd. Industrial Manufacturing 1.24%
Jubilant Foodworks Ltd. Consumer Goods 1.22%
Divi's Laboratories Ltd. Pharma 1.20%
Large cap Mid cap Small cap
Indusind Bank Ltd. Financial Services 1.14%
Other 31.14%
Quantitative indicators Quantitative indicators As on January 29, 2021
21.15% Sharpe 0.87 Active 64
Ratio** bets
Std. Beta Total stocks
deviation in portfolio
0.15 53.81%
Top 10 stocks
@
Net Equity Portfolio Turnover Ratio^ Total Portfolio Turnover Ratio^
37.87% 96.05% Equity F&O 0.74
0.74 0.00
This product is suitable for investors who are seeking*
**Risk free rate of return (FIMMDA Overnight MIBOR) 3.47% | @ Top 10 Stock also includes the Future and Options
• Long-term capital growth.
• Investments predominantly in equity and equity related
Fund Performance as on January 29, 2021 securities of large & mid cap companies.
*Investors should consult their financial advisers if in
Benchmark Additional Benchmark doubt about whether the product is suitable for them.
Scheme - Regular Plan
(Nifty Large Midcap 250 TR Index) (Nifty 50 TR Index)
Period
Returns* Value of Rs. 10000 Returns* Value of Rs. 10000 Returns* Value of Rs. 10000
Invested Invested Invested E
Investors
AT
13.71% 11,367 17.31% 11,726 15.27% 11,522 understand
ER
1 Year
OD
that their
M
3 Year 6.74% 12,158 6.18% 11,969 8.70% 12,841
principal
5 Year 12.66% 18,158 14.34% 19,555 13.94% 19,214
LOW
will be at
Since Inception - Regular Plan 10.35% 38,297 11.55% 44,420 10.36% 38,367 Very
RISKOMETER
High Risk
Past performance may or may not be sustained in future and should not be used as a basis for comparison with other investments.
* CAGR Return.
Notes:
1. Different plans shall have different expense structure. The performance details provided herein are of Regular Plan of Edelweiss Large & Mid Cap Fund. Returns are for Growth Option only. Since
Inception returns are calculated on Rs. 10/- invested at inception of the scheme. In case the start/end date is non business day, the NAV of previous day is used for computation.
2. The scheme is currently managed by Harshad Patwardhan (managing this fund from June 14, 2007). Please refer page no. 47 for name of the other schemes currently managed by the Fund
Managers and relevant scheme for performance.
3. Standard deviation and Sharpe ratio are annualized.
4. ^ Lower of sales or purchase divided by average AUM for last rolling 12 months.
5. Active bets are those where the fund have exposure away from the weightage as compared to benchmark. Source: Bloomberg.
6. Please note that the scheme is acquired from JPMorgan mutual fund on and from the close of business hours of November 25, 2016, hence disclosure requirement vide SEBI Circular no.
SEBI/HO/IMD/DF3/CIR/P/2018/69 dated April 12, 2018 on performance disclosure post consolidation/ Merger of Schemes, prior to acquisition date, is not provided.
8Edelweiss An open ended dynamic equity scheme investing
across large cap, mid cap, small cap stocks
Flexi-Cap Fund
Inception Date 3-Feb-15
Investment Objective (As on 29th January, 2021)
Fund Managers Details
The investment objective of the Scheme is to generate long-term capital appreciation from a diversified portfolio that dynamically invests
Fund Managers Experience Managing Since
in equity and equity-related securities of companies across various market capitalisation.
However, there can be no assurance that the investment objective of the Scheme will be realized. Mr. Harshad Patwardhan, 25 years 03-Feb-15
CFA.
Top Holdings as on January 29, 2021 Portfolio Analysis: Sector-Wise
Fund Size
Name of Instrument Industry % to Net Month End AUM Monthly Average AUM
Financial Services 32.85%
Assets
Rs. 609.59 Crore Rs. 635.51 Crore
IT 13.21%
Infosys Ltd. IT 8.77%
HDFC Bank Ltd. Financial Services 8.19% Construction 7.62%
ICICI Bank Ltd. Financial Services 7.66% Consumer Goods 7.61% NAV (as on January 29, 2021)
Bharti Airtel Ltd. Telecom 3.86% Automobile 5.76% Direct Plan Dividend Option 16.1340
Larsen & Toubro Ltd. Construction 3.52% Direct Plan Growth Option 18.2330
Industrial Manufacturing 5.39%
Dixon Technologies (india) Ltd. Consumer Goods 3.02%
Oil & Gas 5.07% Regular Plan Dividend Option 15.1050
Reliance Industries Ltd. Oil & Gas 2.97%
Regular Plan Growth Option 16.9620
Axis Bank Ltd. Financial Services 2.97% Pharma 4.99%
State Bank Of India Financial Services 2.95% Telecom 3.86%
Housing Development Finance Minimum Investment Amount
Cement & Cement Products 3.23%
Corp Ltd. Financial Services 2.71% Rs. 5,000/- per application & in multiples of Re. 1/-
Ultratech Cement Ltd. Cement & Cement Products 2.15% thereafter
HCL Technologies Ltd. IT 1.85%
Ashok Leyland Ltd. Automobile 1.76% Market Capitalization (% of total)
Additional investment amount
Tata Consultancy Services Ltd. IT 1.72%
Kotak Mahindra Bank Ltd. Financial Services 1.45% Rs. 500/- per application & in multiples of Re 1/-
Hindustan Unilever Ltd. Consumer Goods 1.44% thereafter
Gujarat Gas Ltd. Oil & Gas 1.41% 8.88%
Amber Enterprises India Ltd. Consumer Goods 1.39% Exit Load
Divi's Laboratories Ltd. Pharma 1.33% • If the Units are redeemed / switched out on or
Dr. Reddy's Laboratories Ltd. Pharma 1.33% before 12 months from the date of allotment – 1.00%
Equitas Holdings Ltd. Financial Services 1.32% 22.99% • If the Units are redeemed / switched out after 12
The Phoenix Mills Ltd. Construction 1.30% months from the date of allotment – Nil
Cipla Ltd. Pharma 1.26%
Honeywell Automation India Ltd. Industrial Manufacturing 1.26% 68.13%
Total Expense Ratios~:
SRF Ltd. Industrial Manufacturing 1.25%
Brigade Enterprises Ltd. Construction 1.23% Regular Plan 2.40%
Kansai Nerolac Paints Ltd. Consumer Goods 1.22% Direct Plan 0.65%
Minda Industries Ltd. Automobile 1.19%
Escorts Ltd. Automobile 1.18% Large cap Mid cap Small cap
Coromandel International Ltd. Fertilisers & Pesticides 1.16%
Other 25.18%
Quantitative indicators Quantitative indicators As on January 29, 2021
21.57% Sharpe 0.93 Active 54
Ratio** bets
Std. Beta Total stocks
deviation 0.06 48.96% in portfolio
Top 10 stocks@ Net Equity Portfolio Turnover Ratio^ Total Portfolio Turnover Ratio^
46.62% 94.89% Equity F&O 0.76
0.76 0.00
This product is suitable for investors who are seeking*
**Risk free rate of return (FIMMDA Overnight MIBOR) 3.47% | @ Top 10 Stock also includes the Future and Options
• Long Term Capital Growth
• Investment in equity and equity-related securities of
Fund Performance as on January 29, 2021 companies across various market capitalisations.
*Investors should consult their financial advisers if in
Benchmark Additional Benchmark doubt about whether the product is suitable for them.
Scheme - Regular Plan
(Nifty 500 TR Index) (Nifty 50 TR Index)
Period
Returns* Value of Rs. 10000 Returns* Value of Rs. 10000 Returns* Value of Rs. 10000
Invested Invested Invested E
Investors
AT
understand
ER
1 Year 11.19% 11,116 15.87% 11,582 15.27% 11,522
OD
that their
M
3 Year 4.69% 11,474 6.49% 12,073 8.70% 12,841 principal
LOW
5 Year 13.11% 18,530 13.61% 18,938 13.94% 19,214 will be at
Since Inception - Regular Plan 9.22% 16,962 9.24% 16,981 9.02% 16,779 Moderately
RISKOMETER
High Risk
Past performance may or may not be sustained in future and should not be used as a basis for comparison with other investments.
* CAGR Return.
Notes:
1. Different plans shall have different expense structure. The performance details provided herein are of Regular Plan of Edelweiss Flexi-Cap Fund. Returns are for Growth Option only. Since Inception
returns are calculated on Rs. 10/- invested at inception of the scheme. In case the start/end date is non business day, the NAV of previous day is used for computation.
2. The scheme is currently managed by Harshad Patwardhan (managing this fund from February 3, 2015). Please refer page no. 47 for name of the other schemes currently managed by the Fund
Managers and relevant scheme for performance.
4. ^ Lower of sales or purchase divided by average AUM for last rolling 12 months.
5. Active bets are those where the fund have exposure away from the weightage as compared to benchmark. Source: BSE, Bloomberg.
6. Please note that the scheme is acquired from JPMorgan mutual fund on and from the close of business hours of November 25, 2016, hence disclosure requirement vide SEBI Circular no.
SEBI/HO/IMD/DF3/CIR/P/2018/69 dated April 12, 2018 on performance disclosure post consolidation/ Merger of Schemes, prior to acquisition date, is not provided.
9Edelweiss An open ended equity scheme
predominantly investing in mid
Mid Cap Fund cap stocks
Inception Date 26-Dec-2007
Investment Objective (As on 29th January, 2021) Fund Managers Details
The investment objective is to seek to generate long-term capital appreciation from a portfolio that predominantly invests in equity and Fund Managers Experience Managing Since
equity-related securities of Mid Cap companies. However, there can be no assurance that the investment objective of the Scheme will be Mr. Harshad Patwardhan, 25 years 26-Dec-07
realised.
CFA.
Fund Size
Top Holdings as on January 29, 2021 Portfolio Analysis: Sector-Wise Month End AUM Monthly Average AUM
Rs. 1,060.76 Crore Rs. 1,097.51 Crore
Name of Instrument Industry % to Net
Assets Financial Services 23.01% NAV (as on January 29, 2021)
Cholamandalam Investment Consumer Goods 15.57%
Direct Plan Dividend Option 31.2500
& Fin Co Ltd. Financial Services 4.56% Industrial Manufacturing 13.14%
The Federal Bank Ltd. Financial Services 3.66%
Direct Plan Growth Option 37.8820
Automobile 10.62% Regular Plan Dividend Option 23.2500
Dixon Technologies (india) Ltd. Consumer Goods 3.37%
Shriram Transport Finance Fertilisers & Pesticides 4.85% Regular Plan Growth Option 34.6060
Company Ltd. Financial Services 3.26% Construction 4.75%
SRF Ltd. Industrial Manufacturing 3.19%
IT 4.57% Minimum Investment Amount
Mphasis Ltd. IT 3.17%
Crompton Greaves Cons Cement & Cement Products 3.99% Rs. 5,000/- per application & in multiples of Re. 1/-
Electrical Ltd. Consumer Goods 3.06% Pharma 3.58% thereafter
Apollo Hospitals Enterprise Ltd. Healthcare Services 2.68%
Chemicals 3.17%
JK Cement Ltd. Cement & Cement Products 2.68%
Coromandel International Ltd. Fertilisers & Pesticides 2.56% Additional investment amount
City Union Bank Ltd. Financial Services 2.54% Rs. 500/- per application & in multiples of Re. 1/-
Jubilant Foodworks Ltd. Consumer Goods 2.39% Asset Allocation
Market Capitalization
(% of (%
total)
of total) thereafter
Ashok Leyland Ltd. Automobile 2.37%
Voltas Ltd. Consumer Goods 2.33%
PI Industries Limited Fertilisers & Pesticides 2.29% Exit Load
Gujarat Gas Ltd. Oil & Gas 2.15% 4.76%
MRF Ltd. Automobile 2.11%
• If the Units are redeemed / switched out on or
RBL Bank Ltd. Financial Services 2.04% before 12 months from the date of allotment – 1.00%
16.90%
Bharat Electronics Ltd. Industrial Manufacturing 1.97% • If the Units are redeemed / switched out after 12
Balkrishna Industries Ltd. Automobile 1.92% months from the date of allotment – Nil
Honeywell Automation India Ltd. Industrial Manufacturing 1.86%
Amber Enterprises India Ltd. Consumer Goods 1.84%
Tata Power Company Ltd. Power 1.70% Total Expense Ratios~:
Jindal Steel & Power Ltd. Metals 1.66% Regular Plan 2.21%
Escorts Ltd. Automobile 1.64% Direct Plan 0.77%
Max Financial Services Ltd. Financial Services 1.59% 78.34%
Cummins India Ltd. Industrial Manufacturing 1.59%
Minda Industries Ltd. Automobile 1.54%
IPCA Laboratories Ltd. Pharma 1.48%
Birlasoft Ltd. IT 1.40%
Other 29.40% Large cap Mid cap Small cap
Quantitative indicators Quantitative indicators As on January 29, 2021
25.33% 0.87 63
Sharpe Active
Ratio** bets
Std. Beta Total stocks
deviation 0.04 50.03% in portfolio
Top 10 stocks
@
Net Equity Portfolio Turnover Ratio^ Total Portfolio Turnover Ratio^
Equity F&O This product is suitable for investors who are seeking*
32.19% 98.24% 0.76
0.76 0.00
• Long Term Capital Growth
• Investments predominantly in equity and equity related
**Risk free rate of return (FIMMDA Overnight MIBOR) 3.47% | @ Top 10 Stock also includes the Future and Options securities of mid cap companies.
*Investors should consult their financial advisers if in
doubt about whether the product is suitable for them.
Fund Performance as on January 29, 2021 ^The Fund Manager may from time to time include other
equity and equity related securities outside the universe
Benchmark to achieve optimal portfolio construction
Scheme - Regular Plan Additional Benchmark
(Nifty Midcap 100 TR Index) (Nifty 50 TR Index)
Period
Returns* Value of Rs. 10000 Returns* Value of Rs. 10000 Returns* Value of Rs. 10000 Investors
Invested Invested Invested AT
E
understand
ER
OD
1 Year 20.75% 12,069 17.26% 11,721 15.27% 11,522 that their
M
3 Year 4.61% 11,445 1.16% 10,353 8.70% 12,841 principal
LOW
will be at
5 Year 13.75% 19,060 12.06% 17,684 13.94% 19,214
Very High Risk
Since Inception - Regular Plan 9.94% 34,606 8.09% 27,708 7.63% 26,218 RISKOMETER
Past performance may or may not be sustained in future and should not be used as a basis for comparison with other investments.
* CAGR Return.
Notes:
1. Different plans shall have different expense structure. The performance details provided herein are of Regular Plan of Edelweiss Mid Cap Fund. Returns are for Growth Option only. Since Inception
returns are calculated on Rs. 10/- invested at inception of the scheme. In case the start/end date is non business day, the NAV of previous day is used for computation.
2. The scheme is currently managed by Harshad Patwardhan (managing this fund from December 26, 2007). Please refer page no. 47 for name of the other schemes currently managed by the Fund
Managers and relevant scheme for performance.
3. Standard deviation and Sharpe ratio are annualized. 4. ^ Lower of sales or purchase divided by average AUM for last rolling 12 months.
5. Active bets are those where the fund have exposure away from the weightage as compared to benchmark. Source: Bloomberg.
6. Please note that Edelweiss Emerging Leaders Fund was merged with JP Morgan India Mid and Small Cap Fund and feature of JP Morgan India Mid and Small Cap Fund was retained with surviving
scheme name as Edelweiss Mid and Small Cap Fund. Further, performance details as per SEBI Circular dated April 12, 2018 of JP Morgan schemes prior to acquisition data is not provided.
10Edelweiss An open ended equity scheme
predominantly investing in small
Small Cap Fund cap stocks
Inception Date 07-Feb-19
Investment Objective (As on 29th January, 2021)
Fund Managers Details
The investment objective of the scheme is to generate long term capital appreciation from a portfolio that predominantly invests in equity and
equity related securities of small cap companies. Fund Managers Experience Managing Since
Mr. Harshad Patwardhan, 25 years 07-Feb-19
CFA.
Fund Size
Top Holdings as on January 29, 2021 Portfolio Analysis: Sector-Wise Month End AUM Monthly Average AUM
Rs. 614.85 Crore Rs. 638.40 Crore
Name of Instrument Industry % to Net
Assets Financial Services 14.83% NAV (as on January 29, 2021)
Dixon Technologies (india) Ltd. Consumer Goods 5.01% Industrial Manufacturing 14.67% Direct Plan Dividend Option 15.6110
JK Cement Ltd. Cement & Cement Products 3.40% Consumer Goods 13.35% Direct Plan Growth Option 15.6090
The Federal Bank Ltd. Financial Services 2.47% Services 9.61% Regular Plan Dividend Option 15.1410
APL Apollo Tubes Ltd. Metals 2.46% Regular Plan Growth Option 15.1420
Construction 8.27%
Laurus Labs Ltd. Pharma 2.25%
IT 5.98%
Multi Commodity Exchange Of
India Ltd. Financial Services 2.23% Metals 5.38%
Minimum Investment Amount
Orient Electric Ltd. Consumer Goods 2.04% Automobile 5.36% Minimum of Rs. 5,000/ and multiples of Re. 1/
Ratnamani Metals & Tubes Ltd. Metals 2.04% Pharma
thereafter.
5.04%
Brigade Enterprises Ltd. Construction 1.99%
Chemicals 4.88%
TCI Express Ltd. Services 1.98% Additional investment amount
Amber Enterprises India Ltd. Consumer Goods 1.97%
Rs.500/ and in multiples of Re. 1/ thereafter.
Mphasis Ltd. IT 1.96%
Indian Energy Exchange Ltd. Financial Services 1.91% Asset Allocation
Market Capitalization
(% of (%
total)
of total)
Aegis Logistics Ltd. Oil & Gas 1.82% Exit Load
Praj Industries Ltd. Industrial Manufacturing 1.74% If the Units are redeemed / switched out on or
KEC International Ltd. Construction 1.73% before 12 months from the date of allotment -1.00%
GMM Pfaudler Ltd. Industrial Manufacturing 1.73% If the Units are redeemed / switched out after 12
Gateway Distriparks Ltd. Services 1.70% 32.51% months from the date of allotment Nil
Subros Ltd. Automobile 1.70%
Birlasoft Ltd. IT 1.69% 67.49% Total Expense Ratios~:
Deepak Nitrite Ltd. Chemicals 1.67% Regular Plan 2.41%
Can Fin Homes Ltd. Financial Services 1.64% Direct Plan 0.85%
Teamlease Services Ltd. Services 1.62%
Mastek Ltd. IT 1.58%
Equitas Holdings Ltd. Financial Services 1.57%
Century Plyboards (india) Ltd. Consumer Goods 1.56%
Chambal Fertilizers &
Chemicals Ltd. Fertilisers & Pesticides 1.56%
Timken India Ltd. Industrial Manufacturing 1.55%
Small cap Mid cap
Mahindra Logistics Ltd. Services 1.54%
KEI Industries Ltd. Industrial Manufacturing 1.46%
Other 40.43%
Quantitative indicators Quantitative indicators As on January 29, 2021
70.24% Total stocks 25.87%
in portfolio Net Equity
Active Top 10 stocks
bets
71 98.74%
Portfolio Turnover Ratio^ Total Portfolio Turnover Ratio^
This product is suitable for investors who are seeking*
Equity F&O • Long Term Capital Appreciation Growth
0.68 0.00 0.68
• Investments predominantly in equity and equity related
securities of small cap companies.
*Investors should consult their financial advisers if in
doubt about whether the product is suitable for them.
Fund Performance as on January 29, 2021 ^The Fund Manager may from time to time include other
equity and equity related securities outside the universe
Benchmark Additional Benchmark to achieve optimal portfolio construction
Scheme - Regular Plan
(Nifty Smallcap 250 TRI) (Nifty 50 TR Index)
Period
Returns* Value of Rs. 10000 Returns* Value of Rs. 10000 Returns* Value of Rs. 10000
Invested Invested Invested E
Investors
AT
understand
ER
1 Year 26.32% 12,624 19.43% 11,937 15.27% 11,522
OD
that their
M
3 Year NA NA NA NA NA NA principal
LOW
5 Year NA NA NA NA NA NA will be at
Since Inception - Regular Plan 23.34% 15,142 12.72% 12,672 12.42% 12,605 Very High Risk
RISKOMETER
Past performance may or may not be sustained in future and should not be used as a basis for comparison with other investments.
* CAGR Return.
Notes:
1. Different plans shall have different expense structure.
2. The scheme is currently managed by Harshad Patwardhan (managing this fund from February 07, 2019). Please refer page no. 47 for name of the other schemes currently managed by the Fund
Managers and relevant scheme for performance.
3. Active bets are those where the fund have exposure away from the weightage as compared to benchmark. Source: Bloomberg.
11Edelweiss An open ended equity linked saving
scheme with a statutory lock in of
Long Term Equity 3 years and tax benefit
Fund (Tax Savings)
(Name of the Scheme was changed from Edelweiss ELSS Fund to Edelweiss
Long Term Equity Fund (Tax Savings) with effect from February 26, 2018) Inception Date 30-Dec-08
Investment Objective (As on 29th January, 2021)
Fund Managers Details
The primary objective of the Scheme is to generate long-term capital appreciation with an option of periodic payouts at the end of lock in
periods from a portfolio that invests predominantly in equity and equity related instruments. However, there is no assurance that the Fund Managers Experience Managing Since
investment objective of the Scheme will be realized and the Scheme does not assure or guarantee any returns. Mr. Harsh Kothari 8 years 30-Apr-19
Mr. Pratik Dharmshi 9 years 30-Apr-19
Top Holdings as on January 29, 2021 Portfolio Analysis: Sector-Wise Fund Size
Name of Instrument Industry % to Net Month End AUM Monthly Average AUM
Financial Services 32.51%
Assets Rs. 147.57 Crore Rs. 152.85 Crore
IT 13.46%
Infosys Ltd. IT 8.48% NAV (as on January 29, 2021)
Consumer Goods 13.30%
HDFC Bank Ltd. Financial Services 7.91% Direct Plan Dividend Option 22.5100
ICICI Bank Ltd. Financial Services 6.99% Oil & Gas 5.69%
Direct Plan Growth Option 59.4700
Housing Development Finance Construction 5.56%
Corp Ltd. Financial Services 4.68%
Regular Plan Dividend Option 16.9700
Pharma 5.40% Regular Plan Growth Option 54.1900
Axis Bank Ltd. Financial Services 4.05%
Bharti Airtel Ltd. Telecom 3.87% Automobile 5.19%
Reliance Industries Ltd. Oil & Gas 3.84% Telecom 3.87% Minimum Investment Amount
Larsen & Toubro Ltd. Construction 3.60% Cement & Cement Products 3.51% Rs. 500/- per application & in multiples of Re. 500/-
State Bank Of India Financial Services 2.27% thereafter
Industrial Manufacturing 3.35%
Mphasis Ltd. IT 2.15%
Dixon Technologies (india) Ltd. Consumer Goods 2.01% Additional investment amount
Hindustan Unilever Ltd. Consumer Goods 2.00%
Rs. 500/- per application & in multiples of Re 500/-
ITC Ltd. Consumer Goods 1.77% Market Capitalization (% of total)
Tata Consultancy Services Ltd. IT 1.65% thereafter
Ultratech Cement Ltd. Cement & Cement Products 1.63%
Honeywell Automation India Ltd. Industrial Manufacturing 1.56% Exit Load Nil
Minda Industries Ltd. Automobile 1.45%
Mahindra Logistics Ltd. Services 1.40% 10.25%
Total Expense Ratios~:
Divi's Laboratories Ltd. Pharma 1.35%
Maruti Suzuki India Ltd. Automobile 1.31% Regular Plan 2.37%
Bajaj Finance Ltd. Financial Services 1.28% Direct Plan 0.69%
19.41%
Crompton Greaves Cons
Electrical Ltd. Consumer Goods 1.26%
Amber Enterprises India Ltd. Consumer Goods 1.24%
JK Cement Ltd. Cement & Cement Products 1.23% 70.34%
Kotak Mahindra Bank Ltd. Financial Services 1.21%
HCL Technologies Ltd. IT 1.18%
Century Plyboards (india) Ltd. Consumer Goods 1.18%
Ashok Leyland Ltd. Automobile 1.16%
Equitas Holdings Ltd. Financial Services 1.09%
Large cap Mid cap Small cap
Brigade Enterprises Ltd. Construction 1.01%
Other 24.19%
Quantitative indicators Quantitative indicators As on January 29, 2021
22.07% Sharpe 0.95 Total stocks 45.78%
Ratio** in portfolio
Std. Beta Active
deviation -0.01 59 bets
Top 10 stocks Net Equity Portfolio Turnover Ratio^ Total Portfolio Turnover Ratio^
47.84% 97.14% Equity F&O
0.00 0.50
0.50
This product is suitable for investors who are seeking*
**Risk free rate of return (FIMMDA Overnight MIBOR) 3.47%
• To create wealth in the long term
• Investment in equity and equity-related securities that
Fund Performance as on January 29, 2021 will be locked-in for the first three years.
*Investors should consult their financial advisers if in
Benchmark Additional Benchmark
Scheme - Regular Plan doubt about whether the product is suitable for them.
(Nifty 500 TR Index) (Nifty 50 TR Index)
Period
Returns* Value of Rs. 10000 Returns* Value of Rs. 10000 Returns* Value of Rs. 10000
Invested Invested Invested E
Investors
AT
10.74% 11,070 15.87% 11,582 15.27% 11,522 understand
ER
1 Year
OD
that their
M
3 Year 3.15% 10,974 6.49% 12,073 8.70% 12,841
principal
5 Year 9.99% 16,104 13.61% 18,938 13.94% 19,214
LOW
will be at
Since Inception - Regular Plan 15.00% 54,190 15.37% 56,300 14.76% 52,845 Very
RISKOMETER
High Risk
Past performance may or may not be sustained in future and should not be used as a basis for comparison with other investments.
* CAGR Return.
Notes:
1. Different plans shall have different expense structure. The performance details provided herein are of Regular Plan of Edelweiss Long Term Equity Fund (Tax Savings). Returns are for Growth Option
only. In case the start/end date is non business day, the NAV of previous day is used for computation.
2. The scheme is currently managed by Mr. Harsh Kothari and Mr. Pratik Dharmshi (Managing since April 30, 2019). Please refer page no. 47 for name of the other schemes currently managed by the
Fund Managers and relevant scheme for performance.
3. Standard deviation and Sharpe ratio are annualized.
4. ^ Lower of sales or purchase divided by average AUM for last rolling 12 months.
5. Active bets are those where the fund have exposure away from the weightage as compared to benchmark. Source: Bloomberg.
12Edelweiss An open ended scheme investing in
Arbitrage Fund arbitrage opportunities
Investment Objective (As on 29th January, 2021) Inception Date 27-Jun-14
The investment objective of the Scheme is to generate income by predominantly investing in arbitrage opportunities in the cash and the Fund Managers Details
derivative segments of the equity markets and the arbitrage opportunities available within the derivative segment and by investing the
balance in debt and money market instruments. However, there is no assurance that the investment objective of the Scheme will be realized. Fund Managers Experience Managing Since
Equity Portion:
Top Holdings as on January 29, 2021 Portfolio Analysis: Sector-Wise Mr. Bhavesh Jain 11 years 27-Jun-14
(Quantity fully hedged against derivative) Debt Portion:
Name of Instrument Industry % to Net Mr. Dhawal Dalal 21 years 22-Dec-16
Financial Services 16.52%
Assets
Pharma 8.41%
Bharti Airtel Ltd. Telecom 4.16% Fund Size
Metals 7.10%
ICICI Bank Ltd. Financial Services 3.38%
Tata Steel Ltd. Metals 3.09% Consumer Goods 7.08% Month End AUM Monthly Average AUM
Sun Pharmaceutical Telecom 5.84%
Rs. 3,323.48 Crore Rs. 3,272.18 Crore
Industries Ltd. Pharma 2.78%
Services 4.12%
Housing Development Finance NAV (as on January 29, 2021)
Corp Ltd. Financial Services 2.50% Automobile 3.55%
Cipla Ltd. Pharma 2.01% Direct Plan Dividend Option 11.1678
IT 3.09%
Adani Ports & Special Economic Direct Plan Monthly Dividend Option 12.8334
Oil & Gas 2.62%
Zone Ltd. Services 1.96% Direct Plan Growth Option 15.6222
JSW Steel Ltd. Metals 1.93% Cement & Cement Product 2.06%
Regular Plan Dividend Option 11.0198
Grasim Industries Ltd. Cement & Cement Products 1.77%
Adani Enterprises Ltd. Services 1.76% Regular Plan Monthly Dividend Option 12.2688
Vodafone Idea Ltd. Telecom 1.66% Regular Plan Growth Option 15.0174
Reliance Industries Ltd. Oil & Gas 1.47% Asset Allocation (% of total)
HCL Technologies Ltd. IT 1.45% Minimum Investment Amount
Divi's Laboratories Ltd. Pharma 1.33%
Axis Bank Ltd. Financial Services 1.28% Rs. 5,000/- per application & in multiples of Re. 1/-
4.87%
Pidilite Industries Ltd. Chemicals 1.27% thereafter.
Tata Power Company Ltd. Power 1.22%
Indiabulls Housing Finance Ltd. Financial Services 1.17% Additional investment amount
Asian Paints Ltd. Consumer Goods 1.11%
Punjab National Bank Financial Services 1.11% 27.66% Rs. 500/- per application & in multiples of
Tata Consumer Products Ltd. Consumer Goods 1.10% Re. 1/- thereafter
ITC Ltd. Consumer Goods 1.08%
Havells India Ltd. Consumer Goods 1.07%
Exit Load
Larsen & Toubro Ltd. Construction 1.04%
Vedanta Ltd. Metals 1.03% 67.47%
• If the units are redeemed / switched out on or
Maruti Suzuki India Ltd. Automobile 0.84%
before 30 days from the date of allotment - 0.10%
HDFC Bank Ltd. Financial Services 0.78%
Bajaj Finance Ltd. Financial Services 0.77% • If the Units are redeemed / switched out on after 30
Escorts Ltd. Automobile 0.76% days from the date of allotment - Nil
Equities Debt Cash & Other Receivables
The Federal Bank Ltd. Financial Services 0.76%
Other 52.36%
Total Expense Ratios~:
Regular Plan 1.09%
Quantitative indicators As on January 29, 2021
Direct Plan 0.39%
0.27 0.28
Yield to years Average years Std. 2.47
maturity (YTM)# Maturity# deviation Beta
Modified Macaulay# Sharpe
Duration# 0.27 Duration 0.80% Ratio**
3.39% years 0.63
Total stocks
in portfolio Top 10 stocks Portfolio Turnover Ratio^ Total Portfolio Turnover Ratio^
115 25.34% Equity F&O Debt This product is suitable for investors who are seeking*
13.69
3.52 10.02 0.14
• To generate income by predominantly investing in
arbitrage opportunities.
# Yield to maturity (YTM), Modified Duration, Average Maturity and Macaulay Duration for Debt Portion. • Investments predominantly in arbitrage opportunities
**Risk free rate of return (FIMMDA Overnight MIBOR) 3.47% in the cash and derivative segments of the equity
markets and the arbitrage opportunities available
within the derivative segment and by investing the
Fund Performance as on January 29, 2021 balance in debt and money market instruments.
*Investors should consult their financial advisers if in
Benchmark Additional Benchmark
Scheme - Regular Plan $ doubt about whether the product is suitable for them.
(Nifty 50 Arbitrage PR Index ) (Nifty 50 TR Index)
Period
Returns* Value of Rs. 10000 Returns* Value of Rs. 10000 Returns* Value of Rs. 10000
Invested Invested Invested E
Investors
AT
4.09% 10,408 1.84% 10,184 15.27% 11,522 understand
ER
1 Year
OD
that their
M
3 Year 5.44% 11,720 4.42% 11,385 8.70% 12,841
principal will
5 Year 5.79% 13,253 4.77% 12,626 13.94% 19,214
LOW
be at low risk
Since Inception - Regular Plan 6.36% 15,017 5.47% 14,214 10.80% 19,677
RISKOMETER
Past performance may or may not be sustained in future and should not be used as a basis for comparison with other investments.
* CAGR Return.
Notes:
1. Different plans shall have different expense structure. The performance details provided herein are of Regular Plan of Edelweiss Arbitrage Fund. Returns are for Growth Option only. Since
Inception returns are calculated on Rs.10/- invested at inception of the scheme. In case the start/end date is non business day, the NAV of previous day is used for computation.
2. The scheme is currently managed by Bhavesh Jain (managing this fund from June 27, 2014) and Mr. Dhawal Dalal (Managing this fund from December 22, 2016). Please refer page no. 47 for
name of the other schemes currently managed by the Fund Managers and relevant scheme for performance.
3. Standard deviation and Sharpe ratio are annualized.
4. ^ Lower of sales or purchase divided by average AUM for last rolling 12 months.
5. $ Nifty 50 Arbitrage TR Index is not available on NSE Website
13You can also read