A novel art of continuous noninvasive blood pressure measurement
←
→
Page content transcription
If your browser does not render page correctly, please read the page content below
ARTICLE
                  https://doi.org/10.1038/s41467-021-21271-8                 OPEN

                  A novel art of continuous noninvasive blood
                  pressure measurement
                  Jürgen Fortin         1 ✉,   Dorothea E. Rogge2, Christian Fellner1, Doris Flotzinger1, Julian Grond1, Katja Lerche1 &
                  Bernd Saugel          2,3
1234567890():,;

                  Wearable sensors to continuously measure blood pressure and derived cardiovascular
                  variables have the potential to revolutionize patient monitoring. Current wearable methods
                  analyzing time components (e.g., pulse transit time) still lack clinical accuracy, whereas
                  existing technologies for direct blood pressure measurement are too bulky. Here we present
                  an innovative art of continuous noninvasive hemodynamic monitoring (CNAP2GO). It directly
                  measures blood pressure by using a volume control technique and could be used for small
                  wearable sensors integrated in a finger-ring. As a software prototype, CNAP2GO showed
                  excellent blood pressure measurement performance in comparison with invasive reference
                  measurements in 46 patients having surgery. The resulting pulsatile blood pressure signal
                  carries information to derive cardiac output and other hemodynamic variables. We show that
                  CNAP2GO can self-calibrate and be miniaturized for wearable approaches. CNAP2GO
                  potentially constitutes the breakthrough for wearable sensors for blood pressure and flow
                  monitoring in both ambulatory and in-hospital clinical settings.

                  1 CNSystems Medizintechnik GmbH, Reininghausstrasse 13, 8020 Graz, Austria. 2 Department of Anesthesiology, Center of Anesthesiology and Intensive

                  Care Medicine, University Medical Center Hamburg-Eppendorf, Martinistrasse 52, 20246 Hamburg, Germany. 3 Outcomes Research Consortium, Cleveland,
                  OH, USA. ✉email: juergen.fortin@cnsystems.com

                  NATURE COMMUNICATIONS | (2021)12:1387 | https://doi.org/10.1038/s41467-021-21271-8 | www.nature.com/naturecommunications                        1
ARTICLE                                                                   NATURE COMMUNICATIONS | https://doi.org/10.1038/s41467-021-21271-8

T
        he digital revolution is about to bring innovations to                medical fields, especially in critical care and anesthesiology22.
        physiologic monitoring1. Innovative wearable sensors for              These devices are based on the vascular unloading technique
        monitoring of cardiovascular dynamics have the potential              (VUT), also referred to as volume clamp or Peňáz method23–25.
to revolutionize the monitoring of vital signs and their response             The VUT measures BP and derives the complete pulsatile BP
to therapy in both ambulatory and in-hospital clinical settings.              waveform by controlling fast inflation and deflation of a finger
Continuous real-time monitoring of cardiovascular dynamics—                   cuff in combination with PPG. As with time-based technologies,
including arterial blood pressure (BP) and advanced hemody-                   the VUT is influenced by changes in vasomotor activity; different
namic variables that are derived from its waveform (stroke                    devices have found differing methods to detect and compensate
volume, cardiac output (CO), and dynamic cardiac preload                      for changes in vasomotor tone26–28. VUT devices do not neces-
variables)—is a mainstay of patient care in perioperative and                 sarily need calibration for proper functioning. Instead, the
intensive care medicine but, for the most part, still requires                Finapres (Ohmeda Monitoring Systems, Englewood, CO, USA)
invasive or stationary noninvasive sensors2,3. With the availability          and successor devices use a heart level sensor and/or a transfer
of noninvasive and wearable sensors, advanced cardiovascular                  function to provide estimates of brachial BP values29,30. CNAP
monitoring may become part of patient surveillance on normal                  devices (CNSystems Medizintechnik, Graz, Austria) have a dif-
wards4 and even outside the hospital5. Upgrading patient mon-                 ferent approach: they routinely use an upper arm cuff for
itoring capabilities with wearable solutions designed for normal              orthostatic/heart level correction and for calibration to brachial
wards may help avoid intensive care unit overload (as seen during             BP level31. A transfer function approach is also used as a tem-
the COVID-19 crisis)6.                                                        porary correction until the calibration is performed or if the user
   For these clinical applications, wearable sensors have to fulfill           does not want to use the upper arm cuff.
all regulatory and clinical demands of medical-grade devices—                    Existing VUT systems are, however, too bulky to be used for
just as their stationary counterparts. Challenges for future                  wearable monitoring devices because the systems consist of
developments in the field of wearable miniaturized monitoring                  mechanical elements like pumps, valves, and air hoses to follow
sensors will be to provide measurements with clinically acceptable            the pulsatile nature of BP with high fidelity.
accuracy, precision, and reliability and to ensure clinical usability            It was generally believed that, for correct BP measurement
and patient safety. Ideally, miniaturized monitoring sensors                  based on VUT, a constant (or clamped) blood volume in the
measure in the background without user interaction. At the                    finger over the complete period of pulsation and therefore full
moment, wearable sensors for continuous BP monitoring still                   vascular unloading of the blood vessels is essential. Whether this
show poor measurement performance7 and have, therefore, not                   is indeed physiologically or metrologically necessary was never
been adopted into clinical practice.                                          examined.
   Most current wearable BP monitoring systems estimate BP based                 The basic idea behind our novel art of continuous noninvasive
on time information. Pulse time interval or pulse velocity methods            BP measurement, CNAP2GO, is to perform the blood volume
use a proximal and a distal sensor for the measurement of the pulse           control substantially more slowly to be able to use slow-moving
transit time or pulse arrival time8. Other time-based methods for             and, therefore, small-scaled hardware. Most importantly, such
BP estimation use sensors that decompose the pulse into a forward             hardware requires neither a pump nor a valve. The basic principle
and a backward wave to analyze their time differences9,10. There              of the CNAP2GO method is the volume control technique
are also attempts to use photo-plethysmographic (PPG)11 or pie-               (VCT). In contrast to the VUT, which keeps the blood volume in
zoelectric12 pulse detection for the estimation of BP based on                the finger artery constant on a millisecond basis to accurately
amplitude and time information. However, a direct translation of              follow the full cardiac cycle, the VCT keeps the volume constant
the pulse signal—which is a surrogate for volume changes—into                 on a time scale of heartbeats. Blood volume is allowed to oscillate
continuous BP is challenging because of confounding effects of the            over heartbeats, balancing inflow and outflow of blood in the
cardiovascular, respiratory, and autonomic nervous systems. By                finger artery over each heart cycle. Controlling blood volume by
enhancing model complexity (e.g., using machine learning and                  VCT without fast oscillations poses a non-trivial control engi-
neural network tools), the measurement performance of these                   neering problem, which is solved using a set of signal processing
approaches may be improved11,13,14. Although their sensor hard-               algorithms. Most importantly, as we will demonstrate, this
ware is very simple, significant work is still needed to achieve               method is resistant to changes in vasomotor tone.
clinically acceptable performance8,11,15,16. The difficulty with time-            In this paper, we first describe the elements of CNAP2GO and
based approaches for wearable BP measurement devices seems to                 how they interact to derive a continuous BP waveform from the
be that the variables of the mathematical models need to change               directly measured mean BP (mBP) and the PPG signal. We show
along with changes in vasomotor activity of the vascular smooth               that the BP waveform can be used to estimate advanced hemo-
muscles which are determined by the autonomic nervous system.                 dynamic variables. The VCT was implemented in software and
All of these cuff-less attempts of continuous BP monitoring require           placed on the hardware of an existing VUT-device that emulates
frequent re-calibration, for example using cuff-based sphygmo-                slow VCT. The accuracy of the CNAP2GO software prototype
manometers, rendering them unfeasible for wearable wireless                   was clinically validated in comparison with invasive BP mea-
monitoring17,18.                                                              surements obtained using a radial arterial catheter in patients
   Other wearable approaches based on the oscillometric principle             having surgery with general anesthesia. The CNAP2GO method
provide BP values intermittently. For example, the HeartGuide                 can, in the future, be used for small wearable sensors integrated in
(Omron, Kyoto, Japan) is a wrist-worn watch-type oscillometric                a finger-ring utilizing a light transmitter (LED) and a receiver
BP monitoring device19. Another innovative approach measures                  (photodiode). The contact pressure of LED and photodiode can
oscillometric curves by pressing a finger on a cell phone                      be modified by an actuator changing the ring diameter with a
screen20,21. While this research shows that oscillometric BP                  rate-of-change as fast (or rather: as slow) as mBP.
measurement at the finger is feasible, these methods need user                    A wearable approach of an actuator is demonstrated and its
interaction (keeping the sensor at heart level or pressing a finger            feasibility is shown. This actuator is able to produce a typical
on the screen) and automated continuous BP monitoring                         oscillometric curve measurement including its envelope derived
(including monitoring during night sleep) is not possible.                    from the PPG signal v(t), which is the basis for VCT. Using this
   Stationary finger cuff devices have been successfully introduced            envelope, the method can automatically self-calibrate to oscillo-
for direct continuous noninvasive BP monitoring in various                    metric systolic BP (sBP) and diastolic BP (dBP). For a clinically

2                 NATURE COMMUNICATIONS | (2021)12:1387 | https://doi.org/10.1038/s41467-021-21271-8 | www.nature.com/naturecommunications
NATURE COMMUNICATIONS | https://doi.org/10.1038/s41467-021-21271-8 ARTICLE
LED of mBP by altering the contact pressure and detecting the
Finger Actuator
corresponding PPG pulse-amplitudes from the signal vPulse(t).
Figure 3 shows how a typical oscillometric curve including its
p(t)
envelope is obtained. Figure 3a shows the resulting v(t) when a
pressure ramp pc(t) is applied. The p-v transfer function corre-
Photodiode sponds to an S-shaped arcus tangent with superimposed pulses32.
v(t) The upper asymptote of v(t), where pc(t) is far above sBP, cor-
responds to the maximum light that can be detected from the
finger when all blood is squeezed out and no pulses can be
Fig. 1 Actuator within CNAP2GO. Within CNAP2GO, the element for
detected. The lower asymptote is at pc(t) = 0 where no defor-
constant pressure coupling is a simple, slow-moving actuator that can vary
mation of the finger and its artery occurs (although this is a
the contact pressure p(t) of the light elements (light-emitting diode and
theoretical point of measurement because a minimum contact
photodiode) as fast as mean blood pressure may change. v(t): light signal.
pressure is needed for proper light coupling). The amplitudes of
the v(t)-pulses are derived from the high-pass filtered vPulse(t).
meaningful continuous BP signal, an integrated heart level sensor The amplitudes of vPulse(t) are fitted using a Gaussian-style
utilizing an electronic XYZ-axis accelerometer and gyroscope in envelope curve, as can be seen in Fig. 3b. The peak of this
addition to a suitable transfer function will be applied. As user envelope indicates mBP according to the maximum oscillation
interaction is not required, CNAP2GO may be used in a broad rule33, a principle which also holds true when using PPG sig-
range of medical applications. nals34–36. After oscillometric envelope determination, the system
applies mBP as initial contact pressure pc(t) and stores this value
Results as the starting setpoint P0 and its PPG companion v0. For cali-
Basic CNAP2GO considerations. The CNAP2GO sensor is a bration purposes, sBP and dBP can be determined.
PPG probe which comprises an LED and a photodiode. The While this open-loop phase is very similar to the basic
contact pressure of these light elements to the skin can be oscillometric principle, as well as to standard VUT, the closed-
modified. Even simple PPG probes (e.g., pulsoxymeter) have loop of CNAP2GO differs in almost all fundamental aspects.
elements that couple the light components to the body with
pressure: this is usually a spring, Velcro, or another simple clamp
mechanism. A constant pressure (around 20–30 mmHg) ensures Tracking mBP. After the closed-loop phase, the mean cuff
good light coupling. Within CNAP2GO, a simple actuator can pressure pC(t) is located on the inflection point of the S-shaped
vary the contact pressure of the light elements as fast as mBP may p-v transfer function. As shown in Fig. 4a, the ideal pulsatile
change (Fig. 1). As a consequence, the system wins an additional vPulse(t) (light blue trace) has maximum amplitude and the
degree of freedom which is needed for continuous BP measure- integral of vPulse(t) over a full beat is zero. Thus, the main con-
ment as it can determine the oscillometric curve. dition of the VCT, which keeps blood volume in the finger artery
The basic idea of varying contact pressure is also implemented balanced over a heart cycle, is fulfilled.
in all existing devices based on the VUT. When using the VUT, As soon as BP or vasomotor changes occur, the situation
the speed and amplitude of the changes in contact pressure becomes different. If pC(t) is lower than mBP (p),
fidelity pressure waveforms. For example, the pressure system of vPulse(t) has also a lower amplitude, but the pulses are spiky (dark
the CNAP devices can apply pressure changes with more than blue trace).
1500 mmHg/s. Figure 4b shows how vasoconstriction influences the p-v
transfer function: while the upper asymptote for pC(t) >> sBP
remains unchanged, the lower asymptote for pC(t)ARTICLE NATURE COMMUNICATIONS | https://doi.org/10.1038/s41467-021-21271-8
Fig. 2 Block diagram and signal flow of CNAP2GO. An LED-light is directed through a finger and its absorption is measured by a photodiode depending on
arterial pressure pa(t). The resulting photo-plethysmographic signal v(t) is led into digital filters producing vPulse(t), vRhythm(t), and vVCT(t). Signal
components vRhythm(t) and vVCT(t) are used to control the pressure pc(t), whereas vPulse(t) together with pc(t) are needed for the calculation of the pulsatile
blood pressure signal pC2G(t). The control loop using a proportional-integral-differential controller PIDRhythm and the volume control technique (VCT) is
closed using antiresonance elements. f: frequency, VLF: very low-frequency cutoff, k: amplification factor.
a b
S-shaped p-v transfer function Oscillometric envelope
pC(t) [mmHg] v(t) [1] pC(t) [mmHg] vPulse(t) [1]
200 1 200
160 0.8 160
High-pass filtered vPulse(t)
pC(t)
120 0.6 120
v(t) sBP
80 0.4 80 mBP
Highest vPulse(t) amplitude:
dBP
pc(t) equals mBP pc(t)
40 0.2 40
0 0 0
0 2 4 6 8 10 12 14 0 2 4 6 8 10 12 14
Time [s] Time [s]
Fig. 3 Depiction of a typical oscillometric curve including its envelope. a The resulting v(t) (solid blue line) when a pressure ramp pc(t) is applied (ideal
pressure ramp shown as the gray line). Averaged signal (dashed-dotted line). The green dot indicates the pressure where the light pulsations are highest.
b Amplitudes of vPulse(t) (thin solid line) are fitted using a Gaussian-style envelope curve (thick solid line). Systolic (sBP), diastolic (dBP), and mean blood
pressure (mBP) can be derived from those curves. The gray line shows the measured pressure signal pc(t).
of the setpoint pn. Vasodilation shifts the S-curve in the opposite function known from literature29,37. The same is true for finger
way and VCT decreases pn. oscillometric algorithms including its parametrization38, although
a detailed development work including validation will be needed.
Calibration. CNAP2GO’s pC(t) tracks mBP and, with a simple
calculation, the pulsatile nature of BP can be superimposed using
vPulse(t): CNAP2GO prototype implementation. We implemented the
CNAP2GO mechanism as a software prototype into existing
sBPinit dBPinit hardware. A commercially available CNAP Monitor HD was
pC2G ðt Þ ¼ pC ðt Þ þ k vPulse ðt Þ whereas k ¼
vsys vdia adapted via software (see Methods section) to turn its VUT into
ð1Þ VCT (CNAP2GO). Although the CNAP hardware in principle
allows for the fast pulsatile BP changes as necessary for VUT, the
where sBPinit and dBPinit are calibration values and vsys and vdia speed of pressure changes was inherently limited by the software
are maxima and minima of vPulse(t) during the initial phase. design of CNAP2GO as described in this article.
The calibration values sBPinit and dBPinit can be obtained as There were three reasons for this approach: First, the hardware
external (e.g., brachial) values or from the initial phase (see of the CNAP Monitor HD has international regulatory approval
Fig. 3). sBPinit and dBPinit retrieved from finger oscillometry will for use in patients. Second, the experiments could be performed
need a heart level correction sensor as well as an adapted transfer prior to expensive investments into miniaturization. And finally,
4 NATURE COMMUNICATIONS | (2021)12:1387 | https://doi.org/10.1038/s41467-021-21271-8 | www.nature.com/naturecommunicationsNATURE COMMUNICATIONS | https://doi.org/10.1038/s41467-021-21271-8 ARTICLE
Table 1 Participant characteristics and results of Bland
Altman analysis for mean blood pressure.
Participant characteristics
Characteristic Value
Male/female, n 14/6
Age, median (range) [years] 36 (23–49)
Actual body weight, median (range) [kg] 79 (56–130)
Height, median (range) [cm] 177 (161–189)
CNAP Monitor HD sBP, median 108 (74–141)
(range) [mmHg]
CNAP Monitor HD dBP, median 64 (47–102)
(range) [mmHg]
CNAP Monitor HD mBP, median 82 (63–116)
(range) [mmHg]
Bland Altman analysis for mBP
Statistical quantity Value
Mean of the differences±SD [mmHg] 0.3 ± 4.4
95% limits of agreement [mmHg] −8.3 to 8.9
sBP systolic blood pressure, dBP diastolic blood pressure, mBP mean blood pressure, SD
standard deviation of the lab test series versus the CNAP Monitor. Total number of data points
was n = 400 (i.e., 20 data points per participant).
the operating room. The sphygmomanometer of the CNAP
Monitor HD was used for calibration.
Lab tests versus CNAP Monitor HD. Lab tests were performed
in 20 healthy subjects (Table 1). In Fig. 5a and b, the BP and CO
trends of the standard CNAP Monitor HD (VUT) and the
CNAP2GO are shown, respectively. In order to provoke the
cardiovascular system and induce changes in BP and vasomotor
activity, the subjects performed several physiological maneuvers
(deep breathing, fast breathing, submersion of contralateral hand
into ice water, stroop test, passive leg raising) within 30 min.
The mean of the differences and its standard deviation between
mBP measured with CNAP2GO and with CNAP Monitor HD
were 0.3 ± 4.4 mmHg.
Occasionally, unexpected motion artifacts appeared synchro-
nously in BP signal streams of both the CNAP2GO and the
CNAP Monitor HD. Movement only very briefly disturbed BP
signal quality for both the CNAP2GO and the CNAP Monitor
HD and the BP signal quality recovered immediately. Rapid
signal recovery after signal alterations by finger movement is a
characteristic feature of the existing CNAP method that we also
implemented in the CNAP2GO method.
Fig. 4 S-shaped p-v transfer function. a The optimum pulsatile light signal CO was calculated using the proprietary CNAP HD pulse wave
vPulse(t) (light blue trace) at optimal pressure p0 has maximum amplitude analysis39. The bias between CNAP2GO CO and CNAP Monitor
with an integral over a full beat of zero. Suboptimal signals at too high (p>) HD CO was 1.4 ± 0.6 L/min with a percentage error (PE) of 22%.
or too low (pARTICLE NATURE COMMUNICATIONS | https://doi.org/10.1038/s41467-021-21271-8
a 120
110
100
90
BP [mmHg]
80
70
60
Stroop
50
PLR
Vals
DB
Ice
FB
40
0 5 10 15 20 25 30
b 10
9
8
7
6
CO [L/min]
5
4
3
2
Stroop
PLR
Vals
DB
Ice
FB
1
0
0 5 10 15 20 25 30
Time [min]
Fig. 5 Sample blood pressure (BP) and cardiac output trend traces. Data were taken from lab test measurements during physiological activities: “DB”: deep
breathing, “FB”: fast breathing, “Ice”: submersion of hand in ice water, “Stroop”: color stroop test, “PLR”: passive leg raising, “Vals”: Valsalva test. a Beat-to-beat
systolic, diastolic, and mean blood pressure values derived by CNAP Monitor HD (dark blue) and by CNAP2GO (light blue). b Cardiac output (CO) derived by
CNAP Monitor HD (dark blue) and by CNAP2GO (light blue).
study. Invasive blood pressure (IBP) was recorded during routine deviations ranging from 1.1 to 6.3 mmHg (interquartile range from
care. We compared mBP measured using CNAP2GO and mBP 2.0 to 3.4 mmHg), indicating that the intra-subject difference
measured using a radial arterial catheter (invasive reference to invasive reference was both stable as well as small for mBP values.
method, clinical gold standard) during a period of about 45 min The rate of actuator pressure change, which according to VCT
(Table 2). mBP ranged from 45 to 113 mmHg and thus covered follows mBP, was analyzed in detail. The absolute changes in mBP
hypo- as well as hypertensive phases. In the Bland Altman plot of consecutive heartbeats (n = 97,432) were inspected together with
(Fig. 6a), we used color coding to illustrate measurements from the the corresponding pulse intervals and the resulting need for actuator
same patient, thus visualizing patient-specific offsets. Clustering speed. The contact pressure of CNAP2GO required a median
indicates that patient-specific offsets remained similar throughout changing speed of about 1.4 mmHg per beat or 1.3 mmHg/s, the
the recording which, in turn, indicates that CNAP2GO BP mea- maximum values were 24.4 mmHg per beat or 25 mmHg/s.
surements were stable over the measurement period. The bench- Figure 7 shows the spectra of the contact pressure pc(t) in
mark for acceptance was derived from the ISO 81060-2 (5 ± 8 comparison with the frequency content of the whole pulsatile BP
mmHg). mBP from calibrated CNAP2GO and from the arterial signal, demonstrating how much the control was slowed down for
catheter differed by −1.0 ± 7.0 mmHg over all patients. CNAP2GO.
When individually analyzing the data of each measurement, the
mean of the differences for mBP ranged from −14.6 to 11.4 mmHg Wearable implementation. The results of the clinical study
(interquartile range from −4.0 to 2.9 mmHg) with standard reveal important findings for miniaturization of CNAP2GO.
6 NATURE COMMUNICATIONS | (2021)12:1387 | https://doi.org/10.1038/s41467-021-21271-8 | www.nature.com/naturecommunicationsNATURE COMMUNICATIONS | https://doi.org/10.1038/s41467-021-21271-8 ARTICLE
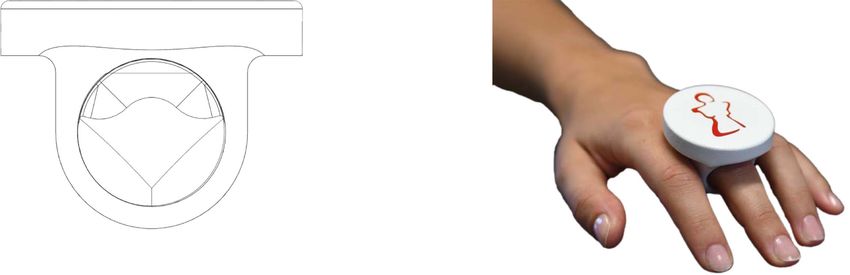
Miniaturized CNAP2GO requires a small, low power actuator located in a finger-ring, Fig. 8b shows a 3D print of a possible
with a maximum speed of at most 25–30 mmHg/s, with an CNAP2GO finger-ring.
average speed of about 1.4 mmHg per beat. The actuator in Signal coupling of the PPG elements stayed constant with
interaction with the PPG system has to provide a correct oscil- a pC(t) higher than a minimum contact pressure of about
lometric signal, needed for both the initial calibration and VCT 20–40 mmHg. The fluid-filled bladder was located in a finger-
principle. Here, correct means that the PPG signal has its origin ring. While we were focusing in this present prototype on the
only in the body segment and is not influenced by the mechanics wearable sensor geometry, we used a small commercially available
of the sensor, e.g., a better signal coupling of the PPG elements infusion pump as a fluid compressing driver.
due to higher actuator pressure. A constant signal-coupling over We were able to demonstrate that this wearable fluid-filled
the complete pressure range can be achieved only with a homo- bladder concept is able to produce correct oscillometric signals by
genous pressure at the finger which underlines the essential role testing the system within 7 subjects in comparison to the existing
of sensor geometry. CNAP sensor. Results in comparison to a standard CNAP device
Different prototypes were tested, the most promising system are shown in Fig. 9a–n. Figures 10 and 11 show more details of
being a fluid-filled bladder containing the PPG elements in the resulting oscillometric signals of subject 1.
combination with a small motor compressing the fluid. Fluids can
be incompressible gels or oils, for our experiment we used Important findings for the miniaturized actuator. Drivers for
distilled water. Figure 8a shows a schematic of the actuator actuators such as small printable piezoelectric motors are avail-
able with two important features: Low power consumption, but
high enough stall torque to keep the actuator in its current
Table 2 Clinical study versus invasive reference method. position when no movement is needed. This has the effect that no
energy is needed if mBP does not change.
Patient characteristics We made basic calculations for a wearable CNAP2GO sensor
Characteristic Value using the data from a commercially available step motor
Male/female, n 19/27 (PCBMotor ApS, Ballerup, Denmark) to prove that the required
Age, median (range) [years] 56 (25–79) pressure changes are feasible. We chose a printable motor with an
Actual body weight, median (range) [kg] 77.5 (46–130) outer diameter of 30 mm that can be integrated in the plate of a
Height, median (range) [cm] 171.5 (157–192)
Invasive sBP, median (range) [mmHg] 104 (60–172) CNAP2GO finger-ring. This motor can change the volume in the
Invasive dBP, median (range) [mmHg] 56 (29–103) fluid-filled bladder and thus contact pressure of the PPG elements
Invasive mBP, median (range) [mmHg] 78 (48–131) via a gear from the motor. With a transmission ratio of the gear
element higher than 20.27, this component has a high enough
Bland Altman analysis for mBP stall torque so that no energy is consumed as long as mBP is
Statistical quantity Value
stable. With such a fluid-filled transmission system, the motor
should theoretically change contact pressure for 1 mmHg within
Mean of the differences±SD [mmHg] −1.0 ± 7.0
10 ms. Assuming additional time due to control loops and further
95% limits of agreement [mmHg] −14.8 to 12.7
tolerances, we assume that a rate of pressure changes of up to
Patient characteristics and results of Bland Altman analysis for mean blood pressure. sBP systolic 30 mmHg/s could be achieved with this particular piezo motor.
blood pressure, dBP diastolic blood pressure, mBP mean blood pressure, SD standard deviation of
the clinical study versus invasive reference method. Total number of data points was n = 11,803.
In miniaturized CNAP2GO, readjustments of pc(t) to follow
mBP will be done as soon as the beat detector of the system has
a 40 b
Color mapping: data of one patient have the same color 60
30
40
20
CNAP2GO - IBP [mmHg]
delta-CNAP2GO-BP [mmHg]
20
10 Confidence
interval:
95% of all
Data points
0 0
-10
-20
-20
-40
-30
-40 -60
40 60 80 100 120 -60 -40 -20 0 20 40 60
(CNAP2GO + IBP)/2 [mmHg] delta-IBP-BP [mmHg]
Fig. 6 Results from clinical study. a Bland Altman plot for mean blood pressure. Same-color points stem from the same patient. The plot includes
indication of bias together with 95% limits of agreement which define the range in which 95% of all data points are expected to lie. Total number of data
points was n = 11,803. b Concordance plot of spontaneous changes in mBP found within 5 min by invasive blood pressure (IBP) and CNAP2GO (i.e., delta-
IBP-BP and delta-CNAP2GO-BP, respectively). Total number of changes assessed was n = 10,390.
NATURE COMMUNICATIONS | (2021)12:1387 | https://doi.org/10.1038/s41467-021-21271-8 | www.nature.com/naturecommunications 7ARTICLE NATURE COMMUNICATIONS | https://doi.org/10.1038/s41467-021-21271-8
Average Amplitude Spectra: IBP waveform - red, CNAP2GO actuator speed - blue
1.6
1.4
1.2
1
|Y(f)|
0.8
0.6
0.4
0.2
0
-2 -1 0 1 2 3
10 10 10 10 10 10
Frequency [Hz]
Fig. 7 The spectra of CNAP2GO’s contact pressure. The frequency content of the contact pressure pc(t) (blue line) is shown in comparison to the
frequency content of the whole pulsatile blood pressure signal (red line).
Fig. 8 CNAP2GO finger-ring. a Front view of the CNAP2GO finger-ring. The stator of the piezo motor is mounted on a printed circuit board (PCB). The
rotor drives a plunger that is screwed into a cylinder, which presses on the fluid inside the bladder. The photoplethysmographic (PPG) elements record the
light signal v(t). b 3D print of a possible market-ready CNAP2GO finger-ring.
detected a heartbeat (usually about 100 ms after the systolic peak). ● Very significant BP changes of 2 mmHg per beat and a heart
Then the VCT criteria are used to derive the resulting new pc(t). rate of 120 bpm
In the validation experiments, pc(t) was adjusted using the CNAP ● Measurement phase including 45 s initial phase followed by 2
pressure system and the finger cuff. In miniaturized CNAP2GO, min of VCT-phase
the fluid-filled actuator will be activated until the new pc(t) is ● 13 min of low power interpolation mode (explanation next
applied to the finger. Then the actuator will stop and keep pc(t) chapter)
constant, at best, without power until the next heartbeat is
The power needed to run the actuator will be 45.19 mW
detected.
according to our calculation. Together with the PPG system (5.64
An essential requirement for practical use and user acceptance
mW), a low-power bluetooth microcontroller (1.66 mW) and a
is at least a 24 h use without battery reloading. We have
motion sensor (6.21 mW), the power requirement of the
performed estimations on the power consumption of CNAP2GO,
CNAP2GO system is 58.7 mW or 1409 mWh during 24 h. For
with the following assumptions:
8 NATURE COMMUNICATIONS | (2021)12:1387 | https://doi.org/10.1038/s41467-021-21271-8 | www.nature.com/naturecommunicationsNATURE COMMUNICATIONS | https://doi.org/10.1038/s41467-021-21271-8 ARTICLE
a Max light amplitude (scaled)
25.0
b i j
Max light amplitude (scaled)
10% of max light signal 40.0 10% of max light signal 10% of max light signal 10% of max light signal
15.0
20.0 15.0
12.5 mBP = 147.8 mmHg
mBP = 115.0 mmHg 30.0 mBP = 115.8 mmHg mBP = 139.9 mmHg
width = 15.4 mmHg width = 17.8 mmHg width = 27.8 mmHg width = 39.1 mmHg
15.0 10.0
10.0
Subject 1 Subject 1 Subject 5 Subject 5
20.0 7.5
10.0 CNAP CNAP2GO CNAP CNAP2GO
5.0 5.0
5.0 10.0
2.5
c d k l
0.0 0.0 0.0 0.0
Max light amplitude (scaled)
Max light amplitude (scaled)
20.0 10% of max light signal 10% of max light signal 20.0 10% of max light signal 10% of max light signal
30.0
15.0
15.0 mBP = 118.3 mmHg mBP = 123.6 mmHg 15.0 mBP = 120.2 mmHg mBP = 132.2 mmHg
width = 23.1 mmHg width = 19.8 mmHg width = 14.4 mmHg width = 14.6 mmHg
10.0 20.0
10.0 Subject 2 Subject 2 10.0 Subject 6 Subject 6
CNAP CNAP2GO CNAP CNAP2GO
5.0 10.0
5.0 5.0
e
0.0
25.0
f
0.0
30.0 m 0.0
n 0.0
Max light amplitude (scaled)
Max light amplitude (scaled)
10% of max light signal 10% of max light signal 10% of max light signal 10% of max light signal
20.0 25.0 20.0 30.0
mBP = 117.5 mmHg mBP = 118.7 mmHg mBP = 123.4 mmHg mBP = 116.8 mmHg
width = 16.8 mmHg 20.0 width = 15.7 mmHg width = 26.2 mmHg width = 30.4 mmHg
15.0 15.0
20.0
Subject 3 15.0 Subject 3 Subject 7 Subject 7
10.0 CNAP CNAP2GO 10.0 CNAP CNAP2GO
10.0
10.0
5.0 5.0
5.0
g h
0.0 0.0 0.0 0.0
0 50 100 150 200 0 50 100 150 200
40.0 Finger blood pressure (mmHg) Finger blood pressure (mmHg)
Max light amplitude (scaled)
10% of max light signal 10% of max light signal
20.0 10% of m ax. light signal
30.0
mBP = 99.4 mmHg 30.0 mBP = 123.5 mmHg
Max light am plit ude (scaled)
25.0
15.0
width = 25.0 mmHg width = 14.3 mmHg
20.0
10.0 Subject 4 20.0 Subject 4
15.0
CNAP CNAP2GO
10.0
5.0 10.0
5.0
0.0 0.0
0.0
0 50 100 150 200 0 50 100 150 200
0 25 50 75 100 125 150 175 200
Finger blood pressure (mmHg) Finger
Fingerblood pressure
blood pressure [ m m Hg] (mmHg)
Fig. 9 Oscillometric curves from 7 subjects obtained from the CNAP2GO prototype. Compared are the results of the fluid-filled bladders in panels a, c, e,
g, i, k, and m to the results of the standard CNAP with pneumatic control in panels b, d, f, h, j, l, and n, respectively. Mean blood pressure (mBP) and width
of the Gaussian curves are denoted in each figure. The width is also demonstrated by black arrows. Measurement points (dots) are connected by
straight lines.
Pressure
a 200
(scaled) p [mmHg]
150
100
50
b OMW
oscillations
0.2
Light
0.0
-0.2
c Envelope of OMW (filtered)
Max light
amplitude
30
(scaled)
20
10
0
0 20 40 60 80 100 120 140
Time [s]
Fig. 10 Detailed example of the oscillometric wave. An example for an oscillometric wave (OMW) is shown from subject 1. a The pressure pc(t) is
increased approximately linearly. b OMW – in detail vPulse(t) – is recorded. c The resulting OMW envelope derived from the oscillations of vPulse(t).
comparison, a single AAA-battery has 1500 mWh; when using this sensor. Based on the present data set, all steps of
two batteries or a rechargeable accumulator with more than 2000 miniaturization and technological refinement can be assessed
mWh, a 24 h operation should be easily possible. As another and monitored in lab tests. Based on our tests, there is a well-
example, the CNAP module, which is the core measurement unit founded assumption that the final CNAP2GO wearable can be
without a user interface, has an average power consumption of located in a finger-ring as shown in Fig. 8b.
2.5 W with peaks up to 5 W. Second, for the wearable solution of CNAP2GO, the measured
mBP needs a correcting element for orthostatic pressure
whenever the finger level differs from the heart level. Heart level
Further development challenges. There are still some challenges correction can be achieved using low-power motion sensors.
regarding the implementation of this method in a wearable Using small XYZ-axis accelerometers and gyroscopes, the
solution. orientation of human body segments and movements can be
First, we did not perform our validation experiments using the reconstructed and thus vertical difference (dv) between the heart
final wearable hardware. Miniaturization will be a key task with and the finger can be measured41. As the density of blood is
NATURE COMMUNICATIONS | (2021)12:1387 | https://doi.org/10.1038/s41467-021-21271-8 | www.nature.com/naturecommunications 9ARTICLE NATURE COMMUNICATIONS | https://doi.org/10.1038/s41467-021-21271-8
10% of max light signal pulse @ 117 mmHg
35.0
30.0
Max light amplitude (scaled)
pulse @ 103 mmHg pulse @ 146 mmHg
25.0
20.0
15.0
10.0
5.0
0.0
0 25 50 75 100 125 150 175 200
Finger blood pressure [mmHg]
Fig. 11 Shapes of the pulses. The oscillometric wave envelope (red dots and lines) and typical fat, normal and spiky pulses (blue lines) from readings at
defined pressure values as denoted in the figure. Measurement points (dots) are connected by lines.
known, hydrostatic pressure can be calculated from dv and simply During the measurement phase of Fig. 12, the system will also
subtracted from pC(t). Although the measurement of dv during be able to analyze variables of the autonomic system, e.g.,
motion needs further research and validation, this form of heart baroreceptor reflex sensitivity and BP variability.
level correction is implementable as opposed to analog correc- In patients with anticipated acute hypertensive or hypotensive
tions for time-based wearable approaches, where the influence of episodes, two-finger rings may be used to avoid continuous
posture and arm movement on, e.g., pulse transition is evident external pressure on one finger. Two-finger rings may be used on
but solutions are unclear42. contralateral hands or a double finger sensor—as already available
Third, the described CNAP2GO method still needs a for the standard CNAP system—on the same hand.
continuous external pressure for correct measurements, but a
24 h continuous VCT measurement is clinically not necessary. Discussion
Thus for better patient compliance, CNAP2GO will switch We have introduced the CNAP2GO method based on the art of
between a measurement mode and an interpolation mode. The VCT which requires only slowly changing actuators and is robust
measurement mode starts with the initial phase followed by the against vasomotor changes. We discovered that the pulsatile
VCT-phase, where hemodynamic values are measured. These control in the standard VUT mainly avoids control system
values will be fed into a mathematical model, which can be resonances. For CNAP2GO, we achieved the prevention of
sufficiently trained after a short period of measurement resonances by adaptive antiresonance filters.
(approximately 2 min). Afterward the external pressure can be We were able to demonstrate validity of CNAP2GO. mBP
reduced to a minimum, just high enough to ensure good light differed by −1.0 ± 7.0 mmHg in comparison with the intra-
coupling. The trained mathematical model can then be used in arterial gold standard, which is well within the limits of 5±8
the interpolation mode to estimate hemodynamic values from mmHg demanded in the ISO 81060-2 standard for intermittent
v(t) or vPulse(t) during this low pressure and low power noninvasive sphygmomanometers43.
consumption mode. The system will restart “measurement Challenges of CNAP2GO are addressed in the article and
mode”, either periodically or triggered by physiological changes reveal where further development has to be done:
(e.g., if prominent changes are detected in the morphology of the
PPG signal, a restart of the “measurement mode” might be ● Hydrostatic correction between finger and heart level may be
required). Figure 12 shows a simple flow diagram of these achieved by using small XYZ-axis accelerometers and
operation modes. gyroscopes.
The purpose of the regularly occurring “measurement mode” ● The lab tests show that CNA2GO is already resistant to
phases is to record BP signals on the inflection point of the p-v motion artifacts. Artifacts may happen, but after stopping the
transfer function. In this unloading state, the p-v transfer function movement, the system finds back to its correct trace.
is most linear allowing for the highest signal quality needed to However, the system has not been tested during sport
derive advanced hemodynamic variables such as CO. This will activities and other heavy movements.
assure clinical accuracy of BP and CO for the entire ● Miniaturization of the hardware components can be realized
measurement. using PPG sensors with an LED and a photodiode. The
The mechanism shown in Fig. 12 requires a sophisticated contact pressure of the light elements to the skin is modifiable
approach to switch between operation modes: The duration of the by a slow and thus low-energy actuator using a fluid-filled
interpolation mode may be longer in stable hemodynamic phases bladder, all of which make wearable CNAP2GO sensors
(e.g., during sleep) and needs to be shorter in unstable situations, feasible.
where enhanced measurement accuracy as guaranteed by the ● A continuous external pressure has to be applied on the finger
measurement phase is needed. during VCT measurement. Figure 12 shows a mechanism
10 NATURE COMMUNICATIONS | (2021)12:1387 | https://doi.org/10.1038/s41467-021-21271-8 | www.nature.com/naturecommunicationsNATURE COMMUNICATIONS | https://doi.org/10.1038/s41467-021-21271-8 ARTICLE
•The CNAP2GO sensor can be slid on the finger
•pc(t) should be high enough to ensure good coupling of the PPG elements (between 10-40 mmHg)
•In this position, v(t) can be measured and used for heart rate monitoring
Start •The measurement can be started by a short press on a button, a detected fall or by the host device
•pc(t) is altered and v(t) as well as v Pulse(t) and its amplitude are determined
•vPulse(t) amplitudes are compared at different pc(t)-levels
•The pc(t)-level with the maximum vPulse(t) amplitude is determined as starting point mBP
Initial •From the oscillometric envelope, sBP and dBP can be determined for calibration
•Measures v(t) and its components for calculating VCT criteria
•If VCT indicates vasomotor changes and/or mBP changes, pc(t) is adapted accordingly
•Applies equation (1) to v(t), and combines it with the current p c(t)
Measure •The combined signal pC2G(t) corresponds to continuous BP, which is sent to the host device
•pc(t) is decreased to a low acceptable pressure, high enough to ensure good coupling of the PPG elements
•v(t) can still be used for hemodynamic interpolation using a trained model obtained in the measurement phase
•If wanted, CNAP2GO sensor can be removed from finger
Interpolation •A new measurement can be started automatically or due to a user interaction
Fig. 12 Software flow chart of the different CNAP2GO modes. After the start mode, the system switches dynamically between initial, measure, and
interpolation mode.
how the system may reduce the duration of pressure exposure Initialization: Open-loop phase. In the open-loop phase, a Gaussian-style oscil-
by using an interpolation mode. lometric envelope is calculated by using the amplitudes of vPulse(t) obtained at
different contact pressures pc(t). The initial setpoint P0 and its PPG counterpart v0
● CNAP2GO can be self-calibrated by an oscillometric are found according to the maximum amplitude rule. The filter variables of the
measurement at the beginning of the measurement phase. cascades vFilt[1, 2,.., N] are then set to v0.
Further validation work with the self-calibrated system needs
to be done to prove clinical accuracy. Digital signal filtering. After ambient light removal, v(t) has a sampling frequency
(fs) of 250 Hz. A recursive digital IIR-filter was designed to obtain vPulse(t),
In conclusion, we were able to demonstrate that the vRhythm(t), vdRhythm(t), and vVCT(t). In Fig. 13, frequency responses of the filters are
CNAP2GO method enables mBP to be measured with clinically shown, pseudocode of the filter cascade including coefficients are shown in Sup-
acceptable accuracy and precision, also during hypo- and plementary Method 1.
hypertensive phases, in patients having surgery and subjects Each single filter stage contains a first-order IIR low-pass filter (yi = (1 − UC)
*yi-1 + UC*xi). The recursive function provides down-sampling functionality to
performing physiological maneuvers with hemodynamic activa- enable reasonable filter parameters for low cut-off frequencies.
tion. According to our experiments, this technique seems to be After initialization in the open-loop phase, the filter adapts the relevant v-
very well suited for wearable sensors integrated in a finger-ring, as signals with every data point. Signals forget the initial setpoint v0 with an update
shown in Fig. 8. The resulting continuous BP signal allows for the coefficient UC [1, 2,…, N].
calculations of advanced hemodynamic variables such as CO,
systemic peripheral resistance, baroreceptor reflex sensitivity, and Reconstructing very slow changing BP changes. In very slowly changing fre-
quency components, blood volume and thus v(t) is not only influenced by BP but
many more. CNAP2GO potentially constitutes the breakthrough also by vasomotor activity. In the case of vasoconstriction, smooth vascular muscles
for wearable sensors for BP and blood flow monitoring in both close the arteries and arterioles, and finger blood volume decreases (i.e., v(t) goes
ambulatory and in-hospital clinical settings. up), although BP typically rises during vasoconstriction (i.e., v(t) should go down).
The opposite behavior occurs during vasodilation. This means that the information
from the PPG signal v(t) below 10−2 Hz is not reliable. Therefore, this frequency
Methods range is removed from all further calculations by filtering and using vVCT(t).
Hardware. To obtain a CNAP2GO prototype, we modified a standard CNAP Figure 13a and b show the frequency domain of the CNAP2GO control signals.
Monitor HD, especially its core unit (the CNAP module). The CNAP module is an Besides the high-pass filtered pulses vPulse(t), also the very-low-frequency
electronic system where almost all components are implemented as software on a components below 10−2 Hz of v(t) are removed from vVCT(t) and vRhythm(t) by the
32-bit digital signal processor (DSP; TMS320F2810, Texas Instruments, Dallas, digital filter design.
USA). Attached to the CNAP module is a double finger sensor system for alter- Within the VCT algorithm, pulses are inspected whether they have become
nating use on the index and middle finger. Each CNAP sensor contains a PPG spiky or fat within the previous beat by calculating the integral of vVCT(t) over the
system utilizing an LED (λ = 890 nm) as well as a light-to-frequency converter actual beat. If the area over the negative half-wave differs from that over the
(TSL245R, ams, Unterpremstätten, Austria) for light detection that produces a positive half-wave, the integral over the complete beat is different from zero
digital pulse-width modulation signal. This signal goes directly to a timer input of (Fig. 4b). Thus, the fat and spiky VCT control approach and its I summation
the DSP producing the digital PPG (i.e., the time series v(t))44. The output of the reconstructs BP information below 10−2 Hz46,47. This then triggers an adjustment
DSP controls two valves (separate inlet and outlet valves). Both valves are arranged of the setpoint Pn (Fig. 4c):
like transistors of a CMOS gate having one valve always closed. This allows for a
high-fidelity contact pressure of the PPG elements in the finger sensor45. X
n
Pn ¼ P0 cBBI Vn cBBP Vn ð2Þ
0
Algorithm overview. The original CNAP Monitor HD software in the module was
replaced by the CNAP2GO/VCT method described in this article. All supporting where cBBI and cBBP are constants for the beat-based integral (BBI) and beat-based
functions (such as basic operating system, ambient light removal, valve controlling proportional (BBP) control approach, respectively. The continuous summation
system, beat detector, data transmission, etc.) remained the same as in the original starting with the first beat allows for the reconstruction of the long-term BP
CNAP Monitor HD software V5.2.14. information that is filtered away from vVCT(t).
NATURE COMMUNICATIONS | (2021)12:1387 | https://doi.org/10.1038/s41467-021-21271-8 | www.nature.com/naturecommunications 11ARTICLE NATURE COMMUNICATIONS | https://doi.org/10.1038/s41467-021-21271-8
Amplitude response
a
5
Pulse Filter
VCT Filter vPulse(f)
0 vVCT(f)
v [dB]
-5
dRhythm Filter
-10 Rhythm Filter
vdRhythm(f)
vRhythm(f)
-15
-20
DC-components Rhythms Pulses
b Frequency response
90°
45°
φ [°]
0°
-45°
-90°
-3 -2 -1 0
10 10 10 10
Fig. 13 Control signals in the frequency domain – Bode diagram. a The amplitude response of the volume control technique (VCT) control signals vVCT,
vpulse, vRhythm, and vdRhythm. Those are light signals filtered by the VCT, pulse, rhythm, and dRhythm filters, respectively. In particular, DC components,
rhythms and pulses are discriminated. The dots and vertical lines represent the frequency cutoffs of each signal component. b Frequency response ϕ of the
control signals. f: frequency.
The integral function for the beat is: Antiresonance. The complex control system outlined above follows the inflection
point and thus mBP is tracked by pC(t). As a result, the speed of tracking is limited
Ztb to the cut-off frequency of vRhythm(f) and vdRhythm(f). This produces the control
1
Vn ¼ vVCT ðt Þdt ð3Þ engineering problem that the stability of the system is reduced if the actuator is
PI
tb1 slow. Slow-reacting pC(t) creates a so-called pole in the z-plane indicating a ten-
dency to oscillate. These oscillations especially occur when the patient calms down,
where tb is the time t at which beat b is detected and PI the pulse interval from tb1
parasympathetic tone increases, and the breathing frequency (about 0.2 Hz to 0.3
to tb.
Hz) appears in the BP signal. A digital antiresonance system was developed that
makes this pole ineffective. The basic considerations of this system were inspired by
Tracking physiological rhythms. VCT ensures a stable long-term tracking of a method for suppressing mechanical resonance in high track density hard disk
mBP, corrects for vasomotor activity, and reconstructs slow-changing BP infor- drives50.
mation. Theoretically, this mechanism should be a sufficient control signal, but it From CNAP2GO’s need for antiresonance we see that a benefit of pulsatile
turned out that CNAP2GO did not follow physiological BP changes correctly. The VUT control systems is to inhibit this kind of resonance: Even in very fast pressure
control deviation of the system was too high and thus an additional mechanism for generators, pressure in the finger cuff will always lag behind true pulsatile BP.
tracking fast mBP changes and physiologic BP rhythms was needed. Figure 13 However, the resulting pole in a VUT control system is ineffective as long as the
shows vRhythm(f), which covers physiological rhythms in BP that are related to system can be faster than the BP signal.
breathing as well as to Traube–Hering–Mayer waves48,49. The signal vRhythm(t) is Our antiresonance system inhibiting the resonances also for nonpulsatile
led into a kind of a proportional-integral-differential (PID) control mechanism in control is thus a leap forward in the development of miniaturized BP measurement
order to keep vRhythm(t) as small as possible by altering pc(t). Note that a rise in BP devices with acceptable clinical accuracy. It works as follows: The resonance
increases blood volume in the finger and thus decreases v(t), whereas a fall in BP detector indicates frequency and amplitude of a resonance oscillation in pc(t),
increases v(t). The PID-control coefficients provoke negative feedback: if BP rises, which typically occurs between 0.1 Hz to 1 Hz. This information tunes a high-
pc(t) rises too while blood volume in the finger (indicated by vRhythm(t)) is kept sensitive IIR notch filter which eliminates resonance phenomena. Pseudocode of
constant. the antiresonance system is shown in Supplementary Method 2.
The differential part of the controller, vdRhythm(f), takes care of pronounced BP
changes (e.g., Valsalva maneuver, hyperventilation, blood loss, etc.). In order to
follow the overall CNAP2GO principle, where actuator changes shall be slow, Lab tests versus CNAP Monitor HD. Written informed consent was obtained
pulsatile blood volume is not clamped. Rather, the pulsatile frequencies are cut off, from all participants. We performed measurements with the participants lying in
and the differential controller part acts as a second band-pass filter producing the supine position. The finger sensor of the CNAP2GO system was attached to the
nonpulsatile vdRhythm(f). same hand as the CNAP Monitor HD sensor. As usual for CNAP, both sensors
Note: v(f) indicates the frequency domain of the signal v(t), as shown in Fig. 13. were placed on the proximal phalanx. Both devices were initially calibrated to the
The CNAP2GO control system continuously keeps track of the required contact same sBP/dBP values using the sphygmomanometer of the CNAP Monitor HD.
pressure with the following control structure: Study measurements were performed over 30 min and included 6 physiological
maneuvers.
yPD ¼ cP vRhythm þ cD vdRhythm ð4Þ For statistical analysis, simultaneously obtained mBP values measured with the
CNAP2GO and with the CNAP Monitor HD were averaged over 10 s to reduce the
X
n number of comparisons and decorrelate consecutive data. We performed
yI ¼ cI yPD ð5Þ Bland Altman analysis accounting for multiple measurements per subject51 and
0 calculated the bias (mean of the differences between CNAP2GO mBP values minus
The final CNAP2GO contact pressure is: CNAP Monitor HD mBP values), the standard deviation of the differences, and the
95% limits of agreement (Table 1).
pC ðt Þ ¼ Pn yI yPD ð6Þ
where cP, cD, and cI are constants for the proportional, differential, and integral Clinical study versus invasive reference. The clinical prospective method
approach of the continuous control system, respectively, that keeps pc(t) at the comparison study comparing mBP measured using CNAP2GO and mBP measured
inflection point of the S-curve and thus makes it equal to mBP. using a radial arterial catheter (invasive reference method, clinical gold standard)
12 NATURE COMMUNICATIONS | (2021)12:1387 | https://doi.org/10.1038/s41467-021-21271-8 | www.nature.com/naturecommunicationsNATURE COMMUNICATIONS | https://doi.org/10.1038/s41467-021-21271-8 ARTICLE
was performed in the Department of Anesthesiology, Center of Anesthesiology and 2. De Backer, D. et al. Alternatives to the Swan–Ganz catheter. Intensive Care
Intensive Care Medicine, University Medical Center Hamburg-Eppendorf (Ham- Med. 44, 730–741 (2018).
burg, Germany) after approval by the ethics committee (Ethikkomission der 3. Teboul, J.-L. et al. Less invasive hemodynamic monitoring in critically ill
Ärztekammer Hamburg, Hamburg, Germany). We obtained written informed patients. Intensive Care Med. 42, 1350–1359 (2016).
consent from all patients. Adult patients scheduled for neurosurgical procedures in 4. Sessler, D. I. & Saugel, B. Beyond ‘failure to rescue’: the time has come for
whom continuous BP monitoring with an invasive arterial catheter was planned, continuous ward monitoring. Br. J. Anaesth. 122, 304–306 (2019).
independently of the study, were eligible for study inclusion. Exclusion criteria 5. McGillion, M. H. et al. Postoperative Remote Automated Monitoring: Need
were the presence of vascular abnormalities or anatomical deformities of the upper for and State of the Science. Can. J. Cardiol. 34, 850–862 (2018).
extremities or peripheral edema. 6. Michard, F., Saugel, B. & Vallet, B. Rethinking the post-COVID-19 pandemic
The finger sensor of the CNAP2GO system was attached to the hand opposite hospital: more ICU beds or smart monitoring on the wards? Intensive Care
to the arterial catheter. CNAP2GO continuous noninvasive BP measurements and Med 46, 1792–1793 (2020).
invasive reference measurements using a radial arterial catheter were recorded 7. Urrea, B. et al. Validation of the Instant Blood Pressure Smartphone App.
simultaneously over a period of 45 min. According to clinical standards, general JAMA Intern. Med. 176, 700–702 (2016).
anesthesia was maintained with remifentanil and propofol. Norepinephrine was 8. Mukkamala, R. et al. Towards Ubiquitous Blood Pressure Monitoring via
given whenever clinically indicated. Pulse Transit Time: Theory and Practice. IEEE Trans. Biomed. Eng. 62, 1879–
Initial invasively measured BP values were used as post-hoc calibration values
1901 (2015).
for CNAP2GO. For statistical analysis, mBP measured with CNAP2GO and mBP
9. Baruch, M. C. et al. Pulse Decomposition Analysis of the digital arterial pulse
obtained using a radial arterial catheter were synchronized in time before being
during hemorrhage simulation. Nonlinear Biomed. Phys. 5, 1–15 (2011).
averaged over 10 s to reduce the number of comparisons and decorrelate
10. Addison, P. S. Slope Transit Time (STT): A Pulse Transit Time Proxy
consecutive data. We plotted mBP measured with the CNAP2GO system against
invasively measured mBP values in scatter plots for visual assessment of the requiring only a Single Signal Fiducial Point. IEEE Trans. Biomed. Eng. 63,
distribution and relationship of the BP data. In order to evaluate the agreement 2441–2444 (2016).
between mBP measured with CNAP2GO and mBP obtained using a radial arterial 11. Khalid, S. G., Zhang, J., Chen, F. & Zheng, D. Blood Pressure Estimation
catheter we used Bland Altman analysis accounting for multiple measurements per Using Photoplethysmography Only: Comparison between Different Machine
patient51 and calculated the bias (mean of the differences between CNAP2GO mBP Learning Approaches. J. Healthc. Eng. 2018, 1548647 (2018).
values minus invasively assessed mBP values), the standard deviation of the 12. Dagdeviren, C. et al. Conformable amplified lead zirconate titanate sensors
differences, and the 95% limits of agreement (see Table 2 and Fig. 6a). with enhanced piezoelectric response for cutaneous pressure monitoring. Nat.
Furthermore, we calculated the changes in BP (delta-BP) spontaneously occurring Commun. 5, 4496 (2014).
over a period of 5 min and investigated the concordance between changes in 13. Xing, X. & Sun, M. Optical blood pressure estimation with
CNAP2GO mBP and changes in invasively measured reference mBP (see Fig. 6b). photoplethysmography and FFT-based neural networks. Biomed. Opt. Express
7, 3007–3020 (2016).
14. Sola, J., Bertschi, M. & Krauss, J. Measuring Pressure: Introducing oBPM, the
Lab tests with the fluid-filled bladder prototype. Written informed consent was
Optical Revolution for Blood Pressure Monitoring. IEEE Pulse 9, 31–33
obtained from all participants. Measurements were performed with the subjects in
(2018).
a relaxed sitting position with the arms lightly resting on a table. The sensors of the
15. Gao, M., Olivier, N. B. & Mukkamala, R. Comparison of noninvasive pulse
prototype CNAP2GO and of the CNAP Monitor HD (used as reference) were
transit time estimates as markers of blood pressure using invasive pulse transit
placed on opposite hands. Measurements were performed simultaneously on index
fingers, then simultaneously on middle fingers before switching the sensors time measurements as a reference. Physiol. Rep. 4, e12768 (2016).
between hands and repeating the procedure again on index and on middle fingers. 16. Proenca, J., Muehlsteff, J., Aubert, X. & Carvalho, P. Is pulse transit time a
In order to obtain a finger oscillometric curve, finger cuff pressure was stepwise good indicator of blood pressure changes during short physical exercise in a
increased from 0 to 200 mmHg with approx. 2 mmHg/s. Cuff pressure was then young population? in 32nd Annual International Conference of the IEEE
plotted versus maximum light amplitude to visually compare the results obtained EMBS 2010, 598–601 (2010).
with the fluid-filled bladder prototype with the standard CNAP Monitor HD. 17. Ding, X., Zhang, Y. & Tsang, H. K. Impact of heart disease and calibration
While it was not expected that the prototype CNAP2GO would result in identical interval on accuracy of pulse transit time-based blood pressure estimation.
curves as the reference CNAP Monitor HD, the quality of the relationship between Physiol. Meas. 37, 227–237 (2016).
cuff pressure and maximum light amplitude was investigated: visual assessment 18. Pandit, J. A., Lores, E. & Batlle, D. Cuffless Blood Pressure Monitoring
found that the fluid-filled bladder driven by the slow actuator (infusion pump) Promises and Challenges. Clin. J. Am. Soc. Nephrol. 15, 1–8 (2020).
provided oscillometric envelopes with a quality comparable to those provided by 19. Kario, K. et al. The first study comparing a wearable watch-type blood
the CNAP Monitor HD (see Figs. 9, 10 and 11). pressure monitor with a conventional ambulatory blood pressure monitor on
in-office and out-of-office settings. J. Clin. Hypertens. 22, 135–141 (2020).
20. Chandrasekhar, A., Natarajan, K., Yavarimanesh, M. & Mukkamala, R. An
Data availability iPhone Application for Blood Pressure Monitoring via the Oscillometric
Data that support hypotheses, plots, and other findings of this study are available from Finger Pressing Method. Sci. Rep. 8, 13136 (2018).
the corresponding author upon reasonable request. The limited data insight has the 21. Chandrasekhar, A. et al. Smartphone-based blood pressure monitoring via the
background that contained data are sensitive personal data that were partially collected in oscillometric finger-pressing method. Sci. Transl. Med. 10, eaap8674 (2018).
a clinical study in patients. The data will only be passed on reasonable request and, 22. Thiele, R. Cardiac Bulldozers, Backhoes, and Blood Pressure. Anesth. Analg.
according to the present study contract, if the recipient of the data agrees to comply with 121, 1417–1419 (2015).
the European General Data Protection Regulation and not to attempt to trace the origin 23. Peňáz, J. Photoelectric measurement of blood pressure, volume and flow in the
of the data. finger’In:Digest of the 10th International Conference on Medical and
Biological Engineering. Dresden 104, (1973).
Code availability 24. Imholz, B. P., Wieling, W., van Montfrans, G. A. & Wesseling, K. H. Fifteen
Mathematical formulation of the detailed VCT is shown in the Methods. Pseudocode of years experience with finger arterial pressure monitoring: assessment of the
VCT-related control algorithms like digital filters and the antiresonance system including technology. Cardiovasc. Res. 38, 605–616 (1998).
coefficients are provided in Supplementary Methods 1-5. Code in Octave is available 25. Fortin, J. et al. Continuous non-invasive blood pressure monitoring using
upon reasonable request. C++ code of the CNAP Monitor HD software V5.2.14 concentrically interlocking control loops. Comput. Biol. Med. 36, 941–957 (2006).
containing further supporting functions (such as basic operating system, ambient light 26. Wesseling, K. H., de Wit, B., van der Hoeven, M. A., van Goudoever, J. &
removal, valve controlling system, beat detector, data transmission, etc.) is part of Settels, J. J. Physiocal, calibrating finger vascular physiology for Finapres.
CNSystems’ proprietary intellectual property and is not available for public use. Some of Homeostasis 36, 67–82 (1995).
the methods are subject to different patents and patent applications. 27. Fortin, J., Wellisch, A. & Maier, K. CNAP – Evolution of Continuous Non-
invasive Arterial Blood Pressure Monitoring. Biomed Tech 58, https://doi.org/
10.1515/bmt-2013-4179 (2013).
Received: 19 November 2019; Accepted: 17 December 2020; 28. Fortin, J. et al. The importance of VERIFI (‘Vasomotoric Elimination and
Reconstructed Identification of the Initial set-point’) for the performance of
the CNAP technology. in. IFMBE Proceedings 65, 663–666 (2017).
29. Gizdulich, P., Imholz, B. P. M., van den Meirackert, A. H., Paratit, G. &
Wesseling, K. H. Finapres tracking of systolic pressure and baroreflex
sensitivity improved by waveform filtering. J Hypertens 14, 243–250 (1996).
References 30. Gizdulich, P., Prentza, A. & Wesseling, K. H. Models of brachial to finger
1. Michard, F. Innovations in Monitoring. ICU Manag. Pract. 17, 148–150 pulse wave distortion and pressure decrement. Cardiovasc. Res. 33, 698–705
(2017). (1997).
NATURE COMMUNICATIONS | (2021)12:1387 | https://doi.org/10.1038/s41467-021-21271-8 | www.nature.com/naturecommunications 13You can also read