Caraoke: An E-Toll Transponder Network for Smart Cities - acm sigcomm
←
→
Page content transcription
If your browser does not render page correctly, please read the page content below
Caraoke: An E-Toll Transponder Network for Smart Cities

                       Omid Abari, Deepak Vasisht, Dina Katabi and Anantha Chandrakasan
                                                       Massachusetts Institute of Technology
                                                             Cambridge, MA, USA
                                                    {abari, deepakv, dk, anantha}@mit.edu

ABSTRACT
   Electronic toll collection transponders, e.g., E-ZPass, are
a widely-used wireless technology. About 70% to 89% of
the cars in US have these devices, and some states plan to
make them mandatory. As wireless devices however, they
lack a basic function: a MAC protocol that prevents colli-                                           (a) Bottom view       (b) Top view (solar panel)
sions. Hence, today, they can be queried only with direc-                                    Figure 1—Caraoke reader. The board is 3 × 4in, and oper-
tional antennas in isolated spots. However, if one could in-                                 ates by harvesting solar power.
teract with e-toll transponders anywhere in the city despite
collisions, it would enable many smart applications. For ex-
ample, the city can query the transponders to estimate the ve-                               1.   I NTRODUCTION
hicle flow at every intersection. It can also localize the cars
using their wireless signals, and detect those that run a red-                                  Electronic toll collection transponders are simple devices
light. The same infrastructure can also deliver smart street-                                consisting of a battery-powered RFID. They are perhaps
parking, where a user parks anywhere on the street, the city                                 among the most-widely used wireless communication tech-
localizes his car, and automatically charges his account.                                    nologies. In the US, depending on the state, 70% to 89%
   This paper presents Caraoke, a networked system for de-                                   of the cars have such transponders [56, 2, 46, 9]. Further,
livering smart services using e-toll transponders. Our design                                the numbers are growing rapidly. The state of Pennsylva-
operates with existing unmodified transponders, allowing                                     nia has announced that E-ZPass will be mandatory on all
for applications that communicate with, localize, and count                                  highways in 2018. The state of California already requires
transponders, despite wireless collisions. To do so, Caraoke                                 drivers to have the transponder mounted on the windshield
exploits the structure of the transponders’ signal and its prop-                             per state law in order to drive in the Express-Lanes [55, 9].
erties in the frequency domain. We built Caraoke reader into                                 Other states are following suit motivated by Congress’s de-
a small PCB that harvests solar energy and can be easily de-                                 cision to have a national electronic toll-collection system by
ployed on street lamps. We also evaluated Caraoke on four                                    2016 [4, 9]. Because of this wide-deployment and antici-
streets on our campus and demonstrated its capabilities.                                     pated growth, multiple businesses are looking into leverag-
                                                                                             ing e-toll transponders to deliver new services. For example,
                                                                                             e-toll transponders are currently used to pay for food at some
CCS C ONCEPTS                                                                                drive-through restaurants [28], and to automate payment at
   •Networks → Network protocol design;                                                      parking garages [5].
                                                                                                More generally, there is a big opportunity for using e-toll
                                                                                             transponders to enable smart cities. For example, the city
K EYWORDS
                                                                                             could deploy readers on traffic lights to query the transpon-
  Wireless, Smart City, RF Localization, Active RFID,                                        ders and track the number of cars at every intersection. It can
Electronic Toll Collection (ETC)                                                             then use the information to adapt the timing of traffic lights
Permission to make digital or hard copies of all or part of this work for personal           to minimize the average wait time for the green light. It can
or classroom use is granted without fee provided that copies are not made or                 also leverage RF-based localization to localize cars using
distributed for profit or commercial advantage and that copies bear this notice              their transponders’ signals, detect cars that run a red-light,
and the full citation on the first page. Copyrights for components of this work
owned by others than the author(s) must be honored. Abstracting with credit is               and automatically charge their accounts for a ticket. Readers
permitted. To copy otherwise, or republish, to post on servers or to redistribute to         deployed on street-lamps can detect speeding on every street
lists, requires prior specific permission and/or a fee. Request permissions from             in the city and ticket the offending car, without the need for
permissions@acm.org.
                                                                                             car-mounted radars and hidden police officers. The same in-
SIGCOMM ’15, August 17 - 21, 2015, London, United Kingdom
c 2015 Copyright held by the owner/author(s). Publication rights licensed to
                                                                                             frastructure can deliver smart street-parking systems, where
ACM. ISBN 978-1-4503-3542-3/15/08. . . $15.00                                                a user parks anywhere on the street, the city localizes his car,
DOI: http://dx.doi.org/10.1145/2785956.2787504                                               and automatically charges his account.

                                                                                       297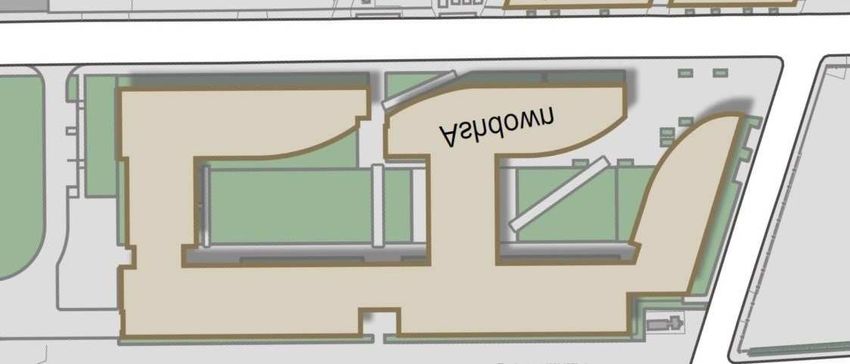
Unfortunately, today there is a major challenge that ham-               To demonstrate the practicality of Caraoke, we built
pers the use of e-toll transponders in smart city services, like         Caraoke reader into a custom designed printed circuit board
the ones described above. Specifically, e-toll transponders              (PCB). Our prototype, shown in Fig. 1, is both small and
are designed under the assumption that only one transponder              low-cost, making it amenable to large-scale deployment.3
transmits at any point in time, and hence have no MAC pro-               Further it is designed as a plug and play device; It connects
tocol to prevent collisions.1 Collection systems use restricted          to the Internet via an LTE modem and harvests its energy
deployments and highly directional antennas to ensure that               from solar power, making it easy to deploy on street-lamps.
only one car responds to the reader’s query. Without this                   We have evaluated Caraoke on four campus streets. We
physical isolation, all transponders in range would transmit             ran multiple experiments with cars that have standard E-
simultaneously, creating collisions. One could think of re-              ZPass transponders. Our results show the following:
placing the current transponders with new transponders that
support a MAC protocol. Replacing the large infrastructure               • Caraoke can count transponders accurately despite colli-
of deployed transponders however would take a long time                    sions. The average error in the Caraoke estimator is 2%,
and incur a major cost.2 In contrast, developing for current               and the 90th percentile is less than 5%, which is signif-
transponders allows the cities to obtain immediate benefits                icantly more accurate than existing camera-based traffic
even with a small installation on some of the busier streets               tracking systems [43, 54].
and intersections. Yet to do that, the system has to deliver its         • Caraoke can accurately localize cars into parking spots.
smart services in the presence of wireless collisions.                     Its average location accuracy is 4 degrees. This accuracy
    This paper presents Caraoke, a networked system for de-                is sufficient for detecting occupied/available parking spots
livering smart services using existing e-toll transponders.                between two street lamps.
Caraoke also presents a new reader design that can count,                • Across experiments where we varied the car speed from
localize, and estimate the speed of the cars on the road using             10 mile/hour to 40 mile/hour, Caraoke has detected the
collision signals from their e-toll transponders. The key fea-             speed to within 8% (i.e., 1 to 3 mile/hour). The same ac-
ture that enables Caraoke to work in the presence of collision             curacy was observed in a second set of experiments con-
is its ability to exploit the carrier frequency offset (CFO) of            ducted in an empty lot with a car speed of 50 mile/hour.4
the transponders. Specifically, since e-toll transponders are            • Caraoke successfully decodes transponder ids in the pres-
active RFIDs, each device has an independent oscillator, and               ence of collisions, but the time required to decode in-
hence it experiences a carrier frequency offset (CFO). Tra-                creases with the number of colliding transponders. In par-
ditional wireless systems view the CFO as a harmful phe-                   ticular, decoding the ids of a pair of colliding transponders
nomenon that the receiver has to compensate for in order                   takes 4.2 ms, whereas decoding five colliding ids takes
to correctly decode. In contrast, we show that we can lever-               16.2 ms.
age the CFO of the transponders to zoom in on individual                 • Measurements of the Caraoke reader show that it con-
transponders in the presence of collisions.                                sumes only 9mW in average (excluding modem), which
    In particular, we consider the collision in the frequency              is 56× lower than what it can harvest from its solar panel.
domain as opposed to the time domain, and show that each
collision exhibits spikes that correspond to the CFOs of the             2.   R ELATED W ORK
colliding transponders. Further, e-toll transponders have par-
ticularly large CFOs that span 1.2MHz [36], creating a sig-              (a) Communication and Localization: Caraoke builds on
nificant separation between the spikes. Thus, we can estimate            a rich literature on RFIDs. Past research however has typi-
the number of transponders by counting these spikes.                     cally focused on EPC RFIDs, like those used in access con-
    We also show that we can use the differences in CFO to               trol and inventory tracking [22, 30]. Such RFIDs do sup-
measure the wireless channels to the individual transpon-                port a MAC protocol and hence can communicate without
ders, and hence apply RF-based localization to track cars                major collisions. In contrast, e-toll transponders use a dif-
and measure their speeds. Caraoke can also decode the IDs                ferent protocol that has no MAC support. We note however
of the colliding transponders, say to charge a car for park-             that past works [58, 34] proposed methods to decode concur-
ing or speeding. To do this, Caraoke leverages the channels              rent transmissions from backscatter sensors in time domain.
and CFO measurements to combine multiple collisions in a                 However, such designs are inapplicable to our scenario be-
manner that the signals from the target transponder add up               cause they require hardware modification of the RFIDs and
coherently, whereas the signals of other colliding transpon-             do not work with existing e-toll transponders.
ders combine incoherently. This allows Caraoke to boost the                 Our work is also related to past work on RFID localiza-
SNR of the target transponder above the others, and enable               tion and RF-based positioning [60, 29, 59, 63, 26]. While we
it to decode the ID of the target transponder.                           build on the general area of AoA localization, our approach
1                                                                        3
  This is unlike traditional RFIDs used in access control or               The board is about the size of a credit card and cost less
retail, which have a MAC protocol.                                       than $40 which can be dramatically reduced with mass pro-
2                                                                        duction.
  There were more than 26 million transponders deployed
                                                                         4
just by E-ZPass as of 2013 [1]. In addition, there are a large             Almost all states in the US have residential speed limits be-
number of additional transponders deployed by other agen-                low 35 mile/hour, and the maximum residential speed limit
cies such as FasTrak, etc.                                               in any state is 45 mile/hour [8].

                                                                   298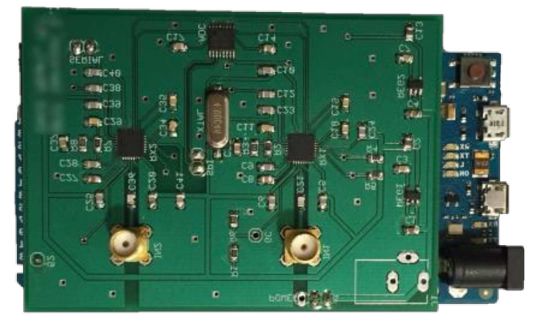
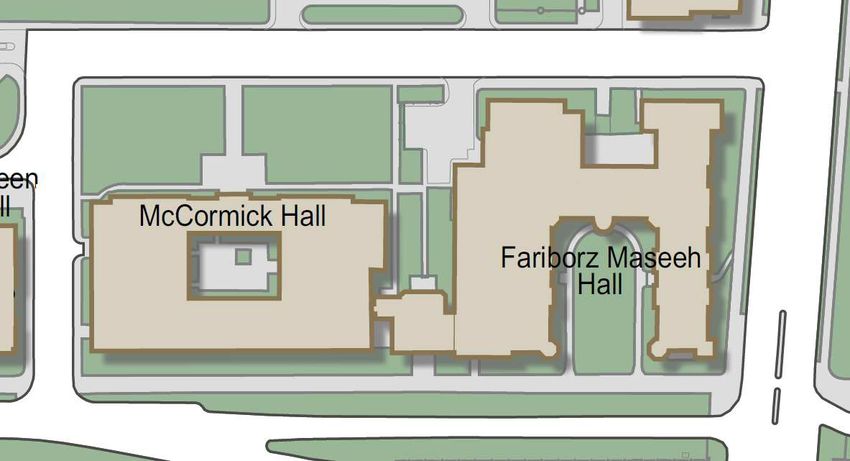
differs in that it exploits CFO differences to localize the de-                Query
vices using colliding signals, without even decoding.                                                      Transponder Response
   There are also commercial RFID readers which are solar
powered [7]. However, unlike Caraoke, these readers can not                                                          256 bits
localize, count and identify RFIDs in the presence of wire-
less collisions.                                                               20          100                       512
   Finally, a vast majority of past research on issues related                                   (a) Transponder Timing
to CFO focuses on how to eliminate or estimate the CFO and                       47 bits
compensate for it [12, 49, 48, 52]. The closest to our work
                                                                              Factory Fixed      Agancy Fixed       Programmable   CRC
is [18], which advocates using the CFO of a device as an id
for security purposes. None of this work however deals with
collisions or the use of CFO for localization or decoding.                                               256 bits
                                                                                              (b) Transponder Response
(b) Smart Cities: Our work is motivated by the growing in-
terest in smart cities, where urban services are automated                Figure 2—Transponder Transmission. The reader trans-
                                                                          mits a query signal which is a simple sine-wave at carrier
to improve efficiency, and reduce waste and pollution [42,                frequency. The transponder responds by transmitting a 256-
35, 25]. Past work in this area focuses on transportation re-             bit data using OOK Manchester modulation.
search [61], software applications [20], and social and eco-
nomic issues [14]. In contrast, we focus on wireless network-             an inquiry transmitted by the reader. The reader is typically
ing issues such as communication, localization, and counting              placed in the tollbooth whereas the transponder is attached
in the presence of wireless collisions.                                   to the car’s windshield. Both transponder and reader work at
   There are also a few businesses that market solutions for              915MHz. The query signal is simply a sinewave transmitted
one of Caraoke’s applications. In particular, some apps allow             at the carrier frequency (i.e. 915MHz) for a short period of
a user to pay for parking using her phone [19]. Those apps                time. The transponder responds with its id, which identifies
however do not address the cost and overhead incurred by                  the driver’s account. Fig. 2(a) illustrates the timing of the
the city in checking for parking violations and issuing tick-             query signal and the transponder’s response to it.
ets. Further, they do not automatically detect the occupancy                 A few points are worth noting:
of parking spots. Alternative solutions like Streetline install
a sensor in the asphalt pavement of every parking spot [51].              • In contrast to traditional RFIDs (e.g., those used in re-
They need to drill the street in every spot incurring a sig-                tail or access control),5 the active RFIDs used in e-
nificant cost and causing traffic disturbances. There are also              toll transponders lack a medium access protocol (MAC).
traffic cameras installed in some cities for counting the cars              Thus, once a transponder detects the reader’s signal, it
at the corresponding traffic light and providing traffic statis-            immediately transmits its response. Hence, if multiple
tics [38]. These systems are highly sensitive to occlusions, il-            transponders are in the reader’s range, they all respond
lumination, shadowing, and wind [43]. Finally, traffic radars               leading to a collision. Toll systems avoid the need for a
are typically used to measure car speeds. These devices how-                MAC by using highly directional antennas, and the fact
ever cannot tell which speed is associated with which car. A                that cars are separated by a minimum distance.
police officer has to be around to identify the speeding car              • E-toll transponders also have a relatively large CFO. Their
based on the orientation of the device [24]. In contrast to all             carrier frequencies vary between 914.3MHz and 915.5
of the above, Caraoke is a single system that can support all               MHz, and hence their CFO can be as high as 1.2MHz [36].
of these applications, and address many of the drawbacks of               • The simplicity of the transponders results in a cheap and
existing solutions.                                                         low power device. A transponder can work for 10 years
                                                                            before it runs out of battery, and it operates whether the
(c) VANET: There is a large literature on vehicle networks,
                                                                            car is on or off.
or VANET. Research in that area addresses the impact of
                                                                          • Finally, for the purpose of this paper, it is important to
mobility on ad hoc networks [40]. It focuses on routing [39],
                                                                            understand the properties of the transponder signal. The
quality of service [62], and reliability [64]. It runs on typical
                                                                            transponder transmits its data using on-off keying (OOK)
communication devices that support a MAC protocol, e.g.,
                                                                            modulation. OOK is a simple modulation, where the radio
WiFi and WiMAX [21, 44].Our work differs from this past
                                                                            transmits a “1 bit” by transmitting the carrier frequency,
work in objectives and techniques. Specifically, our goal is
                                                                            and transmits a “0 bit” by staying silent. This means that
to enable smart cities to leverage the widely-deployed e-toll
                                                                            the transponder’s signal corresponds to the presence and
transponders to deliver new services such as smart-parking
                                                                            absence of the carrier sinewave. Thus, the transmitted sig-
and real-time traffic monitoring. Our solutions target a differ-
                                                                            nal can be written as:
ent communication technology, namely e-toll transponders.
Such transponders lack a MAC protocol, necessitating new                                           x(t) = s(t) · ej2π·fc ·t ,            (1)
designs that differ from those used in VANET.
                                                                            where s(t) is a binary square-wave baseband signal tog-
                                                                            gling between 0 and 1, and fc is the carrier frequency. The
3.     BACKGROUND                                                         5
                                                                            Most research targets Electronic Product Code (EPC)
     An e-toll transponder is an active RFID, which responds to           RFIDs, which have an Aloha-style MAC protocol [23].

                                                                    299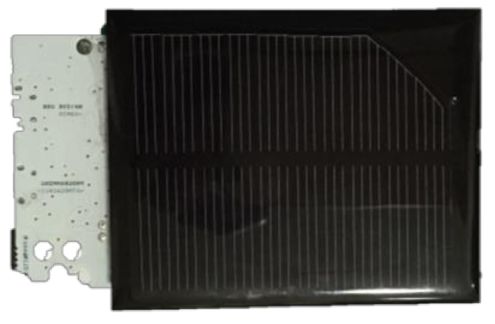
This paper is focused on the design and implementation of
                                                                             the Caraoke and a small-scale evaluation of the deployment
                                                                             of multiple Caraoke readers on a campus street. Before delv-
                                                                             ing into the details of our design, we note the following two
                                                                             points regarding scope:
                                                                             • Our objective is to automate smart services, eliminating
                                                                               the personnel cost, and improving the overall accuracy in
                                                                               comparison to the status quo. Note that the current alter-
Figure 3—Illustration of Caraoke The Caraoke reader is                         natives suffer from significant errors. For example, about
mounted on a street-lamp. It queries nearby transponders and                   10% to 30% of the speeding tickets based on traffic radars
uses their signals to localize them and estimate their speeds.                 are estimated to be incorrect [6]. The errors are mostly
                                                                               due to the fact that radars cannot associate a speed with
     received wireless signal can be written as:                               a particular car. This task is left to the police officer and
                        y(t) = h · s(t) · ej2π·fc ·t ,           (2)           hence is prone to human mistakes [6]. Similarly, errors in
                                                                               estimating the number of cars using traffic cameras vary
     where h is the complex channel coefficient. The receiver                  between a few percent to 26%, depending on illumina-
     down-converts the signal to baseband by multiplying it                    tion, wind, occlusions, etc. [43]. Furthermore, the camera
     with its own carrier frequency. The received baseband sig-                lenses have to be manually cleaned every 6 weeks to 6
     nal r(t) then becomes:                                                    months [16].
                                                                             • For a city to use Caraoke to deliver the above services,
                r(t)    =    h · s(t) · ej2π·∆f ·t               (3)           it needs to connect the system with its own transporta-
                        =    h · (0.5 + s′ (t)) · ej2π·∆f ·t ,   (4)           tion and traffic databases. For example, in order to de-
                                                                               tect a car that runs a red light, the city needs to combine
     where ∆f is the carrier frequency offset between the trans-               the output of Caraoke with the timing of the red-light at
     mitter and and the receiver, and s′ (t) is the same square-               the corresponding intersection. The process for combining
     wave as s(t) except that it toggles between -0.5 and 0.5                  Caraoke’s output with the city’s transportation and traffic
     and has zero mean. The frequency representation of the                    databases is beyond the scope of this paper.
     received signal r(t) can be written as:
                                                                             5.   C OUNTING D ESPITE C OLLISIONS
                        h
              R(f ) =     · δ(f − ∆f ) + h · S′ (f − ∆f )        (5)            Estimating the number of vehicles at major intersections is
                        2
                                                                             critical for traffic management and city planning. In this sec-
     where S′ (f ) is the frequency representation of s′ (t) and             tion, we describe how a Caraoke reader counts the transpon-
     δ(f ) is the unit impulse function. As it can be seen from              ders in its radio range. Specifically, when a Caraoke reader
     the equation, this signal has a peak at the carrier frequency           transmits a query message, transponders in its radio range
     offset, ∆f . Further, since s′ (t) has a zero mean, S′ (0) =            respond simultaneously with their information. We would
     0.6 Thus, the complex value of the peak represents the                  like to use the resulting collisions to count the number of
     channel from transmitter to receiver i.e., R(∆f ) = h2 .                transponders.
                                                                                At a high level, our approach is simple. We exploit the fact
4.     C ARAOKE OVERVIEW                                                     that two transponders, typically, do not have the same car-
                                                                             rier frequency, and that their carrier frequency offset (CFO)
   Caraoke is a networked system that enables query-
                                                                             is relatively large. In particular, the specifications of the E-
response communication between a Caraoke reader and the
                                                                             ZPass transponder show that the device’s CFO can exceed
e-toll transponders in its range. At the heart of Caraoke is
                                                                             one MHz [36]. CFO is typically a nuisance for wireless com-
a new device that we call the Caraoke reader; it counts, lo-
                                                                             munication systems which have to compensate for CFO be-
calizes, and decodes transponders’ ids from their signal col-
                                                                             fore decoding. In Caraoke however, we leverage CFO for
lisions. It also estimates the speeds of the cars carrying the
                                                                             our advantage to count the number of colliding transpon-
transponders. The Caraoke reader harnesses its power from
                                                                             ders. Specifically, we take the FFT of the collision signal.
solar energy and has an LTE modem to connect to the In-
                                                                             Since different transponders have different carrier frequen-
ternet. Hence, it can be easily deployed without the need for
                                                                             cies, the Fourier transform shows multiple peaks at differ-
additional infrastructure. As shown in Fig. 3, smart cities can
                                                                             ent frequencies that corresponds to the various transponders’
deploy Caraoke readers on street-lamps to support a variety
                                                                             CFOs. Fig. 4 shows the Fourier transform of a collision sig-
of smart services including: 1) traffic monitoring, 2) speed
                                                                             nal where five e-toll transponders transmitted at the same
enforcement, 3) red-light running, 4) smart street-parking,
                                                                             time. As can be seen in the figure, there are five peaks, each
and even 4) allowing a user who forgets where he parked to
                                                                             corresponds to one of five colliding transponders.
query the system to locate his parked car.
                                                                                This shows that one way for counting the transponders
6 ′
 s (t) has a zero mean because s(t) is an on-off keying signal               would be to take an FFT of the collision signal and count the
with Manchester encoding , and s′ (t) is the same as s(t) but                peaks in the Fourier domain. To understand the performance
shifted by -0.5.                                                             of this estimator, we need to tie it to the resolution of the

                                                                       300
1.0
FFT and whether it can distinguish the differences between
the CFOs of the transponders. The resolution of the FFT, δf 0.8
refers to the width of each FFT bin and can be written as:
0.6
1
Power
δf = (6)
T 0.4
where T is the FFT time window. Since the length of the
0.2
transponder’s response is 512µs, the maximum FFT window
is T = 512µs and hence the resolution of the FFT is δf = 00
200 400 600 800 1000 1200
1.95 kHz. Thus, if two transponders have carrier frequencies
CFO (KHz)
that differ by less than 1.95 kHz, their peaks will fall into
the same FFT bin and will be counted as one. Given that the Figure 4—Transponders Response in Frequency Do-
CFO range is 1.2 MHz, the peak of a transponder can fall main. Fourier transform of a collision signal where five e-
toll transponders transmitted at the same time. The number
in any of N = 1.2 MHz/1.95 kHz = 615 FFT bins. If m of peaks indicates the number of transponders in the area.
transponders collide, then the probability of not missing any
transponder by counting FFT peaks is: determine the number of cars in range. However, there is a
N
possibility that two cars have fallen into the same bin. Hence,
m · m! Caraoke considers the peaks with two or more transponders’
P(not missing any transponder) = (7)
Nm signals as two cars when it is counting the peak. Specifi-
Unfortunately this probability decreases quickly as more cally, if an FFT peak includes a single frequency, Caraoke
transponders are in range. The probability of not missing any counts it as one car and if it has two or more frequencies,
transponder is 98%, 93% and 73% for m = 5, 10 and 20 cars, it counts it as two cars. Hence, the result of counting will
respectively. The above derivations shows that an estimator be incorrect only when there is at least a bin which includes
that simply counts the number of peaks in the FFT is accept- three or more cars. In another word, the probability of not
able at low car density but can easily miss some cars when missing any transponder is equal to one minus the probabil-
the number of cars in range is large. ity of having at least one FFT bin which includes three or
So, how can we improve the quality of our estimate in sce- more transponders’ signal. For m colliding transponders and
narios of high densities? To overcome this problem, Caraoke N FFT bins in the 1.2 MHz range, this probability becomes:
distinguishes whether one or more transponders have fallen
into the same FFT bin while counting the number of peaks. P(not missing any transponder)
It does this by leveraging the phase rotation property of the = 1 − P( ∃ bin with ≥ 3 transponders)
Fourier transform, which says that a shift in the time domain X
≥1− P(bin i with ≥ 3 transponders) (9)
translates into phase rotation in the frequency domain:
i∈{1,...,N}
F{r(t)} = R(f ) (m−3)
(8) N m N
F{r(t + τ )} = R(f ) · e j2π·f τ ≥1−
1 3 Nm
where r(t) is the signal in time domain and R(f ) is its fre- Substituting N = 615, the probability of not missing any
quency representation. Specifically, if the FFT peak contains transponder is at least 99.9%, 99.9% and 99.7% for m = 5,
a single transponder’s response, then performing the FFT on 10 and 20. Thus, having the capability to detect the peaks
the same signal with a time shift τ causes only a phase ro- that have two or more transponder’s signals significantly im-
tation of the peak value but the magnitude of the peak does proves the probability of correctly counting the cars.
not change. In other words, kR(f )k = kR(f ) · ej2π·f τ k, where Finally, note that for simplicity, our analysis has assumed
R(f ) is the frequency representation of the received signal. a uniform distribution for CFO. However, we have also ex-
In contrast, say the CFOs of two transponders, f and f ′ , fall perimentally validated our solution for empirical CFO mea-
into the same FFT bin, then the value of the peak in that bin surements collected from 155 different transponders.7 Our
without a time-shift is R(f ) + R(f ′ ) while its value with a empirical results show that the probability of not missing any
′
time-shift of τ is R(f ) · ej2π·f τ + R(f ′ ) · ej2π·f τ . Since the fre- transponder is 99.9%, 99.5% and 95.3% for m = 5, 10 and
quencies are slightly different, they rotate by different phases 20 which are slightly worse than analytical-results.
and results in a change in the magnitude of the peak.
The above provides us with a mechanism to determine 6. L OCALIZING E-T OLL T RANSPONDERS
whether an FFT bin has one or more transponders. To do so,
we compare the magnitude of the FFT bin with and without Car localization is an essential function for multiple
a time-shift. If the two magnitudes are different by more than smart services such as smart parking and detecting red-
a noise threshold, then multiple transponders have fallen into light runners. The first step in localizing cars is to local-
that bin. In the following, we explain how this detection sig- ize the transponder located on cars’ windshield. To do so,
nificantly improves the probability of getting a correct count. Caraoke first calculates the angle at which the signal from
Probability of getting the correct count: As explained be- 7
The mean and standard deviation of their carrier frequen-
fore, Caraoke counts the number of the peaks in the FFT to cies are 914.84 MHz and 0.21 MHz, respectively.
301ant. 2 ant. 1
Transponder
Figure 6—Antenna Re-configuration. Caraoke reader has
three antennas arranged in an equilateral triangle to achieve
higher accuracy in calculating spatial angle of transponder.
Figure 5—Transponder Localization. Caraoke calculates In this case the spatial angle, α, is always between 60 to 120
the spatial angle (α) of transponder by measuring the phase degrees regardless of transponder location
difference in signal received at two antennas.
can be seen from the equations, one can not directly compute
the transponder arrives at the Caraoke reader. This angle in- ∆φ for the ith transponder using ∠ rr21 (t) r2 (t) h2
(t) since ∠ r1 (t) 6= h1 for
dicates the spatial angle between the transponder and reader, a specific transponder.
and typically referred to as the angle-of-arrival (AoA). Fortunately, however, we can use the same trick we used
In order to measure the AoA, a Caraoke reader uses two for counting the transponders. Specifically, we first take
antennas separated by a distance d. It is widely-known that the FFT of the collision at each antenna and identify the
the angle of arrival can be computed as [60]: peaks, where each peak corresponds to the response from
one transponder. For each peak in the first antenna’s signal,
∆φ λ the phase value is compared to the phase value of the same
cos α = , (10)
2π d peak in the other antenna’s signal. These phase differences
where α is the spatial angle between the transponder and the are used to calculate the spatial angle α for each transpon-
reader, shown in Fig. 5, ∆φ is the phase difference between der. Mathematically, the above approach works because the
the two antennas (i.e. ∆φ = φ2 − φ1 ), and λ is the carrier Fourier transform is linear, i.e.:
wavelength 8 .
F{ax(t) + by(t)} = aX(f ) + bY(f ) (12)
To compute α, we need to substitute the value of the other
parameters in Eq. 10. While d and λ are known, ∆φ should Using the above property, the frequency representation of the
be measured. In the absence of collisions, ∆φ can be mea- received signal at the antennas when m transponders respond
sured directly between the signals received by the two anten- can be written as:
nas on the reader: R1 (f ) = R11 (f ) + R12 (f ) + · · · + R1m (f )
(13)
r2 (t) h2 · s(t) · ej2π∆f ·t h2 R2 (f ) = R21 (f ) + R22 (f ) + · · · + R2m (f )
∆φ = ∠ =∠ =∠ ,
r1 (t) h1 · s(t) · ej2π∆f ·t h1
where R1i (f ) and R2i (f ) are frequency representation of the
where r1 (t) and r2 (t) are baseband signals received by the received signals from the ith transponder to the first and sec-
first and second antenna, respectively, h1 and h2 are the chan- ond antenna, respectively. As it was explained in §3, the re-
nels to the two antennas, s(t) is the transmitted baseband ceived signal from each transponder has a peak at its CFO
signal and ∆f is the CFO between the transmitter and re- where the value of the peak represents the channel coefficient
ceiver9 . However, since in Caraoke reader each antenna re- (i.e. R(∆fi ) = h2 ). Hence, R1 (f ) and R2 (f ) signals have multi-
ceives a collision from multiple transponders, such a direct ple peaks where each peak corresponds to the response from
measurement does not work. This is due to the fact that the only one transponder. Therefore, the ∆φ for the transponder
received signal is the summation of responses from multiple i can be calculated as follow:
transponders while each has its own channel. Thus, the re- R2 (∆fi ) h2i
ceived signal at each antenna when m transponders respond ∆φ = ∠ =∠
R1 (∆fi ) h1i
can be written as:
where ∆fi is the CFO of transponder i, and R2 (f ) and R1 (f )
r1 (t) = r11 (t) + r12 (t) + · · · + r1m (t)
(11) are frequency representation of the received signal at the
r2 (t) = r21 (t) + r22 (t) + · · · + r2m (t), the first and second antennas. Substituting the measured ∆φ
in Eq. 10, we can compute the spatial angle between the
where r1i (t) and r2i (t) are the received signal from the ith
transponder and reader (i.e. AoA).
transponder to the first and second antenna, respectively. As
The above equation allows us to compute the spatial angle
8 from the reader to the transponder. We can however improve
Note that since Caraoke reader is placed outdoor on a high
pole like a street lamp, it has a strong line-of-sight path the accuracy of our angle estimate with a smart choice of
to the transponder and the multipath effects which occur antenna position. Specifically, the accuracy in calculating α
in standard indoor environments are significantly weaker. is best for angles around 90o and degrades for angles around
Hence, Caraoke does not require a large antenna array to es-
timate the angle of arrival. In §12, we empirically show that 0o or 180o . This is due to the fact that ∆φ is proportional
Caraoke does not suffer from multipath effects. to cos α, as shown in Eq. 10. Hence, for values close to 0
9
Note that the received signals on the two antennas experi- or 180, α is very sensitive to change in ∆φ. To reduce this
ence the same CFO since the antennas are connected to the sensitivity, we use three antennas arranged in an equilateral
same oscillator on the Caraoke reader. triangle as shown in Fig. 6. At any time, we use a pair of
302z cars, this introduce some error, which we will discuss in the
following section.
r x
b 7. D ETECTING A C AR ’ S S PEED
y As described earlier, Caraoke can also detect the speed
of the car. Specifically, Caraoke readers can be deployed on
street-lamps and detect speeding on streets in the city. The
Figure 7—Localizing the Car from AoA: In this figure α car speed can be estimated by localizing the car at two dif-
is angle of arrival and b is the height of the pole. The car is ferent locations and computing the total time the car took to
located on a point on the intersection of the cone and the road
plane which is a hyperbola. Hence, By using the information travel between these two locations. Hence, the speed of the
from two poles, one can localize the exact location of the car. car can be written as:
x2 − x1
v=
delay
antennas out of the three antennas. We pick the pair using
a programmable switch. In this setup, for any transponder where x1 and x2 are first and second locations of the car and
position, there exists exactly one pair of antennas for which delay is the amount of time it took to travel from location x1
the spatial angle is always close to 90◦ (i.e., between 60◦ to location x2 which are computed as described §6.
and 120◦ ). We compute the angle for all pairs and use the The accuracy of localizing the x1 and x2 and estimating the
pair whose angle is close to 90◦ degree to localize the car. delay depends on the time synchronization between the read-
Next we use the spatial angle to locate the transponder. ers. The error in x1 and x2 can be upper bounded using the
The spatial angle does not correspond to a single point in hyperbola equation in the previous section independent of
the space. In fact, as shown in Fig. 7, this angle corresponds time synchronization. This error depends on reader’s height
to all points on the surface of a cone where its altitude axis and the number of lanes in the same direction on the street.
is parallel to the road. The cone equation can be written as For example, for a four lane street i.e. two lanes in each di-
follow: rection, where the antennas are attached to a street light pole
y2 + z2 = r2 = (tan(α) · x)2 (14) whose height is 13 feet, the maximum error is 8.5 feet. 11 The
error in delay is the same as the error in timing synchroniza-
where x,y and z are coordinate of the car with respect to the tion. Since the readers are connected to the Internet via LTE
center of measuring antennas, and α is the spatial angle be- modems, they can be synchronized up to tens of ms network
tween the car and reader. Cars, however, are always on the timing protocol (NTP) [3, 45].
road and we can use this as another constraint. The intersec- The accuracy of estimating the speed depends on the accu-
tion of the cone and the road plane is a hyperbola, as shown racy of the above parameters as well as how far x1 and x2 are
in Fig. 7. The equation for this hyperbola is as follow: from each other. The farther they are, the more accurate the
estimate is. In particular, if x1 and x2 are measured at read-
(tan(α) · x)2 − y2 = b2 (15) ers that are separated by 4 light poles (i.e. a separation of of
where b is a constant that corresponds to the height of the about 360 feet (≈110 m) [10]), for car speeds of 20 mile/hour
pole. While a single hyperbola is not enough to localize, we and 50 mile/hour, the maximum error is 5.5% and 6.8% re-
can combine information across two readers to locate the car. spectively. This accuracy can further be improved by taking
Specifically, using a second reader located on the other side more measurements along the street from more light poles.
of the road provides us another hyperbola equation. Then,
by solving these two equations, one can find x and y, and 8. D ECODING T RANSPONDERS ’ I DS
localize the car.10 In this section, we explain how Caraoke decodes an indi-
Note, in the case where antennas are tilted by 60◦ , the pro- vidual transponder in the presence of collisions of multiple
cess of localizing is the same, except that the cone is tilted transponders.
by 60◦ . Hence, the intersection of the cone and road plane is At first glance, it might seem that one can decode a
an ellipse instead of a hyperbola. One can simply replace the transponder’s signal by using a band-pass filter centered
hyperbola equation with that of an ellipse to find the inter- around the transponder’s CFO peak. This solution however
section point. does not work because OOK has a relatively wide spectrum
Finally, in order to intersect location information across –i.e., the data is spread as opposed to being concentrated
two readers, we need this information to be synchronized. around the peak12 .
We can leverage the readers’ connection to the Internet to
√ √
synchronize them to within tens of ms using the network 11 b2 − b2 +(l·w)2
timing protocol (NTP) [3, 45]. This synchronization level is The exact equation of error is tan(α) where b is an-
more than sufficient for localizing parked cars. For moving tenna’s height, l is the number of lanes in the same direction
on the street and w is the width of the lane (typically 12 feet).
10 12
The intersection of two hyperbolas may results in more Intuitively this can be seen by recalling that OOK randomly
than one point, however, only one of these points is located toggles between 0 and 1 and hence it’s spectrum resembles
on the road and the rests are on the sidewalk. white noise.
303In contrast, our decoding algorithm is based on combining
Amplitude
multiple collisions in a manner that ensures that the signal
from the target transponder combines coherently, whereas
the signals from other transponders combine incoherently.
Time
This allows Caraoke to boost the SNR of the target transpon-
(a) Time signal before averaging
der above others, and hence decode the target transponder.
Specifically, when a Caraoke reader transmits the query
Amplitude
signal, multiple transponders respond simultaneously. With-
out loss of generality, let us assume that we are interested in
decoding transponder 1.
X Time
r(t) = h1 s1 (t) · ej2π·∆f1 ·t + hi si (t) · ej2π·∆fi ·t (b) Time signal after averaging 8 times
i
Amplitude
where si (t) is the signal transmitted by the ith transponder,
∆fi is its CFO, and the hi is its channel to the reader. If the
reader transmits another query, the received signal will be:
X Time
r′ (t) = h′1 s1 (t) · ej2π·∆f1 ·t + h′i si (t) · ej2π·∆fi ·t (c) Time signal after averaging 16 times
i
Figure 8—Decoding a transponder’s response: (a) Re-
Note that the channel coefficients have changed from the first ceived signal before averaging, (b) after averaging 8
received signal to the second one. This is due to the fact that replies, (c) after averaging 16 replies. Caraoke is able to
the transponders start with a random initial phase. The chan- decode a transponder’s response by correcting its channel
nels h1 and h′1 as well as the CFO ∆f1 can be estimated from and then averaging.
the peak in the frequency domain as described in §3. We can
then compensate for the CFO and the channels of transpon- road might be in the range of two or more Caraoke read-
der 1 and sum up the received signals to obtain the averaged ers.13 Therefore, there is a need for a MAC protocol on the
signal s̃1 (t): readers side to avoid interference from readers. We will start
by distinguishing between two interference scenarios:
r(t) −j2π∆f1 t r′ (t) −j2π∆f1 t
s̃1 (t) = ·e + ′ ·e 1. Collision of Reader Queries: In this case, a query sig-
h1 h1
nal from a reader collides with a query signal from another
h′i
X hi
= 2 · s1 (t) + + ′ si (t) · ej2π(∆fi −∆f1 )t reader. As explained in §3, the query signal transmitted by a
i
h1 h1 reader is simply a sinewave transmitted at carrier frequency.
Even if two readers interfere, the combined signal is still a
By repeating this process N times we get:
sinewave at the carrier frequency, and hence a valid trigger.
Thus, a collision of two queries is not harmful. Our empiri-
X X hij
s̃1 (t) = N · s1 (t) + si (t) · ej2π(∆fi −∆f1 )t cal experiments confirm that transponders are still triggered
i j
h1j to respond even when queries from different readers collide.
where hij is the channel from the i-th transponder in the j-th 2. Collision of Reader Query with a Transponder Re-
received signal. As can be seen from the above equation, the sponse: In this case, a query signal from a reader collides
signals from transponder 1 add coherently, while the other with the response of a transponder queried by another reader.
signals add incoherently with random phases and average This collision is harmful and needs to be avoided. To do so,
out. For sufficiently large N, the signal power for transpon- Caraoke uses carrier sense. Specifically, each reader listens
der 1 will be much more than that for other transponders. In to the medium before transmitting a query. If the medium
this case, the SNR is enough to be decoded. is available, it then transmits its query. But how long should
Fig. 8 shows an example of this decoding algorithm in the reader listen to avoid a collision with a transponder re-
which the reader receives a collision of the signals from five sponse. Recall from Fig §2 in §3, that the query signal is only
transponders. Fig. 8(a) shows the time signal r(t) of the re- 20µs and the delay between the query and the transponder
ceived collisions before any averaging. As can be seen, the response is 100µs. Thus, by listening for more than 120µs,
signal looks random and undecodable. Fig. 8(b) and (c) show if the reader does not hear any signal it can guarantee that no
the time signal s̃1 (t) after averaging 8 and 16 replies respec- transponder response will be transmitted after the 120µs and
tively. The figures show that after averaging 16 times, the bits it can transmit its query.
of the desired transponder become decodable and the more To summarize, Caraoke uses a MAC protocol for the read-
we average, the better our ability to decode becomes. ers based on CSMA, where each reader listens for an idle
medium for 120µs before it can transmit. The main differ-
9. C ARAOKE M ULTIPLE R EADER P ROTOCOL ence, however, is that there is no need for contention window
since collisions between queries are acceptable.
So far, we have assumed that transponders respond to a
13
single reader at any time. However, a transponder on the The range of a Caraoke reader is 100 feet.
304Power Management efficient in terms of both power and cost. Specifically, a
full TX chain includes a mixer, a frequency synthesizer
(PLL), a digital-to-analog-converter (DAC) and some dig-
Micro-Controller
ital logic. These components are necessary to transmit
Receiver
data bits. Yet, the e-toll query signal is just a simple sine-
Modem
wave and does not carry any data. Such a sine-wave can
be generated using a simple frequency synthesizer (i.e., a
Query PLL), and does not need the rest of the components in the
Generator standard TX chain. The frequency synthesizer is turned
on/off by the micro-controller so that the resulting sine-
Figure 9—Block diagram of the Caraoke reader wave has the proper duration of the e-toll query.
• Replacing FFT with the Sparse FFT: As mentioned
in §6, Caraoke operates on the response signal in the fre-
10. C ARAOKE R EADER ’ S H ARDWARE D ESIGN
quency domain after taking an FFT. At any time, the num-
Caraoke is a software-hardware solution. In contrast to the ber of transponders that respond to the query is typically
previous sections, which focus on the algorithmic techniques much smaller than the FFT size. In fact in most cases only
underlying Caraoke, here we describe the hardware design a handful of transponders respond. Remember that each
and the optimizations we performed in order to support a transponder creates a peak at the output of the FFT. Thus,
low-power low-cost device. the output of Fourier transform is sparse. For such sparse
We have developed a custom-design PCB for the Caraoke signals, one can compute the Fourier transform in sub-
reader. The device harvests its power from solar energy and linear time [32, 31]. To do so, we use the sFFT algorithm
connects to the Internet via a wireless modem. Hence, it can in [33, 11], which is both simple and has low computa-
be attached to a light pole (or other structures) without the tion complexity. This directly translates into reduction in
need for external power or wired Internet connectivity. power consumption and speedup in the computation.
Fig. 9 illustrates the block diagram of the Caraoke reader. • Duty Cycling: Caraoke reader has two operating modes:
The device has five main block: a query generator, a re- active mode and sleep mode. In the active mode, the reader
ceiver, a micro-controller, a modem, and a power manage- transmits queries, receives responses, and processes the
ment unit. The query-generator transmits a query signal that signals. In the sleep mode, the query generator and re-
invokes a response from nearby transponders, the receiver ceiver are turned off by the micro-controller by shutting
receives the response signal, digitizes it, and provides it to off their power supply. All peripheral blocks are also de-
the micro-controller. The micro-controller implements the activated. However, the master clock continues to run.
standard receiver processing, i.e., packet detection, phase es- A timer (typically called sleep timer) uses this clock to
timation, etc. It also implements our algorithmic solutions wake the micro-controller up at a specific time. The micro-
for counting, localization, speed measurement, etc. The pro- controller controls the scheduling of the active and sleep
cessed data is then uploaded to the Internet via an LTE mo- modes to satisfy a desired power budget. Since each query
dem. (An alternative approach could use a WiFi modem, and takes about 1ms, we expect the average duration of the ac-
have the readers forming a mesh network to connect to the tive mode to last for 10ms, allowing for a maximum of 10
Internet. However, the mesh network formation is beyond queries. By controlling the duration of the sleep mode, the
the scope of this paper.) Finally, the power management unit total power consumption can be dramatically reduced as
includes a small solar panel that attaches on top of the PCB, we show in §12.5.
and a rechargeable battery that stores the harvested energy
for operation during night time and on cloudy days. Solar 11. E VALUATION S ETUP
panels can harvest ∼ 10mW/cm2 on sunny days [57, 53]. We
use a 6cmx7.5cm solar panel, which can provides 500mW Implementation: We implemented Caraoke reader on a
[47]. In §12, we show that this number is several folds larger printed circuit board (PCB) using off-the-shelf compo-
than the power consumption of a Caraoke reader. nents. For the RF front-ends we use Maxim Integrated
Finally, the device is equipped with a USB port which is MAX2117 [41] and Analog Device AD7356 [15], and the
used to program the micro-controller. The same USB port Calliope LTE modem [50]. For the micro-controller, we use
can also be used to power the device and extract the data, an Arduino Due board. The power management circuit in-
during the development phase. cludes regulator to regulate the voltage from the solar panel.
In order to minimize the cost and power consumption of For the solar panel, we use OSEPP SC10050 [47]. The
Caraoke reader, we perform multiple optimizations as fol- RF chains share the same clock for accurate synchroniza-
lows: tion. The antennas are omni-directional and separated by
λ
2 = 6.5 inches. The ADC resolution is 12 bits. Also, the
• Eliminating the TX chain: A Caraoke reader has to ADCs have differential inputs, and hence higher robustness
transmit a query signal to request a response from the to noise and interference. The total cost of the components
transponders. One approach to generate this query is to is less than $40, making the device amenable to large scale
use a standard transmitter (TX) chain, which generates the deployment. Further, this cost can be significantly reduced
signal in the digital domain. This approach however is in- in mass production.
305102
Street A
100
Accuracy (%)
98
Street C
Street B
96
94
5 10 15 20 25 30 35 40 45 50
Number of Trasnponders
Figure 11—Counting Accuracy: Plot of Caraoke’s count-
ing accuracy as the number of colliding transponders in-
creases.
12.1 Counting Accuracy
In the first experiment, we aim to evaluate Caraoke’s abil-
ity to count transponders based on their CFOs. If we ran this
Street D experiment directly on collision signals, we would not know
the ground truth. Hence, we needed first to estimate the CFO
Figure 10—Experimental Setup. We ran our experiments of each transponder in the absence of collisions. We col-
on four streets in our campus, marked as streets A, B and C lected signals from 155 different transponders in one of our
in the top figure and street D in the bottom figure. All streets campus parking lots. We used a directional antenna to ob-
have two-way traffic and most have parking spots on one or tain the response of each transponder without collisions. For
both sides. each transponder, we took the FFT of its signal and noted
the FFT bin of its CFO. We then create collisions in post-
We note that for our setup, we extract the data using the processing by summing up the time signals from a subset
USB port as this does not require an LTE subscription and of the transponders. We change the number of transponders
has no impact on counting, localization, or speed estimation. in the subset to obtain collisions with different numbers of
colliding transponders. Finally, we take an FFT of each col-
Experimental Setup: We conducted our experiments on
lision signal and estimate the number of colliding transpon-
four campus streets, A, B, C, and D, which are shown in
ders using the approach described in §5. We have considered
Figs. 10(a) and (b). All streets have 2-way traffic. Streets A,
collisions of 5, 10, . . . , 50 transponders, and for each case
B, and D have street parking one or both sides of the road.
performed 1000 runs.
Street C is the busiest street on campus, and is a major street
Fig. 11 plots the average accuracy in counting colliding
in our city. In all of our experiments, the Caraoke reader was
transponders. The figure shows that when the number of
placed on a 12.5-feet pole. We used a total of 4 such poles.
transponders in a collision is relatively small, Caraoke accu-
The poles are portable and hence allow us to experiment with
racy is very close to optimal. In particular, given the empiri-
various configurations, as detailed in §12.2.
cal CFO values of e-toll transponders, Caraoke can maintain
All experiments were conducted with standard E-ZPass
an accuracy higher than 99% when the colliding transpon-
transponders attached to the cars’ windshields. We tried to
ders are fewer than 40. Note that the overall counting accu-
limit our experiments to transponders and cars owned by the
racy depends on how often the reader would experience 40-
authors. However, certain experiments require investigating
transponder collisions vs. 5-transponder collisions, or other
the distribution of transponder CFOs and its impact on our
numbers. This depends on the intersection and the amount of
ability to count vehicles. For that experiment, we collected
traffic. Overall, the results show that Caraoke is effective at
transponder responses from random cars. We measured only
counting vehicles using e-toll transponder collisions.
the CFO of the transponders and did not decode the bits. Af-
In our second experiment, we deployed Caraoke at the in-
ter processing the signals to extract and count the CFOs, we
tersection of Street A and Street C in Fig. 10(a), and used
stored only the CFO values with no reference to the ids of
it to track the flow of traffic on the two streets. In this ex-
the car. We do not believe that the values of the CFOs can be
periment, we do not know the ground truth since we do not
mapped to the owners or used to infer any private informa-
know which cars have transponders; despite this limitation
tion about them. Finally, we note that our transmissions of a
the results can indicate the ratio of traffic between the two
sine-wave in the band used by E-ZPass is in accordance with
streets and how it relates to the timing of their green-light
the FCC rules Part 15 [27].
and red-light.
Fig. 12 plots the number of cars observed by Caraoke as a
function of time for both streets. The figure is marked with
12. E MPIRICAL E VALUATION OF C ARAOKE
the green-yellow-red times for the traffic lights on each of the
We evaluate the various functions of Caraoke using out- streets. The figure shows how a backlog of cars accumulates
door experiments performed with E-ZPass transponders. during a red-light and clears during a green light. Further,
3068
Localization Error (in degree)
6
4
2
0
1 2 3 4 5 6
Parking Space
Figure 13—Transponder’s Localization Accuracy. Figure
Figure 12—Traffic Monitoring at an Intersection. The shows the accuracy of localization for cars parked in differ-
figure shows the number of cars counted by Caraoke at an ent parking spaces where the spot 1 is closest and spot 6 is
intersection over two periods of green-red lights. the furthest spot to Caraoke pole. Caraoke enables enough
accuracy to detect occupied versus available spots
road C is much busier than road A (10 times on average), 1.0
but its green light is only 3 times longer than that of road
A. This shows that Caraoke can help the city understand the 0.75
relative congestion on various streets, and potentially adapt
the timing of the traffic light to reduce car waiting time.
Power
0.50
12.2 Localization Accuracy 0.25
In this experiment, we focus on localizing cars to park-
0
ing spots. We ran our experiments on streets A and B, which -100 -80 -60 -40 -20 0 20 40 60 80 100
Angle of Arrival (degree)
have parking spots on one or both sides of the road, for a
total of 36 spots. We use 4 poles, two deployed on street A Figure 14—Multipath Profile. Caraoke readers have strong
and one at the intersection of A and B, and one on street B. line-of-sight paths to the transponders. Therefore, multipath
We use two cars equipped with E-ZPass transponders, which effects which occur in standard indoor environments are sig-
nificantly weaker.
we move between different parking spots to experiment with
different configurations. There are other cars parked on the
street, whose transponders collide with our two cars. We away from the pole. This is because the two antennas used
ran over 175 localization tests which span 35 configurations for computing the AoA create a 60o angle with the plane of
for the cars, and 5 runs per configuration which differ by the road. As explained in §6, without this tilt the error in
the number and identity of the colliding transponders due AoA for the farthest spot, i.e., spot 6, would be significantly
to other parked cars and traffic dynamics on the streets. In larger than the closer spots. The results show that our deci-
our processing, we ignore the FFT spikes corresponding to sion of positioning the antennas at 60o angle with the street
other cars and focus on localizing our transponders using produces a relatively balanced error across spots.
the method described in §6. To measure the ground truth we One may be surprised that Caraoke’s AoA accuracy is
use a Bosch GLM50 laser distance measurement tool [17], high despite that it uses a simple two-antenna array. Large
which can measure distances to within a few millimeters. We antenna arrays are typically needed in multipath scenarios
then measure the ground truth angle using our knowledge of to separate signals that travel along different paths from
the transponder’s distance from the pole, the pole’s height, source to destination. While multipath effect has been a big
and the transponder’s elevation.14 challenge for indoor localization, it becomes less prominent
Fig. 13 plots the error in the angle of arrival measurement in Caraoke’s design, primarily because Caraoke reader is
computed by Caraoke. The errors are plotted as a function mounted on a several meter high pole in an outdoor environ-
of the location of the parking spot with respect to the pole ment, and hence, has a prominent line-of-sight path between
carrying the Caraoke reader. The bar graph shows the aver- transmitter and receiver. To ascertain that this setting indeed
age and standard deviation of the measurements from all four has low multipath, we augmented Caraoke with an antenna
poles. The figure shows that the average localization error is attached to a rotating arm of radius 70cm. Like past work
about 4 degrees. Interestingly the error is the largest at the [37], we use this design to emulate a large antenna array
two ends, i.e., when the car is only 1 spot away or 6 spots (Synthetic Aperture Radar) and obtain the multipath profile
of the signal coming from the car’s transponder. As the an-
14
Measuring the ground truth for 3D angles is difficult. How- tenna rotates, we continuously measure the wireless channel
ever, since the car is parked to the side of the road, the of the transponder’s signal and then use the measured chan-
transponder, the pole and the two antennas are approxi- nels to reconstruct the multipath profile of the transponder’s
mately in the same plane. Hence, knowing the distances we
can measure the ground-truth angle with simple geometry signal using standard phased array processing algorithm and
rules. Note that this approximation means that our results are the MUSIC algorithm [60].
conservative –i.e., Caraoke’s actual errors could be slightly A representative multipath profile obtained using this
smaller. setup is shown in Fig. 14. As expected, the multipath pro-
307You can also read