Kokumi taste perception is functional in a model carnivore, the domestic cat (Felis catus) - Nature
←
→
Page content transcription
If your browser does not render page correctly, please read the page content below
www.nature.com/scientificreports
OPEN Kokumi taste perception
is functional in a model carnivore,
the domestic cat (Felis catus)
A. Laffitte1,6, M. Gibbs1,6, C. Hernangomez de Alvaro1, J. Addison1, Z. N. Lonsdale1,
M. G. Giribaldi2,3, A. Rossignoli2,3, T. Vennegeerts2,3, M. Winnig2,3, B. Klebansky4, J. Skiles4,5,
D. W. Logan1 & S. J. McGrane1*
Kokumi taste is a well-accepted and characterised taste modality and is described as a sensation
of enhancement of sweet, salty, and umami tastes. The Calcium Sensing Receptor (CaSR) has been
designated as the putative kokumi taste receptor for humans, and a number of kokumi-active ligands
of CaSR have been discovered recently with activity confirmed both in vivo and in vitro. Domestic cats
(Felis catus) are obligate carnivores and accordingly, their diet is abundant in proteins, peptides, and
amino acids. We hypothesised that CaSR is a key taste receptor for carnivores, due to its role in the
detection of different peptides and amino acids in other species. Using in silico, in vitro and in vivo
approaches, here we compare human CaSR to that of a model carnivore, the domestic cat. We found
broad similarities in ligand specificity, but differences in taste sensitivity between the two species.
Indeed our in vivo data shows that cats are sensitive to CaCl2 as a kokumi compound, but don’t show
this same activity with Glutathione, whereas for humans the reverse is true. Collectively, our data
suggest that kokumi is an important taste modality for carnivores that drives the palatability of meat-
derived compounds such as amino acids and peptides, and that there are differences in the perception
of kokumi taste between carnivores and omnivores.
Taste perception is generally described through the five primary taste modalities, sweet, sour, salty, bitter and
umami, each recognised by specific receptors and transduction p athways1. In addition to these five, other “sec-
ondary” putative taste qualities such as fat taste, metallic taste, astringency and kokumi are gaining interest in
the field of sensory s ciences2–5.
Kokumi is a well-accepted taste sensation in Asian cuisine and was first characterised as a separate taste
modality by Ueda and c olleagues6,7. It is described as a sensation of enhancement of sweet, salty and umami
tastes5,8 when associated with specific compounds, or a mouthful, thick, delicious taste9. Indeed, the word kokumi
comes from the Japanese terms for rich (koku) and taste (mi). Kokumi compounds, however, are mostly described
as tasteless in isolation6,7. Recently, the human Calcium Sensing Receptor (CaSR) has been designated as the
putative kokumi taste receptor for humans8,10. CaSR is a member of the same receptor class as the T1R receptors
for umami and sweet taste, the class C of G-Protein Coupled Receptors (GPCRs)11. The receptors in this class
all have a similar structure comprising of a cytoplasmic tail, a heptahelical transmembrane domain (TMD), fol-
lowed by a large N-terminal domain (NTD), which is sometimes referred to as the Venus-Flytrap domain (VFT).
When expressed on the cell surface, CaSR is known to mainly function as a covalently-linked h omodimer12,13.
The main functional role of CaSR is to maintain calcium homeostasis in the blood14,15, through the modula-
tion of Parathyroid Hormone (PTH) secretion. With its physiological importance, CaSR has been found to be
expressed in most tissues involved in calcium homeostasis e.g. the parathyroid glands, kidneys, thyroid and the
brain15, as well as the gastrointestinal t ract16 and taste p
apillae10. It is also known to be involved in many physi-
ological processes including, but not limited to, gastric acid secretion17, or insulin release from beta-cells in the
pancreas18, promoting glucose tolerance when activated by agonist peptides16, but also in pathophysiological
processes such as vascular c alcification19 and o steoporosis15. The CaSR has at least eight binding sites, and most
1
WALTHAM Petcare Science Institute, Freeby Lane, Waltham on the Wolds, Melton Mowbray, Leicestershire LE14
4RT, UK. 2IMAX Discovery GmbH, Otto‑Hahn‑Straße 15, 44227 Dortmund, Germany. 3AXXAM S.p.A., OpenZone,
Via Meucci 3, 20091 Bresso, Milan, Italy. 4BioPredict, Inc., 4 Adele Avenue, Demarest, NJ 07627, USA. 5Present
address: Valis Pharma, Ins., 545 Bonair Way, La Jolla, CA 92037, USA. 6These authors contributed equally:
A. Laffitte and M. Gibbs. *email: scott.mcgrane@effem.com
Scientific Reports | (2021) 11:10527 | https://doi.org/10.1038/s41598-021-89558-w 1
Vol.:(0123456789)
www.nature.com/scientificreports/
Figure 1. CaSR is expressed in cat circumvallate papillae (a). GAPDH is expressed in both circumvallate
papillae and non-taste epithelial tissue (b). (a) CaSR RT-PCR for a cat circumvallate papilla (CV), non-taste
epithelial tissue (NT) and no-template controls (NTC). (b) GAPDH RT-PCR was used as a positive control in
the same tissues. Expression of CaSR was only observed in the CV tissue. M—Molecular size marker.
of these are able to only bind C a2+ and other metals. However, we know that there are at least two sites able to
bind larger agonists, one within the NTD and one within the T MD15,20.
The first study to make the link between kokumi taste and human CaSR (hCaSR), screened a large library
of γ-glutamyl peptides for agonist activity against hCaSR, and showed that these specific peptides were able to
activate the receptor in vitro8. The same γ-glutamyl peptides also elicited kokumi sensation/ taste for trained
sensory assessors when mixed with umami-tasting preparations8. Maruyama and colleagues found that mouse
CaSR (mCaSR) was expressed in the mouse lingual epithelia, in type II and type III taste cells, and co-expressed
with taste cell markers Phospholipase C β2 (PLCβ2) and Neural Cell Adhesion Molecule (NCAM). The same
study confirmed that mCaSR was activated by specific kokumi compounds and induced the release of intracel-
lular Ca2+, similar to other Class C GPCR taste receptors such as the umami receptor10. Taken all together, this
evidence strongly suggests that CaSR is indeed a putative receptor for kokumi taste in mammals.
Domestic cats (Felis catus), and other members of the Felidae family, are obligate carnivores. Accordingly,
their diet is abundant in proteins, peptides, L-amino acids and fats, but they do not eat food that contains high
amounts of s ugars21. The different dietary habits of carnivorous and herbivorous mammals has resulted in the
evolution of different taste perception s ystems22. For example, cats and humans, who are strict carnivores and
omnivores, respectively, are differently responsive to a number of L-amino acids and sweet-tasting c ompounds23.
We hypothesise that CaSR is a key taste receptor for carnivores, due to its role in the detection of different
peptides and amino acids in other species. There are currently no published data, to our knowledge, on carnivore
kokumi taste detection. Using in silico, in vitro, and in vivo approaches, we compare hCaSR to that of a model
carnivore, the domestic cat CaSR (cCaSR). We demonstrate broad similarities in ligand specificity, but differ-
ences in taste sensitivity between the two species. Collectively, our data suggest that kokumi is an important
taste modality for carnivores that enhances the palatability of meat-derived compounds such as peptides and
amino acids.
Results
CaSR is expressed in the cat circumvallate taste papillae. In order to confirm that cats express CaSR
in their taste tissue, we used biopsies of cat circumvallate papillae (CV) to perform an RT-PCR analysis (Fig. 1).
With this analysis we confirmed the expression of CaSR in the CV, with no expression being observed in epithe-
lial tongue tissue without visible papillae. (See Supplementary Data, Fig. 1 for full-length gels).
Cat and human CaSR protein sequences are homologous. In order to understand how similar
cCaSR and hCaSR are from an evolutionary perspective, we generated a phylogenetic tree of all available mam-
malian CaSR sequences and found them to display high sequence identity (Fig. 2). On the phylogenetic tree,
Scientific Reports | (2021) 11:10527 | https://doi.org/10.1038/s41598-021-89558-w 2
Vol:.(1234567890)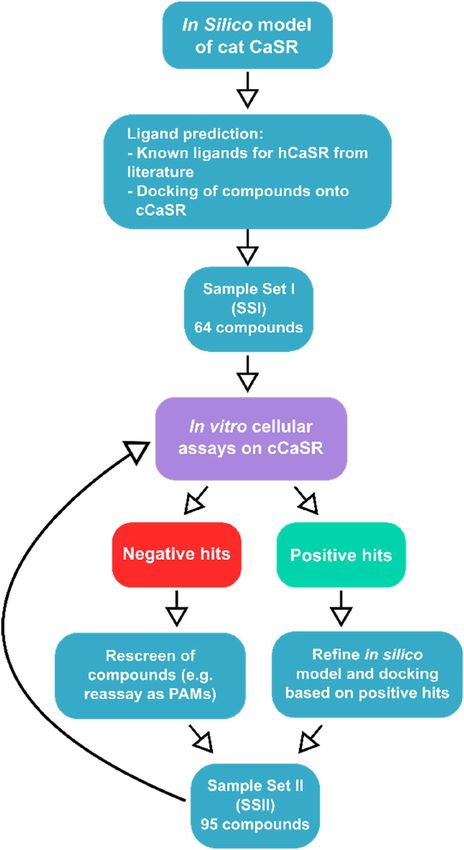
www.nature.com/scientificreports/
Figure 2. CaSR phylogenetic tree of mammalian species (a) and alignment of the residues from all four Ca2+
binding sites compared between cCaSR and hCaSR (b). (a) Labels are coloured by diet type (green = herbivore;
blue = omnivore; pink = carnivore). *—Homo sapiens, **—Felis catus. (b) Sequence alignment comparing
the residues that bind Ca2+ (blue), GSH (red) or both (purple) for hCaSR and cCaSR. The sites indicated,
correspond to Ca2+ binding sites on the receptor 20.
hCaSR clusters together with other primate species, and is the closest to the other Hominidae family members
(Fig. 2a). cCaSR, on the other hand, clusters together with other felines (strict carnivores) as well as some omni-
vores such as the dog and the fox (See Supplementary Fig. 2 for phylogenetic tree with species details). In addi-
tion to the hCaSR and cCaSR sequences, we selected a number of model species from both omnivore and strict
carnivores, to visualise possible sequence variation in the putative calcium binding site within the CaSRs NTD24.
The main residues that interact with Ca2+ “Site 2” and “Site 3” (Fig. 2b), are situated in the hinge region of the
CaSR NTD (Fig. 3)20. There are two other sites, “Site 1” (Fig. 2b) that is situated in lobe 1 of the NTD, and “Site 4”
(Fig. 2b) which is included close to the cysteine rich domain20, but these sites only bind C a2+, to the best of our
knowledge, so they were of less interest to us in this work. Only one of the amino acids in the receptor sequence
vary between cat and human, residue 91, which is a Leucine for humans and Methionine for cats (Fig. 2b). In
our sequence alignment used to generate the phylogenetic tree (Supplementary Fig. 3), we only found minor
Scientific Reports | (2021) 11:10527 | https://doi.org/10.1038/s41598-021-89558-w 3
Vol.:(0123456789)
www.nature.com/scientificreports/
Figure 3. NTD with Ca2+ of the hCaSR crystal structure (left) and homology model of cCaSR (right) (a).
hCaSR (left) and cCaSR (right) with GSH bound into their respective binding sites (b). (a) The Ca2+ binding site
a2+ binding site of cCaSR (right). The secondary structure of the hCaSR protein is in
of hCaSR (left) and the C
2+
grey. The Ca binding site of hCaSR (PDB structure 5fbk that was the template for cCaSR) is identical to cCaSR,
including the enumeration of the amino-acids. The secondary structure of the cCaSR protein is in cyan. (b) The
GSH (in green) binding site is also situated in the NTD of hCaSR (left) and cCaSR (right). The GSH binding
site of hCaSR is identical to cCaSR, including the enumeration of the amino-acids. In both species, hydrogen
bonds form with residues ALA168, THR145, SER147, SER170, SER272, GLU297; hydrophobic interaction with
TYR218; charged interaction of zwitterionic nitrogen of the amino acid group to GLU297; charged interaction
of the carboxyl group to Ca2+ (not shown for clarity of image). The images were generated using with the
Discovery Studio Visualizer (BIOVIA, Dassault Systèmes).
sequence differences between mammalian species in general, confirming the highly-conserved nature of this
receptor. Hence, we next investigated the ligand binding profile of cat CaSR to understand whether its function
differs from the human receptor.
From a predicted 159 ligands, 93 specifically activated cCaSR in a cellular model. In order to
gain a holistic view of the ligand activity of cCaSR and to be able to compare the ligand specificity to that of
hCaSR, we used a hypothesis-driven approach (Fig. 4), where we predicted possible agonists and Positive Allos-
teric Modulators (PAMs) of cCaSR using known ligands for hCaSR from literature, combined with docking into
a homology model of cCaSR NTD built using hCaSR NTD crystal structures as templates (Fig. 3). We have only
concentrated on compounds that bind within the NTD, as with our homology model all “food-related” com-
pounds e.g. peptides, amino acids, and ions, bind within this domain. We have docked a number of compounds
within the NTD, such as Ca2+ and glutathione (GSH) (Fig. 3), and these compounds bind within the pocket in
the hinge region.
The binding site within the TMD accommodates some synthetic compounds, known allosteric modulators,
that are of pharmaceutical interest, which was not the focus of this w ork15. Indeed, when we tested some of the
abovementioned ligands of interest with our homology model, none of them docked successfully into the PAM
site of transmembrane domain of CaSR. Overall, CaSR TMD ligands tend to be hydrophobic such as the synthetic
drug Cinacalcet15, whereas the “food-related” ligands of interest to our work, such as GSH or the small cations,
are polar and charged, and are better accommodated within the NTD binding site (Fig. 3). However, we did use
Scientific Reports | (2021) 11:10527 | https://doi.org/10.1038/s41598-021-89558-w 4
Vol:.(1234567890)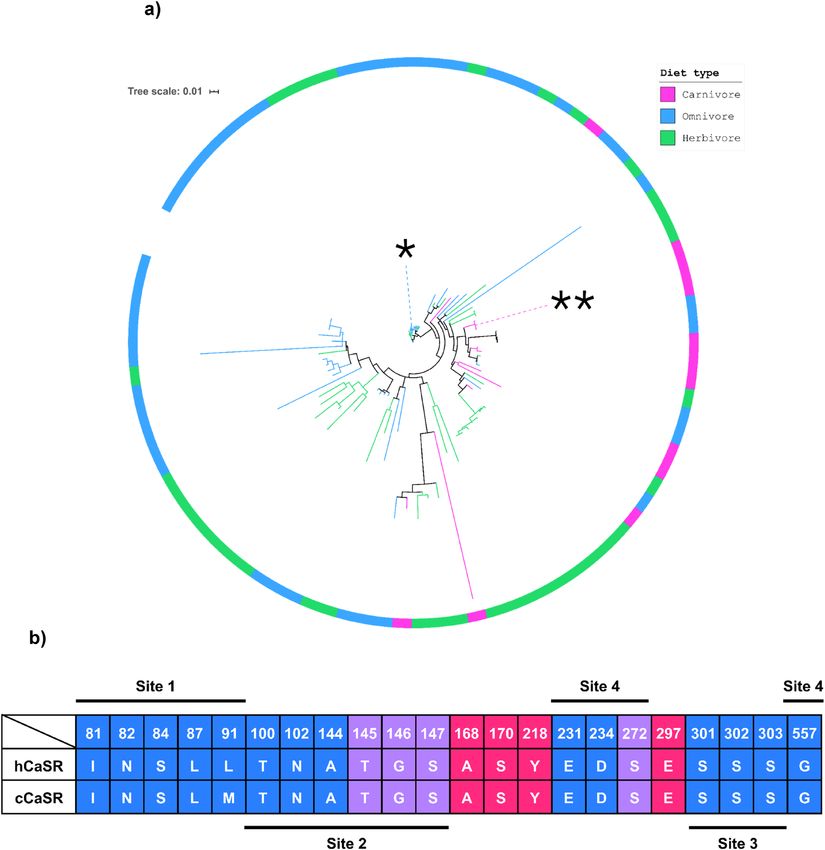
www.nature.com/scientificreports/
Figure 4. Schematic representation of the hypothesis driven, iterative approach used to predict ligand binding
into cCaSR. In the process, we used information from literature on hCaSR, as well as our homology model used
for docking. Between sample set I and sample set II, some compounds were repeated, and a final number of 159
unique compounds were screened on cCaSR.
a number of known PAMs from the literature, in order to evaluate the functionality of our cCaSR in vitro model
in comparison to the hCaSR.
Overall, we screened 159 unique predicted agonists and/ or PAMs in the cCaSR cellular assay (Supplementary
Table I). All compounds were screened in two different conditions, in the presence and absence of Ca2+, in order
to define whether a compound is an agonist (tested in the absence of Ca2+) or a PAM (tested in the presence of
Ca2+). Amongst the 159 compounds screened, we found 29 compounds to be PAMs of cCaSR. As there is no
evidence that PAMs have taste activity to the best of our knowledge, we chose to focus on the potential agonists
based on previously-published data for h CaSR8,10,15,20,25,26 and our homology model. From all the compounds
screened, we found that 64 were agonists of cCaSR, giving an overall combined agonist (64) and PAM (29) hit-
rate for our screen of approximately 58%. The agonist hit-rate was approximately 40% (Table 1). We could define
an EC50 value for 25 compounds, or 39% of all the agonists identified.
For each tested compound, a number has been assigned in Table 1, and they will be referenced by this number
throughout this section. All tested di- and trivalent cations (1–7) were shown to be agonists of CaSR with the
EC50 values ranging from 0.0003 to > 0.01 M.
Scientific Reports | (2021) 11:10527 | https://doi.org/10.1038/s41598-021-89558-w 5
Vol.:(0123456789)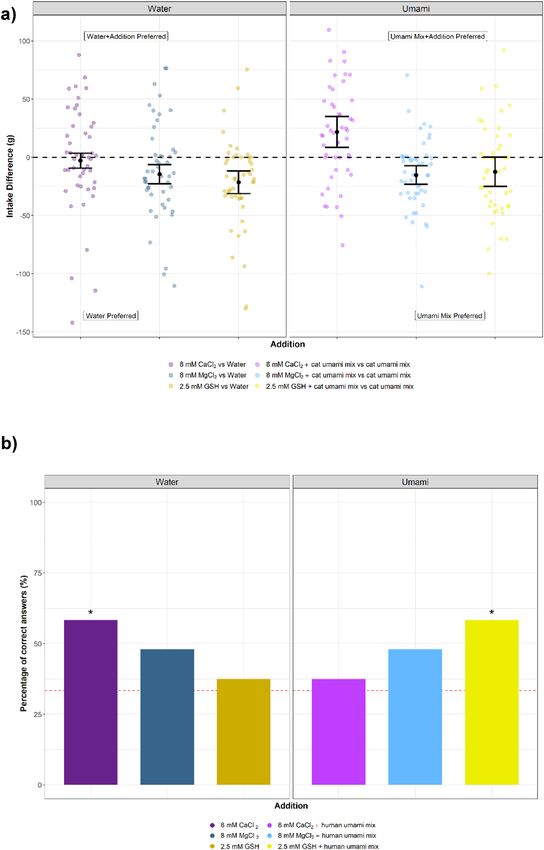
www.nature.com/scientificreports/
From the L-amino acids, only L-Glu (20) and L-Asp (10) exhibited strong agonist activity for cCaSR. In
addition, a number of L-amino acid derivatives showed agonist activity including derivatives of L-Asp (12, 13),
L-Glu (22–24), L-Gln (26), L-Cys (17, 18) and L-Tyr (35), all with affinities lower than that of Ca2+. From the
three tested polyamines, only spermidine (49) and spermine (50) were agonists of cCaSR.
GSH, considered to be an exemplar ligand of hCaSR, and four of its derivatives (43–47), were all active on
cCaSR, with similar E C50 values around 2–6 mM, except for S-lactoglutathione (46), for which the E C50 could
not be defined. We also screened four β-aspartyl peptides on cCaSR (51–54), all of which were active, and 19
γ-glutamyl peptides (55–73), of which 17 were agonists of cCaSR.
We screened seven aminoglycoside antibiotics (74–80) against cCaSR, and six were found to be agonists. This
class of compounds had varying E C50 values to cCaSR, from 0.1–2 mM, slightly higher than values previously
reported for antibiotics with h CaSR30.
There is some evidence that hCaSR is able to bind sweet-tasting compounds such as glucose, which has been
shown to function as a PAM on the r eceptor31 (81–84), which is why we tested a number of sugars on cCaSR.
However, none of the sugars we tested were predicted to function as agonists of the receptor according to our
docking model and as predicted, none of the sugars or their derivatives were agonists of cCaSR in vitro.
Compounds 85–92 belong to various classes of synthetic/ pharmacologically-active compounds that were
predicted to be active on cCaSR from the docking analysis. All of these were active on cCaSR, but we were only
able to define an EC50 value for two, 1,4,8,11-tetraazacyclotetradecane (cyclam) and methylenediphosphonic
acid (85, 92).
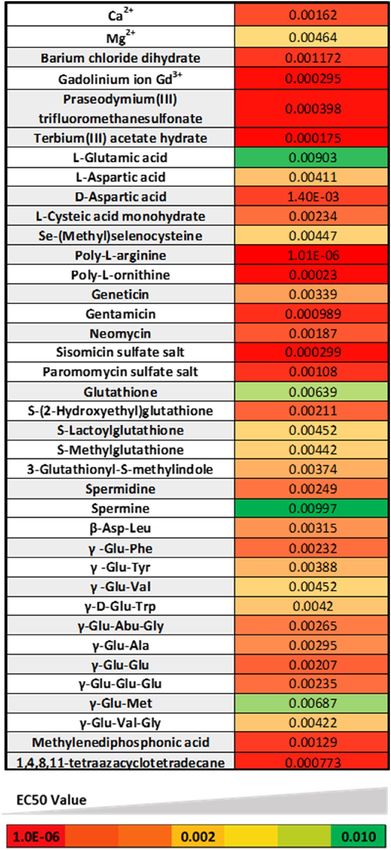
The strongest agonists were mostly cations, antibiotics, polybasic peptides, and cyclam (Fig. 5). The com-
pounds with higher E C50 values for cCaSR are spermine, L-Glu, GSH and γ-Glu-Met (Fig. 5).
A homology model of cCaSR and hCaSR reveals identical binding of cations. In order to further
understand how the receptor structure differs between the two species, we used the aforementioned homology
model generated for cCaSR and compared it to the crystal structure of hCaSR (Fig. 3) that has recently been
elucidated20,27.
CaSR functions as a constitutive dimer, and the two CaSR subunits of one receptor form covalent
homodimers12,13, tethered by a disulphide bond15. The crystal structures of hCaSR NTD20,27 show four Ca2+
binding sites, and we have included the residues that directly bind Ca2+ in Fig. 2b. One of the Ca2+ binding sites
is situated in Lobe 1 of the NTD, one between Lobe 2 and the Cysteine-rich domain, and two between the lobes
of the NTD within the hinge region. One of the Ca2+ ions within the hinge region is an integral part of the recep-
tor structure, while the other one is presumed to enhance the closure of the two lobes upon ligand binding27.
The cCaSR has a high (> 95%) sequence identity to hCaSR (Supplementary Data) with no discernible difference
within the active sites in the NTD and the binding of C a2+ ions and larger ligands such as GSH (Fig. 3a and b).
In addition, we modelled hCaSR and cCaSR TMDs and found no difference between PAM active sites for these
receptors and found that this binding site mainly accommodates large hydrophobic synthetic ligands that were
of little interest to us in the remit of this study. In conclusion, we could find no structural explanation for the
difference in ligand affinity between cCaSR and that reported for hCaSR.
cCaSR and hCaSR have near identical ligand binding activity in the same cellular system. To
better compare the ligand binding affinities of cCaSR to hCaSR, we next transiently-expressed both in the same
cellular system and also compared their responses to the stable cCaSR cell line (Fig. 6a). The dose response
curves are near identical between cCaSR expressed stably or transiently and very similar to hCaSR for most
compounds tested (Fig. 6a), including the γ-glutamyl peptides, which had significantly lower E C50 values than
reported previously8. The only case where we observed a slight difference in the dose response curves that trans-
lated to a difference in EC50 is poly-L-arginine, which had an approximately 2.5 fold lower EC50 value than
hCaSR for cCaSR in both systems.
CaCl2, but not MgCl2 or GSH, show kokumi effect for cats in vivo. Having confirmed that hCaSR
and cCaSR function similarly on a molecular level, we next compared in vivo responses in both cats and humans.
Human kokumi responses have been relatively well-documented6, but the kokumi taste perception of strictly
carnivorous mammals, such as cats, is unknown. We therefore designed a standard two-bottle choice test using
a panel of cats trained to discriminate between tastants in liquid23. We tested three compounds, C aCl2, MgCl2
and GSH, first against water and then in a mixture of umami amino acids that are palatable to c ats34, to test for
an enhancement effect similar to kokumi sensations previously described for humans.
There was no significant difference in the intake of a C
aCl2 solution compared to water (P = 0.3848) (Fig. 7a),
consistent with previous observations in humans where kokumi compounds are often tasteless on their o wn6,7.
However, cats had significantly lower acceptance of both M gCl2 (P = 0.0023) and GSH (P = 0.0002) solutions,
compared to water on its own (Fig. 7a), suggesting they are mildly aversive.
We then offered the same compounds to cats with a mixture of three palatable, umami-active amino acids
dissolved in water (15 mM L-His, 15 mM L-Trp and 15 mM L-Phe)34, and compared the cats’ response to the
amino acids alone. The cats had a significant preference (P = 0.0039) for the umami amino acid mix with C aCl2
added into the solution (Fig. 7a). However, the cats significantly preferred (P = 0.0009) the amino acid mix to
the addition of M
gCl2 (Fig. 7a). The cats displayed no statistically significant difference at the 5% level between
the amino acid mix and the amino acid mix with GSH (Fig. 7a). We then used a combined approach to measure
the difference between the intakes of each potential kokumi compound in water vs. in the umami amino acid
mix. We measured a statistically significant difference for only one of the pairs, the two solutions containing
CaCl2 (P = 0.0259).
Scientific Reports | (2021) 11:10527 | https://doi.org/10.1038/s41598-021-89558-w 6
Vol:.(1234567890)www.nature.com/scientificreports/
cCaSR cCaSR cCaSR cCaSR EC50
No Compound activity EC50 (M) No Compound activity EC50 (M) No Compound activity EC50 (M) No Compound activity (M)
γ-Carboxy-
DL- S-Methyl-
1 Ba2+ ++ 0.001172 24 + > 0.01 47 ++ 0.00442 70 γ-D-Glu-Trp + + 0.0042
glutamic glutathione
acid
L-Glu- γ-Glu-Cys-Gly-
2 Ca2+ ++ 0.00162 25 − − 48 Cadaverine − – 71 − –
tamine Oet
L-Isoglu-
3 Gd3+ +++ 0.000295 26 + > 0.01 49 Spermidine ++ 0.00249 72 γ-Glu-Val-Gly + + 0.00422
tamine
4 Mg 2+
+ > 0.01 27 Glycine − − 50 Spermine + > 0.01 73 γ-Glu-ε-Lys − –
5 Pr3+ +++ 0.000398 28 L-Isoleucine − − 51 β-Asp-Ala + > 0.01 74 Geneticin + > 0.01
6 Sr2+ + > 0.01 29 L-Leucine − − 52 β-Asp-Gly + > 0.01 75 Gentamicin + + + 0.000989
Hygromycin B
L-Methio-
7 Tb3+ +++ 0.000175 30 − − 53 β-Asp-Leu + 0.00315 76 (Streptomyces − –
nine
hygroscopicus)
8 L-Alanine − – 31 L-Proline − − 54 β-Asp-Phe + > 0.01 77 Neomycin + + 0.00187
L-Aspara- γ-Glu-Abu- Paromomycin
9 − – 32 L-Serine − − 55 ++ 0.00265 78 + + 0.00108
gine Gly sulfate salt
L-Aspartic L-Threo- Ribostamycin
10 ++ 0.00411 33 − − 56 γ-Glu-Abu + > 0.01 79 + > 0.01
acid nine sulfate salt
D-Aspartic Sisomicin sulfate
11 − – 34 L-Tyrosine − − 57 γ-Glu-Ala + > 0.01 80 + + + 0.000299
Acid salt
L-Aspartic
acid
O-Phospho- 3-O-Methyl-D-
12 β-methyl + > 0.01 35 + > 0.01 58 γ-Glu-Cys + > 0.01 81 − –
L-tyrosine glucopyranose
ester hydro-
chloride
DL-Aspar-
tic acid
13 + > 0.01 36 L-Valine − − 59 γ-Glu-Gln + > 0.01 82 D-( +)-Glucose − –
α-methyl
ester
(S)-a-Meth-
14 ylaspartic − – 37 L-Histidine − − 60 γ-Glu-Glu ++ 0.00207 83 Sucralose − –
acid
γ-Glu-Glu-
15 L-Cysteine − – 38 Taurine − − 61 + > 0.01 84 Sucrose − –
Gln
Cystine γ-Glu-Glu- 1,4,8,11-tetraaza-
16 − – 39 L-Ornithine − − 62 ++ 0.00235 85 + + + 0.000773
(disufide) Glu cyclotetradecane
Se-(Methyl) 1 s,3 s-1-aminocy-
Poly-L- 1.014
17 selenocyst- ++ 0.00447 40 +++ 63 γ-Glu-Gly + > 0.01 86 clobutane-1,3-di- + > 0.01
arginine E-06
eine carboxylic acid
L-Cysteic
Poly-L- 2-Amino-4-phos-
18 acid mono- ++ 0.00234 41 + > 0.01 64 γ-Glu-Leu + > 0.01 87 + > 0.01
lysine phonobutyric acid
hydrate
L-Homo- Poly-L- 2-Aminopimelic
19 + > 0.01 42 +++ 0.00023 65 γ-Glu-Met + > 0.01 88 + > 0.01
cysteic acid ornithine acid
L-( +)-2-Amino-
L-Glutamic
20 + > 0.01 43 Glutathione ++ 0.00639 66 γ-Glu-Phe ++ 0.00232 89 3-phosphonopro- + > 0.01
acid
pionic acid
3-Glutath-
D-Glutamic ionyl-S- L-2-Aminoadipic
21 − – 44 ++ 0.00374 67 γ-Glu-Trp + > 0.01 90 + > 0.01
acid methylin- acid
dole
4-Fluoro- S-(2-Hy-
Methylenediphos-
22 DL-glu- + > 0.01 45 droxyethyl) ++ 0.00211 68 γ-Glu-Tyr ++ 0.00388 91 + + 0.00129
phonic acid
tamic acid glutathione
2S,4S-g-
Hydroxy- S-Lactoyl- Methylphospho-
23 + > 0.01 46 + > 0.01 69 γ-Glu-Val ++ 0.00452 92 + > 0.01
L-glutamic glutathione nic acid
acid
Table 1. Activity measurement of 92 agonists on the cCaSR: All compounds listed here were screened using
the HEK T-Rex/ natClytin cell line inducibly expressing cCaSR in an agonist assay. All measurements were
repeated over at least three wells on the same assay plate. If the maximal response to a compound was not
reached, the EC50 value could not be determined and is expressed as an estimation at > 0.01 M. For all agonists,
the activity on cCaSR is described in a separate column: + : EC50 equal or above to 0.1 M, ++: EC50 below 0.1,
+++: EC50 below 0.001. The compounds are grouped by different classes. 1–7: Cations, 8–39: Amino acids and
derivatives, 40–42: Polybasic peptides, 43–47: GSH and derivatives, 48–50: Biogenic amines, 51–54: β-aspartyl
peptides, 55–73: γ-glutamyl peptides, 74–80: Aminoglycoside antibiotics, 81–84: Sugars and derivatives, 85:
1,4,8,11-tetraazacyclotetradecane, 86–92: Organic acids.
Scientific Reports | (2021) 11:10527 | https://doi.org/10.1038/s41598-021-89558-w 7
Vol.:(0123456789)www.nature.com/scientificreports/
Figure 5. Heat map generated with CaSR agonists, classed according to their affinity for cCaSR. The
Compounds with higher affinities (low µM range) appear in bright red, compounds with medium affinity
in different hues of orange (mid to high µM range), and finally the compounds with lower affinities with the
receptor are colored in green (mM range).
GSH, but not CaCl2 and MgCl2, exhibit kokumi effect for a human sensory panel. In order to
compare the cat in vivo response to humans, we assessed the same three compounds with a human sensory panel
using assessors validated in line with ISO 8586:2012(E). Panellists were presented with each compound through
Scientific Reports | (2021) 11:10527 | https://doi.org/10.1038/s41598-021-89558-w 8
Vol:.(1234567890)www.nature.com/scientificreports/
a series of triangle tests. We prepared CaCl2, MgCl2 and GSH each in two different solutions; mineral water,
and in an umami/ salt synthetic mix (1.18 mM MSG, 0.57 mM IMP and 119.7 mM NaCl) that was used to test
kokumi taste with γ-glutamyl peptides previously8.
The panellists were able to detect CaCl2 in the water solution (% correct = 56%) (Fig. 7b). The most common
descriptor used to describe CaCl2 in water was bitter, consistent with previous studies with CaCl2 on human taste
panels35. The panellists were unable to detect CaCl2 in the synthetic umami and salty mixture (% correct = 36%),
and indeed only 2/ 24 panellists used the word bitter to describe the solution they were testing.
The panellists were unable to significantly distinguish between the control and the samples containing MgCl2
in both solutions (% correct = 50% for both) (Fig. 7b), with 4/ 24 panellists describing the sample as bitter or
salty when compared in blank water.
Finally, panellists were unable to taste GSH when mixed with water (% correct = 37.5%), but did significantly
distinguish it in an umami mixture (% correct = 58.3%) (Fig. 7b).
Discussion
There are some striking interspecies differences in taste perception, including in sweet, umami, and bitter
taste21,34,36,37. One hypothesis to explain some of these differences, is that specialisation in the diets of species
exerts differential selective pressure on their taste m odalities38. Indeed, cats do not detect sweet taste due to the
21
pseudogenisation of their T1R2 r eceptor , while their umami receptor has a much wider specificity than, for
example, the human receptor, and is capable of detecting a large number of amino acids34,39. As obligate carni-
vores, cats do not encounter many sweet compounds in their natural diet, however, detecting the presence of
proteins and amino acids would be p aramount36.
To our knowledge, no such comparisons have been conducted for kokumi taste between species from differ-
ent dietary groups. Kokumi taste has been investigated in mice and h umans8,10,25, both omnivores, and found to
enhance the taste of peptides and amino acids. Therefore, we used phylogenetics, molecular modelling, in vitro
activation, and in vivo sensory studies to compare kokumi taste perception in cat, as a strict carnivore, with
humans. First, we confirmed that CaSR is expressed in cat taste tissue, specifically in the CV papillae on cat
tongue (Fig. 1). Using sequence alignment and homology modelling, we found that cCaSR is very closely related
to hCaSR from a structural perspective, and CaSR is highly-conserved between mammals overall (Fig. 2). Sur-
prisingly, our in vitro data for cCaSR showed some differences in affinities and binding profiles when compared
to human d ata8,10,25,28. However, further investigation with hCaSR in our cell system gave largely equivalent data
to cCaSR, indicating that discrepancies with published data were due to differences in assay systems. We then
proceeded to compare cat and human in vivo responses to CaSR agonists and kokumi compounds. Although
the results from the in vitro assays showed identical agonist activity between hCaSR and cCaSR, we found that
there were some differences in the in vivo responses between the two species, suggesting that there are more
parameters to take into account with kokumi, than just the agonists used.
The phylogenetic tree (Fig. 2a) we generated for CaSR in mammals, as well as the multiple sequence alignment
(Supplementary Data), indicated there is a high similarity between all the compared species, and we did not see
any evidence of pseudogenisation of the receptor, on the contrary to the sweet taste receptor21. Since there did
not seem to be any significant differences in the cat sequence when compared with the other mammalian species,
we concluded that cats are an appropriate model species for carnivores.
In the residues that directly bind c alcium20, aligned for human and cat CaSR, only one residue differs between
the two species: residue 91 is a Leucine for human and Methionine for cat (Fig. 2b). When we looked at a more
broad analysis of the sequence alignment we generated for the phylogenetic tree, we found that this residue is
either a Methionine or a Leucine for all of the species. Leucine is most common for primates, and a few small
mammals (Supplementary Fig. 1), whereas Methionine is not specific to any class of animals. Additionally,
Methionine and Leucine are both hydrophobic residues of similar s ize40, and this difference does not affect
the EC50 values measured for calcium (Fig. 6). Overall, our homology model of cCaSR confirms that the high
sequence identity between cCaSR and hCaSR also translates into near identical 3D structure of the NTD of the
two species (Fig. 3).
There is no aspect of the structural analysis that would suggest there is an important difference in kokumi
perception between omnivores and carnivores. Calcium homeostasis is a vital function for all species, a pressure
that may maintain a highly-conserved structure. Indeed, sensory receptors that have the most constraint, from
an evolutionary point of view, are typically expressed in additional tissues and cell types, and may regulate non-
redundant, critical physiological processes. This has previously been shown with specific olfactory r eceptors41.
From the alignment and structural analysis completed, we expected that the ligand binding properties of
cCaSR would be very close to that of hCaSR and we screened a large library of compounds from different classes
(Table 1). Most of the best binding compounds for cCaSR are not readily found in foods, such as antibiotics,
cyclam or rare cations. They are more relevant for the understanding of CaSR function outside the taste s ystem14,
and their reported E C50 values we have found for c CaSR15,27,30.
C50 values with hCaSR are relatively close to the E
As these compounds would most likely be implicated in molecular functions related to calcium homeostasis
and the other physiological functions of CaSR besides kokumi taste, we would expect their binding to be more
conserved than the compounds that are only taste-active and don’t exert any other function on the receptor.
Of the potential kokumi-tasting compounds, some of the γ-glutamyl peptides, calcium, and the biogenic
amine spermidine exhibited the lowest EC50 values for cCaSR. The formation of γ-glutamyl peptides is linked to
GSH metabolism, and both γ-glutamyl peptides and GSH are found in different m eats32,33, meaning that these
compounds are present in a carnivorous diet. Similarly, spermidine, which is a biogenic amine, is found in food
sources palatable to cats, including chicken liver42. Even the less-active compounds, for example GSH, had an
affinity for cCaSR close to the concentration that it is found in specific meats32. Indeed, in combination with
Scientific Reports | (2021) 11:10527 | https://doi.org/10.1038/s41598-021-89558-w 9
Vol.:(0123456789)www.nature.com/scientificreports/
a)
b)
cCaSR cCaSR
hCaSR cCaSR hCaSR cCaSR
No Compound stable No Compound stable
EC50(mM) EC50(mM) EC50(mM) EC50(mM)
EC50(mM) EC50(mM)
1 Ca2+ 0.80 1.15 1.47 14 Cadaverine n.d. n.d. n.d.
2 Mg2+ 3.9 8.6 >3 15 Putrescine >3 >3 >3
3 L-Asp 11.9 11.8 12.0 16 Poly-L-Arg 2.5 ug/ml 2.9 ug/ml 8.0 ug/ml
4 L-Glu >3 >3 >3 17 Glutathione >3 >3 >3
5 L-Phe n.d. n.d. n.d. 18 γ-Glu-Val-Gly 4.1 3.6 6.9
6 L-Trp n.d. n.d. n.d. 19 γ-Glu-Val >3 >3 >3
7 L-Tyr n.d. n.d. n.d. 20 γ-Glu-Abu-Gly >3 >3 >3
8 L-Gln n.d. n.d. n.d. 21 γ-Glu-Ala >3 >3 >3
9 L-Arg n.d. n.d. n.d. 22 γ-Glu-Cys n.d. n.d. n.d.
10 L-Lys n.d. n.d. n.d. 23 Gene
cin 3.6 3.0 1.1
11 L-His n.d. n.d. n.d. 24 Neomycin 0.06 0.06 0.02
12 Spermine 0.2 0.18 0.21 25 Tobramycin 0.16 0.28 0.04
13 Spermidine 1.3 1.1 2.3
Scientific Reports | (2021) 11:10527 | https://doi.org/10.1038/s41598-021-89558-w 10
Vol:.(1234567890)www.nature.com/scientificreports/
◂Figure 6. Both hCaSR and cCaSR bind agonists with similar affinities when expressed in the same cellular
system (a). The EC50 values calculated for all the constructs are within similar ranges (b). (a) For each ligand the
response of transiently expressed hCaSR (red square) and cCaSR (green triangle) and stably expressed cCaSR
(purple triangle) were measured in response to increasing doses of the ligand. The maximal response used to
calculate the % of maximal response was measured with CaCl2 at 30 mM. The measurements were made with
luminescence, and each point was repeated in two independent measurements, and is represented with ± SEM.
In each case, the measurements were made in parallel with cells containing the corresponding CaSR vectors, and
cells containing a mock vector (blue circle) to confirm specificity of response. (b) All EC50 values are expressed
in mM, except for poly-L-arginine which is expressed in µg/ml. All measurements were repeated over at least
three wells on the same assay plate. If the maximal response to a compound was not reached, the E C50 value
could not be determined and is expressed as an estimation at > 3 mM.
umami-active compounds such as L-amino acids, these compounds could elicit a strong positive taste response,
consistent with cats’ strictly carnivorous diet.
When comparing the binding of the selected ligands measured for cCaSR with those previously published for
hCaSR8,10,25, we found significant differences. However, when we expressed hCaSR and cCaSR in the same cellular
system, the ligand binding properties of the receptors were near identical (Fig. 6). Contradictory reports on the
ligand binding profile of CaSR have been published previously31,43,44. Thus, it is possible that CaSR is particularly
sensitive to the heterologous expression system or methodology used to measure ligand binding. Comparisons
between different studies should therefore be interpreted with caution.
Having concluded that the in vitro ligand binding between the two species is near identical, we designed two
simple experiments to assess whether CaSR agonists also elicited the same kokumi taste response in cats and
humans. CaCl2 elicited a clear kokumi-type response in cats, with no taste response to the compound in water
alone, but a significant preference for it in an umami mix (Fig. 7a)34. For the human panel, we asked them to
differentiate between a triad of solutions in a triangle test, in which they were presented with solution blanks
and the same CaSR agonists as the cats (Fig. 7b). In contrast, C aCl2 is not a kokumi compound in humans, and
although the human panel was able to significantly distinguish between plain water and the water solution of
CaCl2, as expected they did not differentiate when CaCl2 was added into the synthetic umami mix (Fig. 7b). The
umami mixes used for cats and humans were different, simply due to the fact that the human and cat umami
receptors are activated by different ligands34. The cat umami mix contained 15 mM L-Phe, 15 mM L-His and
15 mM L-Trp, whereas the human synthetic umami mix was composed of 1.18 mM MSG, 0.57 mM IMP and
119.7 mM NaCl, as described previously with γ-glutamyl p eptides8. Interestingly, the three cat umami-active
amino acids are reported to activate hCaSR-expressing cells, in the presence of Ca2+ 28. We have previously shown
that these amino acids elicit a typical umami response in vivo with the c ats34. If these amino acids are also able
to further activate the cCaSR in the presence of C a2+, then the cats’ preference for the umami mix solution plus
CaCl2 may also be partially due to this PAM effect.
However, the opposite of CaCl2 is true of GSH, which demonstrated a robust kokumi effect in our human
panel, but was mildly aversive to cats both in water and in an umami-mixture (Fig. 7). Given the near identi-
cal ligand-activation profiles of CaSR in vitro, what underlies this apparent difference in kokumi taste between
cats and humans? We consider there to be three potential explanations. It is possible that CaSR does not in fact
mediate kokumi taste in cats despite being expressed in taste papillae. However, we consider it unlikely that
the kokumi taste perception would arise twice in mammalian evolution when all other taste modalities appear
to share a common molecular origin. It is also possible that methodological differences in the human and cat
in vivo assays underlie the differences in kokumi taste reported here. Unlike in humans, training cats to signal
taste discrimination in a forced choice test is challenging and risks a strong inherent preference bias. We instead
exploited the fact that kokumi enhances umami taste, to measure preference in cats. While imperfect for inter-
species comparison, we chose methodologies that are the most sensitive for each species. Instead, we propose
that the most likely explanation for observed differences in kokumi taste between species is precisely because
it functions as a synergistic taste modality: CaSR ligands frequently activate other taste receptors. MgCl2, for
example, is an agonist of human bitter receptor T 2R745. This receptor is also expressed and functional in c ats36.
Our human panel was unable to detect MgCl2 at the concentration it was used, in accordance with previously
published detection t hresholds35. However, cats had a significant aversion both in plain water and in the umami
amino acid mix (Fig. 7a), consistent with a bitter taste response46.
Similarly, the GSH solution tested was acidic (pH 3.48 for GSH at 2.5 mM). Humans sometimes describe its
taste as slightly sour when concentrated enough, but overall it is tasteless in a water solution, confirmed by our
sensory panel, which was unable to detect the GSH sample from the water blanks. Cats are particularly averse to
sour-tasting compounds47 and this may explain their rejection of GSH in water, which is sufficiently strong such
that any kokumi effect is mitigated. It is possible that in meat, where GSH is present at concentrations that can
activate the c CaSR32, it could still be perceived as a kokumi compound since it would be present in a buffered pH
environment with a mix of umami-active compounds. Finally, the cat umami receptor is much more broadly-
tuned than the human umami taste receptor34, therefore the kokumi enhancement of umami taste may appear
different in the presence of the same amino acid mix between the two species.
We conclude from these experiments that, despite the high conservation of the CaSR receptors, it is evident
that there are some additional differences between how omnivorous and carnivorous mammals detect kokumi
taste. This would suggest kokumi taste is among the more complex taste modalities. In this work we showed that
a model carnivorous species and omnivorous species have very similar CaSR from a sequence and molecular
structure perspective, as well as from the receptor binding point of view, but there are some important differ-
ences in the perception of kokumi taste between the species studied here. We hypothesise that this difference
Scientific Reports | (2021) 11:10527 | https://doi.org/10.1038/s41598-021-89558-w 11
Vol.:(0123456789)www.nature.com/scientificreports/
Figure 7. In vivo response of cats to three cCaSR agonists, CaCl2, MgCl2 and GSH, measured on a water panel
in water and umami mix (15 mM L-Phe, 15 mM L-His and 15 mM L-Trp) (a). Human sensory panel evaluation
of three compounds, CaCl2, MgCl2 and GSH, measured in Water and Umami Mix (1.18 mM MSG, 0.57 mM
IMP and 119.7 mM NaCl) (b). (a) The cats did not significantly differentiate between water and CaCl2 (dark
purple dots) at 8 mM, and there was no significant difference in intake (P = 0.3848). However, with the umami
amino acid mix, the cats showed significant (P = 0.0039) preference to the mix that was supplemented with
CaCl2 (light purple dots). The cats rejected the MgCl2 (dark blue dots) solution in comparison to pure water,
and had a significantly lower intake of the MgCl2 solution (P = 0.0023). Similarly, the cats also significantly
rejected the amino acid mixture containing MgCl2 (light blue dots) when compared to the amino acid mixture
on its own (P = 0.0009). Finally, the cats significantly rejected the GSH solution (dark yellow dots) and had a
lower intake for it when compared to pure water (P = 0.0002), and they had no significant preference to the
amino acid mixture supplemented with GSH (light yellow dots) compared to the amino acid mixture on its own
(P = 0.0630). n = 24 for all tests. For each compound, the test was repeated on two separate days, while switching
the sides of the drinkers to account for side bias. (b) The assessors significantly differentiated CaCl2 in water
(dark purple bar), but did not find any difference with the solutions proposed containing the synthetic umami
mixture (light purple bar). The assessors did not differentiate the MgCl2 solutions significantly in either of the
solutions proposed, water (dark blue bar) or the umami mix (light blue bar). The assessors did not significantly
differentiate the GSH solubilised in water when compared with the blank (dark yellow bar), however they
did differentiate it in the synthetic umami mix (light yellow bar). For each test, statistical significance was
determined by a p-value ≤ 0.05 and n = 24 for all tests, except for M gCl2 in water and umami mix where n = 25.
Scientific Reports | (2021) 11:10527 | https://doi.org/10.1038/s41598-021-89558-w 12
Vol:.(1234567890)www.nature.com/scientificreports/
comes from the inherent difference in other taste modalities between the species, as well as the differences in
their diets, and that the CaSR is very highly-conserved because of its physiological importance in other functions
besides kokumi taste perception.
Materials and methods
Tissue preparation and RT‑PCR. In order to confirm the expression of CaSR in the taste papillae of the
cat, RT-PCR was conducted for CaSR with Glyceraldehyde 3-phosphate dehydrogenase (GAPDH), a ubiquitous
enzyme found in most tissues, used as a control for non-taste tissue. The tissue was provided through a col-
laboration with the University of Veterinary Medicine in Hannover, Germany. Tissue samples from a six year
old male cat were taken after euthanasia due to an inability of the cat to urinate. The cat was a client-owned
cat, and permission to retrieve the samples was obtained prior to this work. An area of tongue epithelial tissue
containing one circumvallate (CV) papilla was used for total RNA extraction along with a section containing no
visible taste papillae. RNA was extracted using the RNeasy Plus Mini Kit (Qiagen, Germany) according to the
manufacturer’s instructions. cDNA synthesis was performed with the Superscript III First Strand cDNA Synthe-
sis Kit (Thermo Fisher Scientific, UK) with random primer based priming. The intron spanning primers used
were as follows, CaSR, 5’-GCTGCTTTGAGTGTGTGGAA-3’ (forward) and 5’-ACCTCCTCGATGGTGTTA
CG-3’ (reverse); GAPDH 5’-GTGAAGGTCGGAGTCAACGG-3’ (forward) and 5’-ACCATAAGGTCCACC
ACCCG-3’ (reverse). For PCR, 25µL reactions were prepared with JumpStartTaq ReadyMix (Sigma-Aldrich,
UK) according to the manufacturer’s instructions. PCR was performed with an initial denaturation step of 94 °C
for 2 min, followed by 35 cycles of denaturation at 94 °C for 30 s, annealing at 57 °C for 30 s and extension at
74 °C for 2 min. A final elongation step at 72 °C for 5 min was performed before the reactions were held at 4 °C
until they were stored at − 20 °C. Reaction products were run on a 1% agarose gel with post-staining in GelRed
(Biotium, USA).
Phylogenetic trees. The CaSR amino acid sequence (ENSFCAG00000008717) was taken from the domes-
tic cat (Felis catus) Ensembl reference genome (FelCat9.0), and all orthologs were selected (Ensembl release
98, accessed in September 2019). The CaSR orthologs were filtered to remove sequences with < 60% identity
compared with the cCaSR sequence, and to only keep sequences that were 1-to-1 matches from mammalian
species. The associated taxonomic strings were taken from the NCBI Taxonomy Database48 using ETE 349. Next,
newick trees were created from the filtered ortholog sequences using FastTree 2.1.11 with the -wag option for
the WAG + CAT model and -gamma option for rescaling of branch lengths and computing a Gamma20-based
likelihood50. The newick trees were then visualised using iTOL (version 5.5)51.
Functional expression of cCaSR and hCaSR. CaSR agonist preparation. All tested compounds were
purchased as the purest form available from various chemical suppliers. All compounds were either directly
dissolved in Calcium-free Tyrode’s buffer (130 mM NaCl, 5 mM KCl, 1 mM MgCl2, 5 mM N aHCO3, 20 mM
HEPES; pH 7.4 sterile filtered and autoclaved), or in a mixture of Calcium-free Tyrode’s and DMSO, not exceed-
ing a final DMSO concentration of 0.5% (v/ v) to avoid any toxic effects on transfected cells.
Cloning of cCaSR in expression vector. The coding sequence of the Felis catus52 and Homo sapiens53 CaSR gene
was synthesised by GeneArt (Thermo Fisher Scientific). The cat coding sequence was excised from the GeneArt
construct and inserted in pcDNA3.1 for constitutive and transient expression or pcDNA5/ TO for inducible
expression. For the human sequence the pcDNA6 vector as delivered by GeneArt was used without further sub-
cloning. After restriction analysis for the screening of positive constructs, a clone with correct DNA fragmenta-
tion was selected and confirmed by sequencing the whole coding region (data not shown).
Stable transfection of cCaSR in HEK cells. The cCaSR expression constructs were stably-transfected in the
mammalian cell line, HEK293/ T-REx/ natClytin. Transfections were performed by electroporation, following
standard methodologies. Stably-transfected target and mock pools were obtained after 2–3 weeks of antibiotic
selection, and clones were selected for testing. In order to evaluate the activity of each clone, 10 mM Calcium was
injected onto the cells and the resulting luminescence was measured. The HEK293/ T-REx/ natClytin-cCaSR
clone pool analysis showed dozens of high-responding clones in cCaSR-expressing cells. Mock cells were ana-
lysed identically to the cCaSR cells, and no responses were obtained.
Transient transfection of HEK cells with hCaSR and cCaSR. The hCaSR and cCaSR expression constructs for
transient expression were transfected in the mammalian cell line, HEK293/ natClytin. All transient transfections
were performed with Lipofectamine 2000 (Invitrogen) according to the manufacturer’s protocol.
Luminescence assays on transient and stable constructs cCaSR and hCaSR. All compounds screened on the
receptor were analysed in parallel with Calcium, on the HEK293/ T-REx/ natClytin-cCaSR or hCaSR stable or
transient cell lines. Prior to the measurements, the cells were incubated with 10 µM of photoprotein substrate,
Coelenterazine, prepared in Calcium-free Tyrode’s buffer at 37 °C for 3–4 h. All the data was captured using a
FLIPR Tetra (Molecular Devices). A single or double injection protocol was used to capture the data for potential
agonists and PAMs, respectively. The compounds tested were all prepared at desired concentration in Calcium-
Free Tyrode’s buffer supplemented with 0.5% DMSO. For the activity determination of potential agonists, the
single injection protocol was used, with C
aCl2 as the positive control for each run. Each compound was injected
into specific wells and the luminescence signal was measured for 1 min. for each compound. For potential PAMs,
Scientific Reports | (2021) 11:10527 | https://doi.org/10.1038/s41598-021-89558-w 13
Vol.:(0123456789)www.nature.com/scientificreports/
the double injection protocol was used. The first injection was identical to the one described above for poten-
tial agonists. A 20 min. resting period followed the first injection and a second injection of 0.5 mM C aCl2 in
Calcium-free Tyrode’s buffer was injected to all wells, and the resulting luminescence signal was again measured
for 1 min for each compound.
Data analysis. Dose–response curves were established by plotting signal amplitudes versus agonist concentra-
tion. For each compound, the % of maximum response was determined using a standard formula as follows:
The half maximal effective concentrations ( EC50) were identified by nonlinear regression using a variable slope
model with the equation Y = Bottom + (X^Hillslope)*(Top–Bottom)/ (X^HillSlope + EC50^HillSlope), where Y
is the agonist concentration, Top and Bottom are the plateaus in the same units as Y and HillSlope is the Slope
factor or Hill slope. All calculations and plots were done using GraphPad Prism 8. Several tested compounds
elicited a cellular response only at 1 or 2 concentrations and not reaching a plateau, preventing us from using
the above equation to calculate an E C50 value for these ligands. In these cases the EC50 was noted as being higher
than the maximum concentration used in the assay.
In silico modelling of the cat CaSR. The Protein Data Base (PDB) contains several structures of the
human CaSR NTD, co-crystalised with C a2+, Mg2+, and small molecular agonists, such as L-Trp derivative
L-1,2,3,4-tetrahydronorharman-3-carboxylic acid (5FBK, 5FBH, 5K5T, and 5K5S)20,27.
These structures were used as the templates for our homology model of cCaSR constructed using the Model-
ler software, which includes both the sequence alignments and the building of the homology model (Discovery
Studio- BIOVIA, Dassault Systèmes)54. Indeed, cCaSR has a high (> 95%) sequence identity to hCaSR with no
discernible difference within the active sites of the lobes of NTD and in the vicinity of the binding sites of Ca2+
and Mg2+ ions. Ligands were docked into the model by using the program BioDock55. The resulting complexes
were subjected to energy minimisation using the Gromacs software p ackage56. Finally, the docking results were
ranked manually, by energetic criteria that include hydrogen bonding, charged and hydrophobic interactions
using CHARMM force fields57. The binding of the ligands exploited multiple electrostatic and polar interactions
of the CaSR NTD binding site (Fig. 3). The placement of the amine groups of the amino acids within the hinge
region of the cCaSR NTD followed the positioning of the amine groups to other structures of Group C GPCR’s
and is similar to the binding of the tryptophan derivative to the hCaSR in the 5FBK structure (Fig. 3). The
best-ranking compounds, conjectured to be active, were experimentally tested using the in vitro cellular assay.
The experimental results guided the refinement of the model towards energetically-favourable amino acid
positions for ligand binding. The cCaSR model was iteratively improved, i.e., we first screened a number of
compounds to test our hypothesis and then modelled the collected in vitro data to refine the binding model
(Fig. 3). The initial models may have had the positioning of the loops and amino acids unresolved, and the
experimental results from the in vitro work helped improve the models. The refinement of the models mostly
involved the adjustment of sidechain rotamers. Discovery Studio and Gromacs software packages were used for
model refinement.
Taste choice tests with CaSR agonists using cat water panel testing. Animals. Healthy neutered
adult domestic short hair cats (Felis catus) formed the panel for all the choice tests described here (n = 24). All
24 cats in the panel had previously been habituated and screened to prove suitability to perform this type of
experiment. The cats had an average weight of 4.4 kg, average age of 4.8 years, and the panel was composed of
13–15 female and 11–9 male cats during the experiments. All the cats taking part in the panel were individu-
ally fed dry adult cat food twice per day to their individual Maintenance Energy Requirements (MER). On test
days, the cats were housed during 18 h overnight in purpose-built, behaviourally-enriched lodges58. During
the 18 h exposure, the cats only had access to the water solutions in the two-bottle testing apparatus, however
they had free access to drinking water for the rest of the day when they were housed in a social group within an
environmentally enriched room. All accommodation complied with the Code of Practice for Animal (Scientific
Procedures) Act 1986.
Taste stimuli. All solutions were made with deionised water (Purite, UK). All taste-active substances were
food-grade or of the highest available purity. In some cases, salts were purchased instead of the pure compound
due to solubility, stability or availability reasons.
Experimental protocol. The in vivo testing was a two-bottle choice test and the methodology was adapted
from23. All animal studies were in alignment with the Mars Animal Research Policy (Mars.com). These stud-
ies follow the 3Rs approach to experimentation with animals in scientific research59 and were approved by the
Waltham Animal Welfare and Ethical Review Board, and all the methods were carried-out in accordance with
local guidelines and regulations, including the ARRIVE guidelines60. On a given test day, the animals were
placed in their individual lodges where they were offered two bottles containing 350 ml of solution each. The
drinkers contained the test solution or the control solution, and the position of the drinkers presented to the cats
was changed every day to control for any side bias, and each solution was offered twice to each cat. The cats were
also offered at the same time as the water solutions, 50% of their daily food allowance. After 30 min. the food was
removed and the cats were left in their individual lodges overnight, with access to the drinkers for 18 h. The next
day the drinkers were weighed, and the remaining quantities were recorded as refused amounts. Total intakes
were calculated using the difference of the offered and refused amounts. A correction for evaporation and any
solution spillage was also performed on each data point.
Scientific Reports | (2021) 11:10527 | https://doi.org/10.1038/s41598-021-89558-w 14
Vol:.(1234567890)You can also read