Genetic variability and conservation of the endangered Pannonian root vole in fragmented habitats of an agricultural landscape - Nature Conservation
←
→
Page content transcription
If your browser does not render page correctly, please read the page content below
A peer-reviewed open-access journal
Nature Conservation 43: 167–191 (2021)
doi: 10.3897/natureconservation.43.58798                  RESEARCH ARTICLE
https://natureconservation.pensoft.net                                                                      Launched to accelerate biodiversity conservation

            Genetic variability and conservation of the
          endangered Pannonian root vole in fragmented
               habitats of an agricultural landscape

                          Krisztina A. Kelemen1, Felicita Urzi2, Elena Buzan2,4,
                               Győző F. Horváth1, Filip Tulis3, Ivan Baláž3

1 University of Pécs, Faculty of Sciences, Ifjúság str. 6, H-7624 Pécs, Hungary 2 University of Primorska,
Faculty of Mathematics, Natural Sciences and Information Technologies, Glagoljaška 8, 6000 Koper, Slovenia
3 Constantine the Philosopher University in Nitra, Faculty of Natural Sciences, Tr. A. Hlinku 1, 949 74 Nitra,
Slovakia 4 Environmental Protection College, Trg mladosti 7, 3320 Velenje, Slovenia

Corresponding author: Elena Buzan (elena.buzan@upr.si)

Academic editor: S. Lengyel | Received 18 September 2020 | Accepted 5 March 2021 | Published 7 May 2021

                                 http://zoobank.org/78BAC66E-1EA7-4A5E-AF1E-D3E690E228C0

Citation: Kelemen KA, Urzi F, Buzan E, Horváth GF, Tulis F, Baláž I (2021) Genetic variability and conservation
of the endangered Pannonian root vole in fragmented habitats of an agricultural landscape. Nature Conservation 43:
167–191. https://doi.org/10.3897/natureconservation.43.58798

Abstract
The distribution of the endangered glacial relict subspecies, the Pannonian root vole Alexandromys oecono-
mus mehelyi Éhik, 1928, is restricted to scattered localities in south-western Slovakia, which belong to the
north-eastern zone of its range. Human-induced changes and fragmentation of the landscape have led to
the gradual loss of suitable habitats and threaten its long-term survival. The study area in the Danubian
Lowland is characterised by small habitat fragments and temporal fluctuations of the habitat area. Root
voles were sampled at nine sites to study the level of genetic variability and structure of local subpopula-
tions by scoring 13 microsatellite loci in 69 individuals. Genetic differentiation varied amongst local
populations and we did not find a significant isolation-by-distance pattern. Bayesian clustering analysis
suggested that dispersal effectively prevents marked genetic subdivision between studied habitat frag-
ments. Significant pairwise differentiation between some subpopulations, however, may be the result of
putatively suppressed gene flow. Low genetic diversity in the recent populations probably reflects the iso-
lated location of the study area in the agricultural landscape, suggesting that long-term survival may not
be assured. In order to maintain genetic diversity, it is essential to preserve (or even restore) habitats and
ensure the possibility of gene flow; habitat protection is, therefore, recommended. Continuous assessment
is necessary for effective conservation management and to predict the long-term survival chances of the
Pannonian root vole in the study area.

Copyright Krisztina A. Kelemen et al. This is an open access article distributed under the terms of the Creative Commons Attribution License
(CC BY 4.0), which permits unrestricted use, distribution, and reproduction in any medium, provided the original author and source are credited.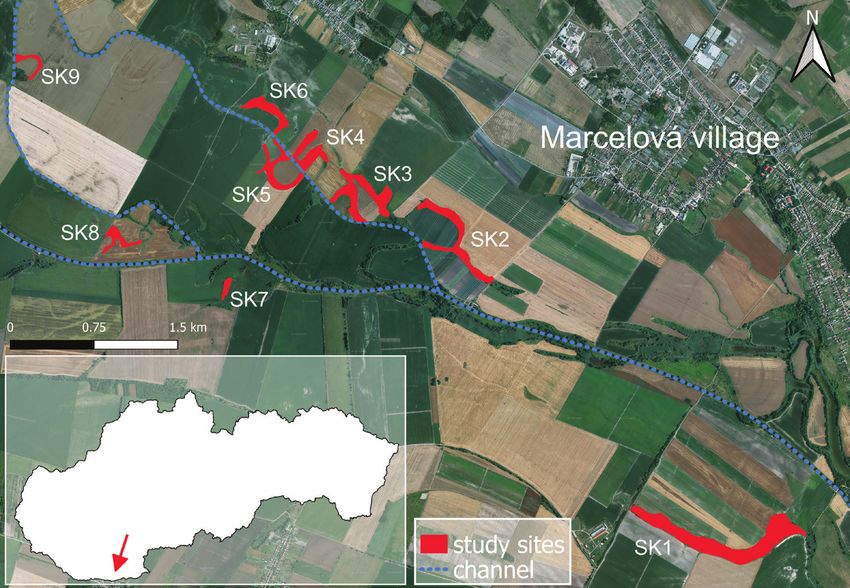
168            Krisztina A. Kelemen et al. / Nature Conservation 43: 167–191 (2021)

Keywords
Alexandromys oeconomus mehelyi, Danubian Lowland, landscape change, microsatellite analysis

Introduction

The root vole Alexandromys (Microtus) oeconomus (Pallas, 1776) is the only extant Hol-
arctic species of the Microtini tribe with twenty-five known subspecies distributed in
the Northern Hemisphere (Pardiñas et al. 2017). The widespread species is categorised
as ‘Least Concern’ in the IUCN Red List of Threatened Species (Linzey et al. 2016).
     As a result of glacial and postglacial changes in its distribution range, the root vole
is currently represented by three subspecies in Western and Central Europe (Musser and
Carleton 2005; Pardiñas et al. 2017), A. oeconomus stimmingi (Nehring, 1899) (Nehring
1899), A. oeconomus arenicola (de Sélys-Longchamps, 1841) (de Sélys-Longchamps
1841) and A. oeconomus mehelyi Éhik, 1928 (Éhik 1928), all of which belong to the
Central European phylogroup (Brunhoff et al. 2003). As a protected species of the Euro-
pean fauna, the root vole is included in Appendix III of the Bern Convention (Council
of Europe 1982). Two subspecies, A. o. mehelyi and A. o. arenicola, are endangered and
need a feasible conservation action plan with special management strategy to maintain
populations (Pardiñas et al. 2017). The Pannonian root vole A. o. mehelyi, an isolated
subspecies present in the Carpathian Basin, occurs in the southern part of Slovakia in the
Danubian Lowland (Miklós et al. 2014; Ambros et al. 2016), locally in north-eastern
Austria (Thissen et al. 2015a) and in some isolated localities in Hungary (Horváth and
Herczeg 2013; Lanszki et al. 2015; Kalmár and Riezing 2017). This subspecies is consid-
ered to be a glacial relict in Central-Europe (Brunhoff et al. 2003) with populations in-
habiting refugial areas including freshwater marshes, swamps, floodplains or watersides
(Baláž and Fraňová 2013; Kalmár and Riezing 2017). Based on intensive research in the
past, all studies defined the suitable habitats of the Pannonian root vole as wet sites with
dense vegetation cover, typically dominated by sedge (Carex sp.) or hummocks of sedge
and common reed (Phragmites australis) mosaics (Kratochvíl and Rosický 1955; Stoll-
mann and Ambros 1998; Hulejová Sládkovičová et al. 2016). Due to its special habitat
requirements and rarity, apart from some larger known populations, it is common that
merely one or a few specimens are found sporadically or only indirect evidence indicates
its occurrence (Miklós et al. 2011; Purger 2014; Thissen et al. 2015a, b). The subspe-
cies is sensitive and exhibits rapid response to natural and anthropogenic disturbances,
especially to their additive effects and it was shown that individuals could cross barriers
to reach suitable areas (Horváth and Herczeg 2013). Habitat loss, fragmentation and
degradation due to changes in land-use, like drainage or mowing, are amongst the well-
known risk factors that threaten the Panonian root vole (Thissen et al. 2015a; Gubányi
et al. 2009). As this rare, habitat specialist subspecies is present exclusively in scattered
populations in these remnant habitats, it appears amongst the priority species of com-
munities in Annexes II and IV of the Habitats Directive (European Commission 1992).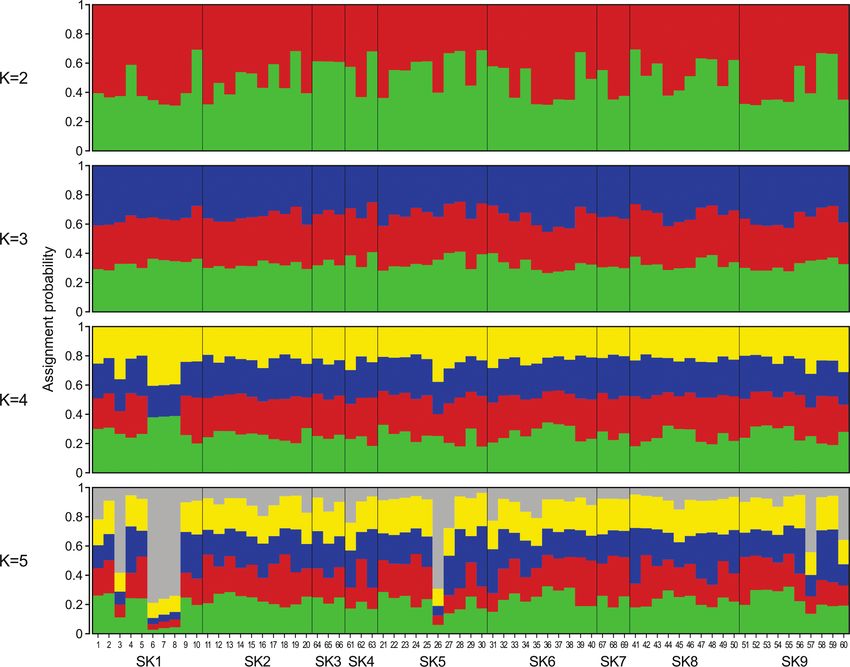
Genetic variability and conservation of the Pannonian root vole           169

     The distribution of Pannonian root vole in the territory of Slovakia is determined
by the change of the landscape and its natural conditions in the postglacial era. Over
the past 130 years, the Danubian Lowland in southern Slovakia has experienced sig-
nificant landscape modifications, such as extensive flood protection interventions and
construction of a channel network in agricultural lands. As a consequence, habitats
preferred by the root vole are currently fragmented and isolated by agricultural lands
in southern Slovakia (Ambros et al. 2016). Furthermore, flooding events, the oscilla-
tion of ground water level and dry periods have a substantial effect on the connectivity
between remnant patches of suitable habitat, determining gene flow amongst them.
Landscape fragmentation and loss of habitats represent a significant risk factor in the
Danubian Lowland for this rare subspecies which occurs only in scattered populations
in south-western Slovakia, thus, the Pannonian root vole is strictly protected in the
country (Miklós et al. 2014; Ambros et al. 2016).
     Habitat loss and fragmentation caused by landscape modification affect wildlife
populations worldwide (Wilson et al. 2016). The negative impact of edge effects, high-
er sensitivity to environmental and demographic stochasticity and the change of dif-
ferent characteristics of small, fragmented populations in reduced habitats may lead to
increased risk of local extinction (Willi and Hoffmann 2009). Simultaneously, as the
isolation of remnant patches becomes larger, dispersal and thus gene flow amongst lo-
cal populations may become hampered (Storfer et al. 2010). Consequently, subdivided
and isolated populations undergo changes in their genetic structure and variability
(Lino et al. 2019).
     The response of small mammalian populations to habitat fragmentation has been
widely studied (e.g. Kozakiewicz et al. 1999; Mortelliti et al. 2010). Wetland and
marshland associated species are particularly threatened by the negative effects of frag-
mentation (Rushton et al. 2000; Pita et al. 2010), as the available habitats are already
fragmented and isolated to varying degrees as a result of human activities, such as
infrastructure development, water management or agricultural drainage (Čížková et al.
2013). The consequences of habitat fragmentation on genetic diversity in subdivided
small mammal populations have been in the focus of comprehensive research (e.g.
Gaines et al. 1997; Fietz et al. 2014). A number of papers aimed to study Microtine ro-
dents as appropriate model organisms (Redeker et al. 2006; Marchi et al. 2013) in the
investigation of habitat fragmentation which poses substantial threat to endemic and
relict vole species or subspecies that are especially sensitive to its negative effects (Buzan
et al. 2010; Pita et al. 2014). Rare species and subspecies, including voles inhabiting
wetlands, have been the subject of studies that investigated the genetic characteristics
of populations occurring in fragmented or isolated habitats in the Nearctic (List et al.
2010; Neuwald 2010; Parmenter et al. 2015) and Palearctic regions (Van De Zande et
al. 2000; Telfer et al. 2003; Centeno-Cuadros et al. 2011) and, based on the levels of
genetic diversity and revealed genetic patterns, many authors stressed implications or
proposed measures for conservation.
     To ensure the viability of root vole populations or subpopulations, it is reasonable
to study genetic variability and genetic structure as factors affecting the adaptive traits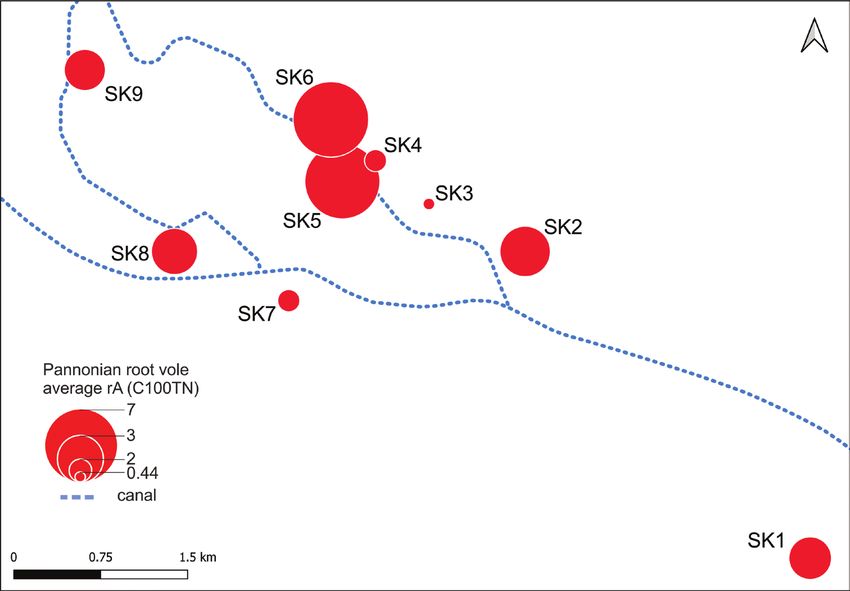
170 Krisztina A. Kelemen et al. / Nature Conservation 43: 167–191 (2021)
and future persistence of populations. Wetland habitats experienced fragmentation
and significant shrinkage in south-western Slovakia and only a few habitat fragments
are left for root voles. In the present survey, we used microsatellite analyses to study
the genetic diversity and structure of Pannonian root vole subpopulations inhabiting
remnant habitat fragments in the Danubian Lowland, where the greatest threat to
their long-term survival is habitat loss, fragmentation and degradation (Gubányi et al.
2009; Horváth et al. 2012; Horváth and Herczeg 2013; Miklós et al. 2014; Thissen
et al. 2015a; Ambros et al. 2016). Understanding the spatio-temporal dynamics and
population genetic patterns of this subspecies could be valuable for developing and
improving an appropriate and effective conservation action plan and to derive recom-
mendations for the conservation management of this endangered subspecies.
Materials and methods
Study area and samples
Located in the south-western part of Slovakia, the study area lies in the Danubian Plain
(Podunajská rovina), part of the Danubian Lowland, belonging to the Pannonian bio-
geographical region. The landscape was formed by the tributaries of the Danube (Little
Danube and others) and by the southern Váh, Nitra and Žitava Rivers. Soil properties
and climatic conditions make this region ideal for agriculture. In the area, wheat, sugar
beets, sweet corn, vegetables, fruits and tobacco are grown. In the late 19th century, the
study area was located in the centre of wet meadows interlaced by meanders of Žitava
River, as shown by the Third Military Survey of the Habsburg Empire (1869–1887)
(2018). Over the past 130 years, extensive flood protection measures and construction
of the channel network fragmented the area of natural meanders of the Žitava River,
which changed the direction and hydrodynamics of their flow and led to the aridifica-
tion of the surrounding ecosystems. By 1926, the original wet meadows had dried up
and a network of meanders had formed into a compact wetland habitat crossed by two
channels. The consequences of these interventions were still visible in 1964, but the
size of wetland habitats had become further reduced by 1990 (Topographic Maps of
Czechoslovakia 2018). Today, remnants of the original meander system exist only as
a few patches, where the Pannonian root vole still survives. The extension, shape and
connectivity of recent wetland habitats scattered across the agricultural landscape are de-
termined by water levels and temporary floods. In the summer and winter of 2010, the
extreme precipitation raised water levels and caused the flooding of the Danube (Slovak
Hydrometeorological Institute 2011). The last highest water level rise of the river was re-
corded in spring 2013 (Jakubcová et al. 2014; Matoková and Smrtík 2014), which also
influenced our study area. The localities included in this study are situated in the area
interlaced by three channels between Patince, Chotín and Marcelová Villages (Fig. 1).
The research was carried out in different types of habitat fragments like water-
logged areas overgrown by Carex spp. and Phragmites spp. at the edges of channels,
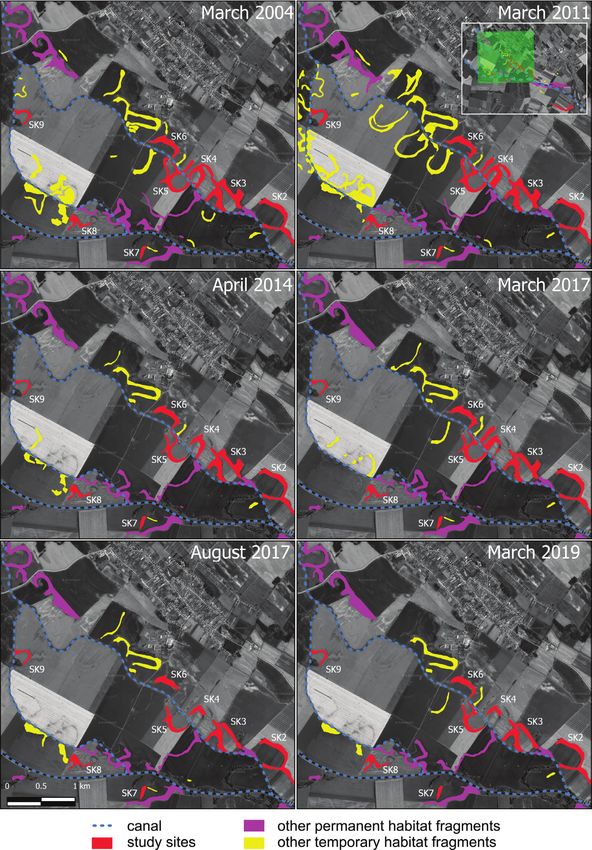
oxbow lakes and remnants of former tributaries intersecting large areas of agriculturalGenetic variability and conservation of the Pannonian root vole 171 Figure 1. The distribution of the sampled localities of root vole subpopulations in the Danubian Low- land. The sampling sites found in the habitat fragments are indicated by letter and number codes. The insert shows the location of the study area in Slovakia. lands. Animals were captured with live traps baited with apple and cereals. One line transect of 25 traps with 10 m intervals was established for five consecutive nights in each trapping site. Trapping was conducted three times a year (spring, summer, au- tumn), from 2014 to 2017. Traps were inspected once a day. Upon capture, each vole was investigated for body weight, age and reproductive status before release. At the first capture, the tail tip of each vole was clipped for genetic analyses. The clipped tail tips were put immediately in 96% ethanol and preserved at -85 °C in the laboratory until DNA extraction. Trapping and sampling methods were realised in agreement with the rules of State Nature Protection of Slovak Republic “Species and habitats monitoring of European importance within the Habitats Directive and the Birds Directive” pro- ject. Due to the rarity and endangered status of the Pannonian root vole, sample sizes were low in some trapping transects and, therefore, a total of 69 tissue samples from nine sites were used in molecular analyses. Changes in habitat fragment patterns and estimation of subpopulation sizes Five characteristics related to wetland habitat fragments were measured or calculat- ed in six time periods between 2004 and 2019 (January 2004, March 2011, April 2014, March 2017, August 2017 and March 2019): 1) number of all habitat frag- ments presumably suitable for the Pannonian root vole; 2) number of temporarily
172          Krisztina A. Kelemen et al. / Nature Conservation 43: 167–191 (2021)

suitable habitat fragments appearing occasionally, depending on water levels; 3) total
area of all habitat fragments measured in hectares; 4) average size of habitat fragments
(ha); and 5) overall connectivity of our region of interest. Suitable habitat fragments
were delimited based on the subspecies’ known habitat preference for humid, densely
vegetated areas (see Introduction), which markedly differed from the vegetation of
agricultural parcels in the study area. The size of particular habitat fragments (ha) was
calculated in QGIS software 3.4.12-Madeira (QGIS Development Team 2019). To
calculate the connectivity of the whole area (total size: 2873.8 ha), the equivalent con-
nectivity (EC) of PC (probability of connectivity) probabilistic index was used (Saura
et al. 2011a, b), where Euclidian edge-to-edge distances with 700 metres’ maximum
dispersal distance threshold parameter (5% probability for a species to exceed 700 m)
were set as a connection between habitat fragments. This distance was set as the average
dispersal distance observed on the root vole by Steen (1994). All connectivity indices
were calculated in Conefor 2.6 (Saura and Torné 2009). The maps of habitat fragments
were created as digitalised topographic maps of Google Earth in map scale 1:5000.
Individuals from the same locality were treated as a putative subpopulation (hereafter
referred to as subpopulation).
     Due to different trapping efforts at each study location, the size of each subpopula-
tion was evaluated as the relative abundance (rA) of individuals captured at the loca-
tion per 100 trap-nights (C/100TN), based on data without recaptures. The number
of captured specimens (N) was recalculated into the transformed rA index assuming a
random (Poisson) distribution (rA = (–ln (1-N/100) 100) of small mammals to remove
the saturation effect caused by single traps (Caughley 1977). Relative abundance values
were averaged over trapping occasions.
     We tested the correlation between average rA of Pannonian root vole and average
habitat fragment size using Pearson correlation analysis, where both data were log-
transformed due to non-normal distribution.

Genetic analysis
DNA extraction

DNA extractions were performed using commercial Isolate II Genomic DNA Kit (Bi-
oline) according to the manufacturer’s protocol with the following modifications: dur-
ing pre-lysis, samples were incubated overnight at room temperature; after adding pre-
heated Elution Buffer G (70 °C), the elution step covered the incubation of samples at
room temperature for 30 minutes and after that at 70 °C for 5 minutes before elution.

Analysis of genetic markers and genotyping
The thirteen microsatellite loci included in the analyses were developed for Microtus ar-
valis: Mar003, Mar016, Mar049, Mar063, Mar076 (Walser and Heckel 2008) and for
Alexandromys oeconomus: Moe1, Moe2, Moe3, Moe4, Moe5, Moe6, Moe7 and Moe8
Genetic variability and conservation of the Pannonian root vole 173
(Van de Zande et al. 2000). Microsatellite markers were grouped into four multiplex
sets (Set1A: Moe1, Moe2, Moe3; Set1B: Moe4, Moe5, Moe6; Set2: Moe7, Moe8;
Set3: Mar003, Mar016, Mar049, Mar063, Mar076).
Multiplex PCR reactions were performed in 12 μl volumes containing 2 μl (~80 ng)
of DNA and a volume of 10 μl of the following mixture: 3.9 μl of KAPA2G Fast Mul-
tiplex Mix (KAPA Biosystems), 0.8 μl of BSA, 0.5 μl (concentration of 10 pm/ng) of
each primer and RNase-free water to fill the volume to 10 μl. Amplification of DNA
was carried out using peqSTAR 96X Universal thermal cycler (Peqlab).
To amplify microsatellites in Set 1A, Set 1B and Set 2 the PCR reaction consisted of
the initial step at 94 °C for 7 minutes, 30 cycles including: denaturation at 94 °C for 1
minute, annealing at 55 °C in case of Set 2 and 60 °C in case of Set 1A and Set 1B for 2
minutes and extension at 72 °C for 90 seconds, followed by a final step at 72 °C for 10
minutes. Microsatellites in Set 3 were amplified in a PCR reaction including the follow-
ing steps: 7 minutes at 95 °C, 35 cycles of 30 seconds at 94 °C, 1 minute at 57 °C and
90 seconds at 72 °C and after the cycles a final step of 10 minutes at 72 °C. To prepare
the genotyping procedure 1 μl PCR product of each sample was mixed with 12 μl for-
mamide and 0.3 μl GeneScan 500-LIZ size standard (Applied Biosystems). After a de-
naturation step of 5 minutes at 95 °C, a cooling step was implemented. Genotyping was
carried out using ABI PRISM 310 Genetic Analyser (Applied Biosystems) and micros-
atellite genotypes were examined using GeneMapper software v.4.0 (Life Technologies).
Clustering analysis of samples
We successfully genotyped 69 individual samples and the amplification success varied
amongst markers (94.2–100%). The presence of null alleles may cause significant het-
erozygote deficit and deviation from the HWE. We therefore estimated the proportion
of null alleles (NA) at each locus in each subpopulation using the programme FREE-
NA (Chapuis and Estoup 2007). All genotypic distributions were in accordance with
HWE expectations for all loci and, as we did not detect null alleles based on FREENA,
consequently, all loci were included in the analyses.
Bayesian clustering of microsatellite genotypes was performed using STRUCTURE
v.2.3.2 (Pritchard et al. 2000). Ten independent runs were performed for each value
of K ranging from one to ten under a model assuming admixture and correlated allele
frequencies (Falush et al. 2003). Each run comprised a burn-in period of 100,000 rep-
lications followed by a run length of 1,000,000 Markov Chain Monte Carlo (MCMC)
iterations. The results of replicated runs for each value of K from one to ten were
combined using STRUCTURE HARVESTER v.0.6.94 (Earl and vonHoldt 2012)
and the optimal value of K was assessed by the inspection of log-likelihood values and
according to the ΔK method developed by Evanno et al. (2005). Twenty independent
runs were conducted with K fixed at the estimated optimal number of clusters where a
burn-in of 100,000 and 1,000,000 MCMC iterations were used. The outputs of repli-
cated runs were combined using the Greedy algorithm in CLUMPP v.1.1.2 (Jakobsson
and Rosenberg 2007) and DISTRUCT v.1.1 (Rosenberg 2004) was used to visualise
cluster assignments.174 Krisztina A. Kelemen et al. / Nature Conservation 43: 167–191 (2021) Genetic variability in subpopulations The mean number of alleles (A), observed (HO) and expected (HE) heterozygosity (Nei 1978) and inbreeding coefficients (FIS) were calculated using GENETIX v.4.05.2 (Belkhir et al. 2004). The allelic richness (AR) was estimated using the rarefaction pro- cedure for the lowest sample size (n = 10) in the programme FSTAT v.2.9.4 (Goudet 2003). Deviation of subpopulations from Hardy-Weinberg equilibrium (HWE) was calculated with exact tests assessing heterozygote deficiency and excess in GENEPOP v.4.2 (Rousset 2008). The basic level of significance was set to P = 0.05 and for mul- tiple comparisons, we applied a Bonferroni procedure compensating for the risk of an inflating type 1 error. Genetic variation between subpopulations The programme FREENA was used to estimate global FST, by performing 10,000 per- mutations. In addition, a Monte Carlo test of likelihood ratio G-statistic (Goudet et al. 1996) was performed using package hierfstat v.0.04-22 (Goudet and Jombart 2015) in R v.3.5.0 (R Core Team 2018) to test the presence of genetic structuring. Estimations of pairwise FST were implemented in FSTAT v.2.9.4 according to Weir and Cockerham (1984). Significant differences of FST estimators from zero were tested using 100,000 permutations without the assumption of Hardy-Weinberg equilibrium and significance level was set to P = 0.05 and adjusted using the Bonferroni correction. In addition, isolation by distance was tested by assessing the correlation between the geographical distance matrix (given in kilometres) and pairwise FST/(1-FST) estimates using Mantel’s Test with 10,000 permutations in the programme ISOLDE in GENEPOP v.4.2. The GENETIX v.4.05.2 package was used to investigate genetic relationships amongst all genotyped individuals of the nine subpopulations by factorial correspondence analysis (FCA), a method that identifies the linear combination of variables (allele frequencies at different loci) that captures the most variation between observations (individuals or populations) and visualises genetic relationships in 2D space determined by FCA axes. Analysis of Molecular Variance (AMOVA) (Excoffier et al. 1992) was implemented in GENALEX v.6.5 (Peakall and Smouse 2006, 2012) to test the proportion of genetic variance amongst individuals and subpopulations. Statistical significance of the vari- ance components was assessed with 999 permutations. Results Habitat fragment patterns and subpopulation sizes Between 2004 and 2019, we identified 26 permanent habitat fragments as suitable habitats for root voles, in 14 of which their presence were confirmed. We have also identified several temporarily suitable fragments, the number of which varied season-
Genetic variability and conservation of the Pannonian root vole                            175

ally and annually. All measured characteristics of potential habitats (number of frag-
ments and temporary fragments, total area of all habitat fragments, mean fragment
size and connectivity of the whole area) changed over the six time periods of study (see
Table 1). In general, connectivity had higher values in periods when the number and
size of habitat fragments were higher. In March 2004 and March 2011, the number of
temporary fragments increased, filling the matrix of agricultural land between perma-
nent fragments with new suitable habitat (see Fig. 2). The highest values of parameters
were observed in 2011, except for the average fragment size. After this period, the total
area of habitat fragments, the number of temporary fragments and the connectivity
decreased and permanent fragments were thus more isolated. Values of parameters
remained relatively similar in the following years. Partial changes in habitat fragment
characteristics and connectivity are detectable in seasonal comparison between March
and August 2017, with higher values in spring. In a detailed view of the study sites in
Fig. 2, it can be seen that, while in August 2017, sites SK3, SK4, SK5 and SK6 were
relatively small and isolated from each other, in March 2004, 2011 and 2017, the same
sites were larger and only a channel interrupted their direct connection.
     The average occupancy of fragmented habitats by the Pannonian root vole varied
spatially (Fig. 3). While some fragments had a high relative population size, others had
very low. The analysis did not confirm a positive correaltion between average rA of Pan-
nonian root vole and average size of fragmented habitats (r = 0.15, N = 9, P = 0.74).

Clustering analysis
Genetic structuring inferred from STRUCTURE analysis is presented in Fig. 4 for K
values ranging from 2 to 5. The ΔK method indicated that the optimal number of clus-
ters was 5. However, this method can evaluate ΔK only for K > 1 and the inspection
of log-likelihood scores revealed that K = 1 had a relatively high likelihood, similar to
other values of K. Generally, assignment probabilities were roughly symmetric, which
indicated that none of the clustering analyses captured the real population structre.
Notably, when K was fixed at 5, SK1 individuals sampled in 2014 (individuals 3, 6, 7
and 8) and an additional individual from SK5 (individual 26 sampled in 2015) had
relatively high assignment probabilities to the same cluster and the same for individuals
57 and 60 sampled in SK9 in 2017. However, not all individuals sampled in 2014 and
2015 were assigned to this cluster (indicated with grey in Fig. 4).

Table 1. Changes in patch characteristics during the six time periods between 2004 and 2019.

Time period Area of all patches (ha) Mean size of patches (ha) No. of all patches No. of temporary patches Connectivity*
2004 March          179.26                     3.51                    51                    25              840705.8
2011 March          210.19                     3.28                    64                    38              975203.3
2014 April          144.49                     3.80                    38                    12              669245.9
2017 March          149.73                     3.56                    42                    16              679802.1
2017 August         140.92                     4.14                    34                    8               627252.9
 2019 March         143.26                     4.21                    34                    8               642355.8
* calculated in a total study area of 2873.8 ha
176 Krisztina A. Kelemen et al. / Nature Conservation 43: 167–191 (2021) Figure 2. Change in the number of suitable habitat fragments for the Pannonian root vole in the north- western part of the study area over time. The green box in the insert shows the boundaries of the larger maps.
Genetic variability and conservation of the Pannonian root vole                 177

Figure 3. The relative abundance (rA) of Pannonian root vole subpopulations in sampled habitat frag-
ments. Relative abundance values were averaged over trapping occasions and average rA was visualised on
the map as graduated symbol size.

Hardy-Weinberg equilibrium and genetic diversity in subpopulations
Clustering analysis did not give a strong evidence of structuring; therefore, measures of
genetic diversity were calculated for all subpopulations separately and for all samples
pooled together. Genetic diversity and HWE were not calculated for locations SK3,
SK4 and SK7 due to their small sample size (N = 3).
    The number of alleles per locus in subpopulations ranged from 2 (locus Moe4) to
16 (locus Moe7), and the mean number of alleles per locus (A) ranged from 4.31 to
5.62 (Table 2). Allelic richness (AR) across subpopulations ranged from 4.22 to 5.46,
being the highest in the SK1 subpopulation and lowest in the SK8 subpopulation. HO
(range between 0.562 and 0.669) was the highest in subpopulations SK8 and SK9,
while the lowest value was shown for SK5. In contrast, HE (range between 0.624 and
0.657) showed another pattern, with the highest value for SK1 and the lowest value
observed for SK8. Two subpopulations, SK8 and SK9 had heterozygosity excess, based
on observed and expected heterozygosity values. Subpopulations SK1, SK2, SK5 and
SK6 showed significant heterozygote deficiency on the basis of FIS (significant positive
values). Subpopulations SK1, SK2 and SK5 deviated from HWE according to het-
erozygote deficiency exact tests in GENEPOP (P = 0.05) after Bonferroni correction
178 Krisztina A. Kelemen et al. / Nature Conservation 43: 167–191 (2021)
(Table 2). Heterozygote excess exact tests were not significant in any of the cases (data
not shown). Mean number of alleles and expected heterozygosity indicated higher ge-
netic diversity and the exact test showed a significant deficiency of heterozygotes when
all samples were pooled together.
Figure 4. Genetic structure of the sampled root vole subpopulations in the Danubian Lowland. The
graph is based on STRUCTURE runs when K was fixed at 2–5. Each individual is represented by a line
proportionally divided into colour segments corresponding to its membership in certain clusters. Black
lines separate the individuals from different habitat fragments.
Table 2. Genetic diversity in root vole subpopulations and in the total population based on 13 micros-
atellite loci.
Location A AR HE HO HWE FIS
P ±SE
SK1 5.62 5.46 0.657 0.586 < 0.001* 0.0000 0.161*
SK2 5.08 5.00 0.654 0.574 < 0.001* 0.0002 0.176*
SK5 4.62 4.49 0.631 0.562 < 0.001* 0.0003 0.161*
SK6 5.15 5.02 0.651 0.619 0.006 0.0010 0.103*
SK8 4.31 4.22 0.624 0.665 0.161 0.0059 -0.013
SK9 4.62 4.50 0.655 0.669 0.228 0.0115 0.030
Total 7.23 7.23 0.694 0.614 < 0.001* 0.0000 0.122*
A: mean number of alleles per locus, AR: allelic richness, HE: expected heterozygosity, HO: observed heterozygosity, FIS: inbreeding co-
efficient, HWE: P values and standard errors of Hardy-Weinberg equilibrium exact tests; * significant values of HWE (after Bonferroni
correction) and FIS. (In case of the total population, A = AR).Genetic variability and conservation of the Pannonian root vole 179
Figure 5. Two-dimensional plots of FCA performed for nine subpopulations showing the 1st and 2nd (A)
and the 1st and 3rd (B) axes. The proportion of explained variance is written in parentheses on each axis.
Table 3. Tests for genetic differentiation between nine root vole subpopulations in the Danubian Low-
land. Below diagonal: pairwise FST values. Above diagonal: P values of G-tests implemented in FSTAT.
Location SK1 SK2 SK5 SK6 SK8 SK9
SK1 0.234 0.307 0.185 < 0.001** 0.010
SK2 0.015 0.344 0.099 0.064 0.020
SK5 0.013 0.004 0.479 0.137 0.012
SK6 0.010 0.009 -0.002 0.001* < 0.001**
SK8 0.071 0.021 0.016 0.045 < 0.001***
SK9 0.033 0.013 0.014 0.052 0.048
* Significant P values on the nominal level of 0.05 (*), 0.01 (**) and 0.001 (***) after Bonferroni correction.
Genetic differentiation between subpopulations
Subpopulations SK3, SK4 and SK7 were not included in FST analyses because of their
small sample size (N = 3). The global FST for six subpopulation samples was 0.025
(95% CI: 0.01–0.041). The overall G-test was significant (P < 0.001), indicating ge-
netic structuring amongst locations. Pairwise FST values were relatively low, although
variable. The highest FST values were observed for SK8 and SK9. Pairwise genetic dif-
ferentiation was not significant in most of the comparisons, except in cases where
one subpopulation of the pair was always SK6, SK8 or SK9 (Table 3). Significant FST
was observed between SK1 and SK8, but when the individuals of SK1 sampled in
2014 were excluded from pairwise FST analyses, this difference became non-significant
(FST = 0.048). Microsatellite-based genetic distances did not correlate with geographi-
cal distances between subpopulations (a = 0.0254, b ~ 0, P = 0.6), thus spatial separa-
tion (IBD) was not confirmed.
The FCA plot, based on individual genotypes, clearly separated SK1 along the
first factorial axis (explaining 20.1% of variation) from all other subpopulations.
The second axis (explaining 17.9% of variation) mainly separated the individuals
from SK1 and SK9, while individuals from SK6 showed only a weak segregation180 Krisztina A. Kelemen et al. / Nature Conservation 43: 167–191 (2021)
(Fig. 5A). Subopulation SK8 was separated along the third axis (explaining 14.6%
of variation, Fig. 5B).
In the Analysis of Molecular Variance, significant genetic variation was attributed
to the differences between subpopulations (4.4%, P < 0.001) and most of the variabil-
ity occured within subpopulations (95.6%).
Discussion
Our results show that genetic variation and differentiation in subpopulations of the
Pannonian root vole is in good agreement with connectivity between habitat frag-
ments, with temporary fragments playing an important role in vole migration between
flood events.
Habitat connectivity
The number, size and shape of habitat fragments in the studied region varies in time
as the result of exogenous factors (precipitation, surface water levels, agricultural ac-
tivities). These dynamic changes have an effect on fragment connectivity, suggesting
that connectivity was positively influenced by the number of habitat fragments. As
we have also noted, permanent habitat fragments, relatively distant from each other
at one time, can change size and shape and become neighbouring habitats at another
time. In addition, the temporary fragments can play the role of stepping stones dur-
ing vole movements. Thus, despite the constant presence of habitat fragments and
channel-side vegetation, fragment connectivity can vary seasonally and yearly, as can
change the possibility of individuals’ replacement between the studied subpopula-
tions. In Norway, root voles increased dispersal distance as a response to fragmenta-
tion, but it was less affected by connectivity (Bjørnstad et al. 1998). Detailed data on
the dispersal ability of the Pannonian root vole are still missing, although they have
been shown to be able to cross barriers when the quality of original habitats deterio-
rated and they may follow stepping stones when searching for new habitats (Horváth
and Herczeg 2013). Moreover, Kratochvíl and Rosický (1955) observed that Pan-
nonian root voles in sedge (Carex sp.) survived on hummocks when the water level
increased (50–70 cm). When the water level decreased, voles spread across the lower
parts of these hummocks, while some individuals dispersed to new suitable fragments.
In view of this, a possible explanation for the observed genetic patterns could be that
the animals found shelter on hummocks during floods in 2010 and probably 2013,
thus opening the way for admixture. Later, when water levels fell, presumably ad-
mixed individuals resettled lower areas.
Genetic differentiation of the Pannonian root vole
Levels of genetic differentiation between the habitat fragments varied, but were mostly
non-significant and we found no support for isolation by distance between subpopula-Genetic variability and conservation of the Pannonian root vole 181
tions. Bayesian clustering in STRUCTURE did not reveal pronounced genetic struc-
turing, indicated by approximately equal assignment probabilities to different clusters
in all cases of K from 2 to 5. This result suggested that dispersal effectively prevents
marked genetic subdivision between studied habitat fragments, which can be addi-
tionally confirmed by the lack of isolation by distance between fragments. Given the
small geographical scale and landscape pattern of the study area, we would expect gene
flow between localities to maintain very low or no differentiation between subpopula-
tions. In a study conducted in the Netherlands, Mauritzen et al. (1999) concluded that
ditches are likely to favour linear movements of root voles and may enhance connec-
tivity in an agricultural landscape. Most habitat fragments sampled in our study were
directly connected by reed- and sedge-lined channels that are likely to serve as dispersal
corridors and permanent or temporary habitat fragments in the study area also likely
to facilitate dispersal (Ambros et al. 2016). Although the longest geographical distance
along the channels separating our sampling sites from their nearest neighbours was
nearly 6 km, as for SK1 and SK2, the presence of root vole was confirmed in other
permanent habitat fragments between these two sampling sites (which could not be
included in our study due to the small number of samples) and most of the habitat
fragments sampled were relatively close to each other. Movement distances of male
root voles can exceed several hundred metres in a short time or more than two kilome-
tres within a few days (Steen 1994; Andreassen et al. 1996).
Consistent with the changing possibility of individuals’ replacement between the
studied fragments, AMOVA results also showed a low, but significant, percentage of
variability between subpopulations. In addition, signs of genetic differentiation were
detected between subpopulations SK8, SK9 and SK6, based on significant pairwise FST
values and the FCA analysis confirmed the separation of these samples. Results may
therefore indicate that dispersal is not unhindered between all subpopulations and root
vole individuals in the network of studied habitat fragments may not be viewed as a
panmictic population.
Genetic diversity of the Pannonian root vole
In a detailed study, Hulejová Sládkovičová et al. (2018) already noted that, despite
the high genetic variability of the subspecies, local populations of Pannonian root
vole may show signs of genetic depletion. Although our analyses were limited by
small sample sizes due to the rarity of the Pannonian root vole, our results indicate
lower genetic diversity in subpopulations (in terms of allelic richness, mean number
of alleles per locus and expected heterozygosity) than what was measured in other
populations from south-western Slovakia (Hulejová Sládkovičová et al. 2018). Simi-
larly, reduced genetic diversity (based on the mean number of alleles per locus and
the expected heterozygosity) was observed compared to the populations of another
isolated Western European root vole subspecies, namely A. o. arenicola (Van de Zande
et al. 2000). Expected heterozygosity and mean number of alleles in the total studied
population indicated decreased variability compared to other Slovakian populations
(Hulejová Sládkovičová et al. 2018). Low genetic diversity of the studied root vole182 Krisztina A. Kelemen et al. / Nature Conservation 43: 167–191 (2021)
population putatively reflects a pronounced geographical isolation of the surviving
population and the decrease in effective population size that has likely occurred. In
addition, flood events may have reduced the size of the vole population (Kratochvíl
and Rosický 1955), which may have created a bottleneck, although its influence on
the genetic diversity of the studied population cannot be clearly confirmed on the
basis of our results alone. The reduced genetic diversity is in accordance with the view
of Hulejová Sládkovičová et al. (2018) who suggested that the Danube River and as-
sociated branch network could facilitate vole dispersal, but local populations embed-
ded in the agricultural landscape and further from the Danube are likely to remain
isolated. Moreover, based on the evaluation of the distribution of Pannonian root
vole, our study area is close to the eastern boundary of the subspecies’ range (Gubányi
et al. 2009; Ambros et al. 2016) and populations occurring here are likely isolated by
the distance from other populations to the west.
Subpopulations SK8 and SK9 tend to have lower levels of allelic richness, which
is consistent with the possibly lower probability of dispersal through the agricultural
land matrix compared to other sites. However, we did not find significant deviation
from the Hardy-Weinberg equilibrium in these subpopulations. We observed devia-
tions from the Hardy-Weinberg equilibrium in SK1, SK2 and SK5 and significant
positive FIS coefficients in the same subpopulations, together with SK6, which may
result from the social structure of root voles. Matriline-based groups in root vole popu-
lations (Tast 1966) give the possibility of sampling kin individuals, which may result
in departures from the Hardy-Weinberg equilibrium (Aars et al. 2006). On the other
hand, Stewart et al. (1999) argue that genetic composition (and departures from the
Hardy-Weinberg equilibrium) of water vole (Arvicola amphibius) colonies is under the
influence of yearly fluctuation and suggested that genetic drift is a plausible cause
resulting in that pattern. They interpreted high levels of genetic diversity as a sign of
gene flow between colonies. Similarly, despite the relatively large number of analysed
individuals, Pilot et al. (2010) observed yearly changes in departures from the Hardy-
Weinberg equilibrium in a root vole population in Poland; nevertheless, a high level
of genetic diversity was maintained over the years. In addition, they found no genetic
differentiation between years regardless of changes in density, kin structure and de-
viations from HWE, indicating that genetic composition is stable over time in large,
demographically-stable populations. In contrast, studies of water vole metapopulations
revealed temporal genetic differentiation, but genetic variability remained high as a
result of gene flow (Stewart et al. 1999; Aars et al. 2006).
Possible migration from Danube River
Regarding individuals 3, 6, 7 and 8 (sampled in 2014 and 2015) in SK1, highlighted by
clustering analyses, their high assignment probability to a separate cluster may reflect
their distinct origin. Habitat fragment SK1 is the closest to the Danube River amongst
the studied fragments and the floods in 2010 or 2013 potentially facilitated dispersal
from further areas and the aforementioned individuals might be immigrants or theirGenetic variability and conservation of the Pannonian root vole 183
descendants. Other individuals that had relatively high assignment probabilities to the
same cluster were captured in SK5 (individual 26 from 2015) and SK9 (individual 57
and 60). These can be found at a few kilometres distance from SK1, but given the small
spatial scale, it is not unlikely that these specimens may be the offspring of dispersing
individuals. Alternatively, it is also possible that genetic drift over time changed the
genetic composition of subpopulations in the fragmented landscape; hence, some (but
not all) samples collected in 2014 and 2015 were highlighted by STRUCTURE clus-
tering. However, we are not able to declare which possibility is more plausible without
genotyping individuals from other areas and without temporal analysis of samples.
The genetic diversity of the local subpopulations in the study area is relatively
low; although the studied subpopulations probably have connections with each other
due to the effect of extensive floods and the network of fragments and channels in
the agricultural landscape, their reduced genetic variability is detectable compared to
the pooled genetic variability of other populations of Pannonian root vole occurring
closer to the more uninterrupted marshlands in Szigetköz, Hanság and Neusiedlersee
Regions (Hulejová Sládkovičová et al. 2018). Based on the pattern of remnant habitat
fragments, it is likely that root vole subpopulations in our study area form a metap-
opulation system and the observed genetic patterns do not contradict this possibility.
However, studies on extinction and recolonisation patterns and migration rates would
be essential to support this view (Gaggiotti 2004; van der Merwe et al. 2016).
Conclusions and management implications for conservation
Landscape changes and habitat destruction resulted in the fragmented distribution of
root vole habitats in the study area and fluctuating surface water levels induce consid-
erable changes in habitat size, quality and connectivity to this day. Only one fragment
(SK2) in our study area is protected as a Special Protection Area. However, for the
long-term persistence of root vole populations, it would be critical to ensure legal pro-
tection of habitats. The importance of protected core areas has been demonstrated for
water vole metapopulations (MacPherson and Bright 2011) and mainland or source
population demography has been shown to shape habitat use of root voles (Glorvigen
et al. 2013). Based on the low differentiation, it seems unlikely that the studied vole
subpopulations formed a mainland-island type metapopulation system (Stewart et al.
1999), but the signs of admixture highlight the vital role of habitat fragments and gene
flow in the maintenance of genetic diversity. On the other hand, Van de Zande et al.
(2000) proposed that weak differentiation may be an indicator of progressive isolation
of local populations and accordingly, the prevention of fragmentation should be con-
sidered in the conservation management of A. o. arenicola. It has been suggested for
other vole species and subspecies that persistent gene flow between habitat fragments
is crucial for the maintenance of genetic variability (Telfer et al. 2003). Therefore, it is
necessary to protect not only habitat fragments with current occurrences of the Panno-
nian root vole, but also other potentially-suitable habitat fragments, to form a habitat
network and to ensure the possibility of gene flow (Neuwald 2010). Water levels in184 Krisztina A. Kelemen et al. / Nature Conservation 43: 167–191 (2021)
the study area and, as we demonstrated, total size of permanent habitat fragments and
number of temporary habitats are in dynamic change, which further emphasises the
contribution of these fragments to the survival of the subspecies in the agricultural
landscape (Kalmár and Riezing 2017).
It is expected that the overall genetic diversity of the subpopulations will decrease
as a result of their small size and isolated location in the agricultural matrix. This im-
plies that the restoration of habitats and corridors is indispensable for the long-term
preservation of diversity, as has been stressed earlier (Thissen et al. 2015a; Hulejová
Sládkovičová et al. 2018). As a habitat specialist, the Pannonian root vole is sensitive
to habitat quality changes, which are likely to be the key factors determining habi-
tat use (Glorvigen et al. 2013; Horváth and Herczeg 2013). Thus, it is important to
preserve optimal water level conditions for the root vole, for example, by controlled
construction of infrastructure that may cause aridification and the disappearance of
the subspecies (List et al. 2010; Kalivodová et al. 2018). For this reason, it is necessary
to take the needs of the subspecies into consideration when infrastructural projects are
planned and managers should be involved in landscape and land-use planning. Finally,
long-term monitoring is recommended to provide further information about popula-
tion and subpopulation parameters (Hayes et al. 2017), genetic diversity and structure
(Proença-Ferreira et al. 2019) and on the changes of habitats (Martensen et al. 2017) to
elaborate an effective conservation management action plan that ensures the long-term
survival of the Pannonian root vole.
Acknowledgements
The research was conducted by virtue of Dr. Michal Ambros’ appointment as mapping
coordinator for important European small mammal species. This work was supported
by the i) VEGA (grant No. 1/0277/19); ii) Slovenian Research Agency (programme
group P1-0386); iii) the STARBIOS2 European Union’s Horizon 2020 Research and
Innovation Programme under grant agreement No. 709517 orientated to promote
responsible research and innovation in biosciences; (iv) the RESBIOS European
Union’s Horizon 2020 Research and Innovation Programme (No. 872146); and v)
COST Action G-Bike (CA18134), supported by COST (European Cooperation
in Science and Technology). We express our sincere thanks to Imrich Jakab, Jakub
Kamenišťák, Peter Klimant, Anita Morvai, Balázs Somogyi, Michal Ševčík, Martina
Zigová and to all who assisted in small mammal trapping. Language assistance was
kindly provided by Balázs Trócsányi. We are grateful to the anonymous reviewers for
their valuable comments on the earlier version of this paper.
References
Aars J, Dallas JF, Piertne SB, Marshall F, Gow JL, Telfer S, Lambin X (2006) Widespread
gene flow and high genetic variability in populations of water voles Arvicola terrestris inGenetic variability and conservation of the Pannonian root vole 185
patchy habitats. Molecular Ecology 15(6): 1455–1466. https://doi.org/10.1111/j.1365-
294X.2006.02889.x
Ambros M, Baláz I, Klimant P, Tulis F, Dudich A, Stollmann A, Horváth G (2016) The occur-
rence of Pannonian root vole (Microtus oeconomus mehelyi) in small mammals’ communi-
ties in Danubian Plain. Folia Oecologica 43(1): 83–88.
Andreassen HP, Halle S, Ims RA (1996) Optimal width of movement corridors for root voles:
Not too narrow and not too wide. Journal of Applied Ecology 33(1): 63–70. https://doi.
org/10.2307/2405016
Baláž I, Fraňová S (2013) Biometric values comparison of somatic and cranial features of two
Microtus oeconomus subspecies. Folia Faunistica Slovaca 18(1): 59–66.
Belkhir K, Borsa P, Chikhi L, Raufaste N, Bonhomme F (2004) GENETIX 4.05, logiciel sous
Windows TM pour la génétique des populations. Laboratoire Génome, Populations, In-
teractions, CNRS UMR 5000, Université de Montpellier II, Montpellier (France). https://
kimura.univ-montp2.fr/genetix/
Bjørnstad ON, Andreassen HP, Ims RA (1998) Effects of habitat patchiness and connectiv-
ity on the spatial ecology of the root vole Microtus oeconomus. Journal of Animal Ecology
67(1): 127–140. https://doi.org/10.1046/j.1365-2656.1998.00175.x
Brunhoff C, Galbreath KE, Fedorov VB, Cook JA, Jaarola M (2003) Holarctic phylogeogra-
phy of the root vole (Microtus oeconomus): Implications for late Quaternary biogeography
of high latitudes. Molecular Ecology 12(4): 957–968. https://doi.org/10.1046/j.1365-
294X.2003.01796.x
Buzan EV, Krystufek B, Bryja J (2010) Microsatellite markers confirm extensive population frag-
mentation of the endangered Balkan palaeoendemic Martino’s vole (Dinaromys bogdanovi).
Conservation Genetics 11(5): 1783–1794. https://doi.org/10.1007/s10592-010-0071-2
Caughley G (1977) Analysis of Vertebrate Populations. Wiley, New York, 234 pp.
Centeno-Cuadros A, Roman J, Delibes M, Godoy JA (2011) Prisoners in their habitat? Gener-
alist dispersal by habitat specialists: A case study in southern water vole (Arvicola sapidus).
PLoS ONE 6(9): e24613. https://doi.org/10.1371/journal.pone.0024613
Chapuis MP, Estoup A (2007) Microsatellite null alleles and estimation of population dif-
ferentiation. Molecular Biology and Evolution 24(3): 621–631. https://doi.org/10.1093/
molbev/msl191
Čížková H, Květ J, Comin FA, Laiho R, Pokorný J, Pithart D (2013) Actual state of European
wetlands and their possible future in the context of global climate change. Aquatic Sciences
75(1): 3–26. https://doi.org/10.1007/s00027-011-0233-4
Council of Europe (1982) Convention on the Conservation of European Wildlife and Natural
Habitats. Official Journal of the European Communities L 38: 3–32. http://data.europa.
eu/eli/convention/1982/72/oj
de Sélys Longchamps ME (1841) Note sur le Mus agrestis de Linné. Bulletins de l’Académie
royale des sciences et belles-lettres de Bruxelles 8(2): 234–237.
Earl DA, vonHoldt BM (2012) STRUCTURE HARVESTER: A website and program for
visualizing STRUCTURE output and implementing the Evanno method. Conservation
Genetics Resources 4(2): 359–361. https://doi.org/10.1007/s12686-011-9548-7
Éhik Gy (1928) Néhány adat Magyarország emlősfaunájának ismeretéhez. Annales Historico-
Naturales Musei Nationalis Hungarici 25: 195–203.186 Krisztina A. Kelemen et al. / Nature Conservation 43: 167–191 (2021)
European Commission (1992) Council Directive 92/43/EEC of 21 May 1992 on the Conser-
vation of Natural Habitats and of Wild Fauna And Flora. Official Journal of the European
Union L 206: 7–50. http://data.europa.eu/eli/dir/1992/43/2013-07-01
Evanno G, Regnaut S, Goudet J (2005) Detecting the number of clusters of individuals using
the software STRUCTURE: A simulation study. Molecular Ecology 14(8): 2611–2620.
https://doi.org/10.1111/j.1365-294X.2005.02553.x
Excoffier L, Smouse PE, Quattro JM (1992) Analysis of molecular variance inferred from met-
ric distances among DNA haplotypes: Application to human mitochondrial DNA restric-
tion data. Genetics 131(2): 479–491. https://doi.org/10.1093/genetics/131.2.479
Falush D, Stephens M, Pritchard JK (2003) Inference of population structure using multilocus
genotype data: Linked loci and correlated allele frequencies. Genetics 164(4): 1567–1587.
Fietz J, Tomiuk J, Loeschcke V, Weis-Dootz T, Segelbacher G (2014) Genetic consequences of
forest fragmentation for a highly specialized arboreal mammal-the edible dormouse. PLoS
ONE 9(2): e88092. https://doi.org/10.1371/journal.pone.0088092
Gaggiotti OE (2004) Multilocus genotype methods for the study of metapopulation processes. In:
Hanski I, Gaggiotti OE (Eds) Ecology, Genetics, and Evolution of Metapopulations. Elsevier
Academic Press, London, 367–386. https://doi.org/10.1016/B978-012323448-3/50017-9
Gaines MS, Diffendorfer JE, Tamarin RH, Whittam TS (1997) The effects of habitat frag-
mentation on the genetic structure of small mammal populations. The Journal of Heredity
88(4): 294–304. https://doi.org/10.1093/oxfordjournals.jhered.a023107
Glorvigen P, Andreassen HP, Ims RA (2013) Local and regional determinants of colonisation-
extinction dynamics of a riparian mainland-island root vole metapopulation. PLoS ONE
8(2): e56462. https://doi.org/10.1371/journal.pone.0056462
Goudet J (2003) FSTAT (ver. 2.9.4): a program to estimate and test population genetics param-
eters. Updated from Goudet (1995). https://www2.unil.ch/popgen/softwares/fstat.htm
Goudet J, Jombart T (2015) hierfstat: estimation and tests of hierarchical F-statistics. R pack-
age version 0.04-22, 10. https://CRAN.R-project.org/package=hierfstat
Goudet J, Raymond M, de Meeüs T, Rousset F (1996) Testing differentiation in diploid popu-
lations. Genetics 144(4): 1933–1940. https://doi.org/10.1093/genetics/144.4.1933
Gubányi A, Dudich A, Stollmann A, Ambros M (2009) Distribution and conservation man-
agement of the root vole (Microtus oeconomus) populations along the Danube in Central
Europe (Rodentia: Arvicolinae). Lynx 40: 29–42.
Hayes LD, Ebensperger LA, Kelt DA, Meserve PL, Pillay N, Viblanc VA, Schradin C (2017)
Long-term field studies on rodents. Journal of Mammalogy 98(3): 642–651. https://doi.
org/10.1093/jmammal/gyw180
Horváth GF, Herczeg R (2013) Site occupancy response to natural and anthropogenic distur-
bances of root vole: Conservation problem of a vulnerable relict subspecies. Journal for
Nature Conservation 21(5): 350–358. https://doi.org/10.1016/j.jnc.2013.03.004
Horváth GF, Horvath B, Sali N, Herczeg R (2012) Community-level response to different
human disturbances and land use of small mammals in two marshland habitat patches
in Hungary. Archives of Biological Sciences 64(2): 613–628. https://doi.org/10.2298/
ABS1202613HYou can also read