Tissue-specific DamID protocol using nanopore sequencing
←
→
Page content transcription
If your browser does not render page correctly, please read the page content below

Journal of Biological Methods | 2021 | Vol. 8(3) | e152
DOI: 10.14440/jbm.2021.362                                                                                                                        Protocol

Tissue-specific DamID protocol using nanopore
sequencing
Georgina Gómez-Saldivar1, Dominique A. Glauser1*, Peter Meister2*
1
    Department of Biology, University of Fribourg, 1700 Fribourg, Switzerland
2
    Cell Fate and Nuclear Organization, Institute of Cell Biology, University of Bern, 3012 Bern, Switzerland

*Corresponding authors: Dominique A. Glauser, Email: dominique.glauser@unifr.ch; Peter Meister, Email: peter.meister@izb.unibe.ch

Competing interests: The authors have declared that no competing interests exist.

Abbreviations used: ChIP, chromatin immuno-precipitation; Dam, DNA adenine methyltransferase; DamID, DNA adenine methylation identification; ONT, Oxford Nanopore tech-
nologies; POI, protein of interest; RAPID, RNA PoI DamID; FACS, fluorescence activated cell sorting; FANS, fluorescence activated nuclei sorting; SRT, trans-splicing-based
RNA tagging; PAT-seq, polyA tagging and sequencing; gDNA, genomic DNA; ds-adapters, double-stranded adapters; SQB, sequencing buffer; LB, loading beads; FLT, flush
tether; FB, flush buffer; GFF, general feature format; RPB-6, RNA polymerase subunit 6; LMN-1, lamin; GFP, green fluorescent protein

Received March 23, 2021; Revision received May 5, 2021; Accepted May 12, 2021; Published August 27, 2021

             ABSTRACT

             DNA adenine methylation identification (DamID) is a powerful method to determine DNA binding profiles of proteins at a
             genomic scale. The method leverages the fusion between a protein of interest and the Dam methyltransferase of E. coli,
             which methylates proximal DNA in vivo. Here, we present an optimized procedure, which was developed for tissue-specific
             analyses in Caenorhabditis elegans and successfully used to footprint genes actively transcribed by RNA polymerases
             and to map transcription factor binding in gene regulatory regions. The present protocol details C. elegans-specific steps
             involved in the preparation of transgenic lines and genomic DNA samples, as well as broadly applicable steps for the
             DamID procedure, including the isolation of methylated DNA fragments, the preparation of multiplexed libraries, Nanopore
             sequencing, and data analysis. Two distinctive features of the approach are (i) the use of an efficient recombination-based
             strategy to selectively analyze rare cell types and (ii) the use of Nanopore sequencing, which streamlines the process.
             The method allows researchers to go from genomic DNA samples to sequencing results in less than a week, while being
             sensitive enough to report reliable DNA footprints in cell types as rare as 2 cells per animal.
             Keywords: CRE recombinase-based, tissue-specific expression, DNA adenine methylation identification, DNA-protein
             interaction, long-read sequencing, third generation sequencing

                             BACKGROUND                                                 DNA adenine methylation identification
                                                                                           DNA adenine methylation identification (DamID) [5] was developed
    The advent of deep sequencing has revolutionized basic and applied                  in 2000 by Bas van Steensel and Steven Henikoff as an alternative
biomedical science. Analyzing the expression of an entire genome,                       to chromatin immuno-precipitation (ChIP) to identify genome-wide
how its expression is modified by intra- and extra-cellular factors, or                 DNA-protein interactions in vivo, avoiding the troublesome steps of
obtaining the genomic footprints of DNA-binding proteins have become                    cell or nucleus isolation, fixation and immunoprecipitation with anti-
routine procedures in many research projects. However, when working                     bodies. DamID relies on the expression of trace levels of the E. coli
with entire animals, evaluating genome-wide changes for a given cell                    DNA adenine methyltransferase (Dam) fused to a protein of interest
type often remains challenging, as it requires to either sort cells from                (POI). The Dam methylates DNA located close to the binding site of
a dissociated tissue of interest or use transgenic approaches to purify                 the POI at GATC sites (Fig. 1A). Methylated sites are then used to
transcripts from the target cell type [1-4]. This can be difficult when                 track POI binding sites. Notably, DamID is highly versatile and has
the considered cell type is hard to separate from surrounding cells or is               been applied in many organisms, ranging from fission yeast [6-10], C.
a rare cell type. In particular, in the nematode C. elegans for which no                elegans [11-17], Drosophila [18-23], Medaka [24], Arabidopsis [25-27],
continuous culture system for differentiated cells has been developed,                  and mice [28-31] to human cells [32-35]. Additionally, DamID has been
this is a major hurdle to identify expressed genes or determine interaction             adapted to evaluate an extensive range of chromatin features in vivo
profiles of DNA-binding proteins in rare cell types.                                    such as chromatin accessibility (CATaDA) [36], chromatin dynamics
                                                                                        visualization (m6A-tracer) [37], transcription factor binding (MaTaDa)

    How to cite this article: Gómez-Saldivar G, Glauser DA, Meister P. Tissue-specific DamID protocol using nanopore sequencing. J Biol Methods
    2021;8(3):e152. DOI: 10.14440/jbm.2021.362

www.jbmethods.org                                                                                                                                                       1
                                                                               POL Scientific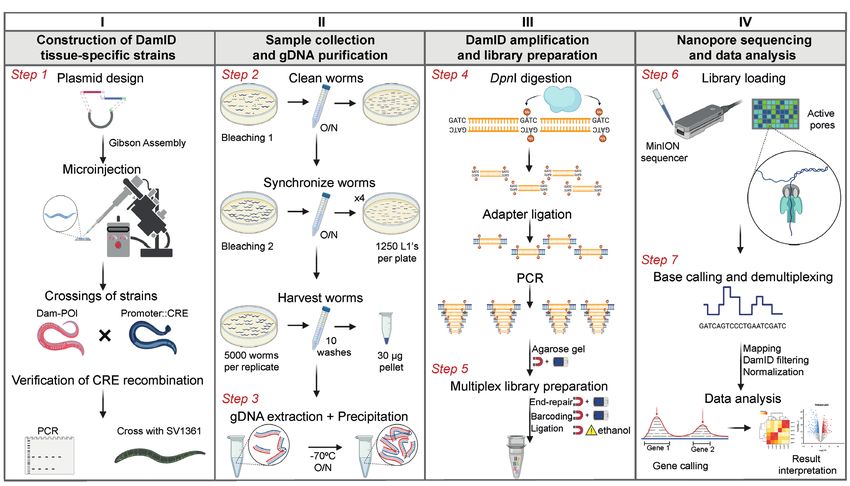
Protocol
[38] and co-binding (SpDamID) [39], RNA-DNA interactions (RNA-                a Dam methyltransferase, expressed only in the target tissue (Fig. 1B
DamID) [40], three-dimensional genome organization (DamC) [41],               and 1C). Using DNA purified from entire animals, we profiled muscle
transcriptional profiling (TaDa [42] and RAPID [43]), or simultaneous         and intestine transcription, with results comparable to other tissue-spe-
transcription and protein-DNA interaction profiling in single cells           cific RNA-seq methods based on sorting (Fluorescence Activated Cell
(scDam&T-seq) [44,45].                                                        or Nuclei Sorting: FACS [1], FANS [2]) or biochemical purification
                                                                              (trans-splicing-based RNA tagging, SRT [3], and polyA tagging and
Development of tissue-specific DamID in C. elegans                            sequencing, PAT-seq [4]). We further showed that this method can be
   We recently developed RAPID (RNA PoI DamID) to profile ge-                 applied for rare cell types by profiling cell types representing only two
nome-wide, tissue-specific RNA Polymerase occupancy in vivo without           cells per animal or 0.2% of the somatic cells. The specific advantages
cell isolation or nuclei purification [43]. In contrast to other methods,     and limitations of RAPID as compared to RNA-seq-based methods
which sequence transcripts from specific cell types, RAPID is based on        were extensively discussed in this previous work [43].
the methylation footprinting by an RNA polymerase subunit fused to

 Figure 1. Tissue-specific DamID schemes. A. DamID is used to identify genome-wide DNA-protein interactions in vivo. DNA adenine methyltrans-
 ferase (Dam) fused to a protein of interest (POI, here a subunit of the RNA polymerase) methylates GATC sites, forming unique flags to track genome
 regions where the POI was associated. B. Recombination-based transgenic approach for tissue-specific DamID. Tissue-specific DamID is achieved by
 in vivo CRE recombination in the tissue of interest, deleting a floxed mCherry::STOP cassette and enabling the transcription of the Dam::POI fusion or
 the Dam::GFP fusion, respectively. The later one is used to normalize for overall chromatin accessibility. Red arrows represent primers used to verify
 CRE recombination (see Fig. 4). C. Illustration of tissues already successfully used with tissue-specific DamID representing from 10% to 0.2% of the
 somatic cell content of the animal.

2                                                                                                                   J Biol Methods | 2021 | Vol. 8(3) | e152
                                                                     POL Scientific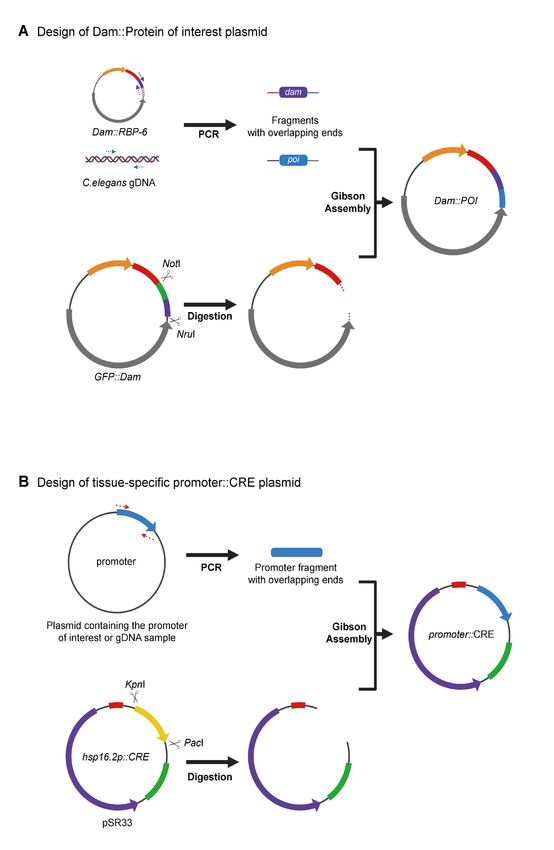
Protocol
    Although we applied this approach to RNA polymerase, the same              resolution substantially lower than a typical interval determined by ChIP.
approach can additionally be applied to profile the genome-wide in-                Methylation dynamics: Understanding the methylation dynamics is
teractions of any POI in a tissue-specific manner. Tissue-specific pro-        essential to plan and interpret DamID experiments. Three aspects are
filing requires only a modest number of animals (4000–5000), thereby           particularly important. First, the irreversibility of DNA methylation
reducing the time required to grow biological sample populations.              in C. elegans, which lacks any relevant DNA demethylase activity.
Additionally, we coupled the methylation footprinting method with              In a non-replicating C. elegans cell, methylation marks will therefore
long-read sequencing technology using Oxford Nanopore technologies             be irreversibly deposited. Second, the impact of DNA replication.
(ONT) [46]. This further reduces the data acquisition time, because se-        Methyl marks will stay until DNA replication occurs and one DNA
quencing can be performed in every laboratory without the requirement          strand is passively demethylated through the DNA replication process.
for a sequencing facility. Here, we present a bench protocol allowing          Hemimethylated DNA is not cut by DpnI and will remain undetected.
one to perform methyl footprinting from DNA extraction to amplicon             Third, considering cell populations, the average methylation at a giv-
sequencing in less than a week.                                                en site will build up over time. If Dam-POI interactions are transient
                                                                               or intermittent the level of methylation is expected to increase more
Tissue-specific DamID in C. elegans                                            slowly than for robust, long-lasting interactions. Consistent with these
    DamID requires the expression of a Dam fusion protein, which, if           theoretical considerations, the profiles obtained in post-mitotic cells
expressed at moderate to high levels, could in some instances lead to          of adult worms tend to be cleaner and with better correlation between
toxicity and potentially to mutations (data not shown) [42]. This is solved    replicates compared to those obtained in embryos [11,43], presumably
in C. elegans by the use of inducible promoters in the uninduced state         because the Dam-POI fusion protein has been expressed for a very
to achieve very low expression levels. These promoters are however             short time in the early stages of development with fast-replicating
broadly expressed and therefore unadapted for tissue-specific profiling.       cells. Eventually, a good knowledge about the timing of the cell lineage
In our tissue-specific DamID approach, the Dam-POI expression is driven        replication and the CRE transgene expression onset is essential to plan
by a heat shock promoter flanked in 5’ by a loxP-mCherry-STOP-loxP             DamID experiments and interpret their results.
cassette impairing its expression in non-target tissues (Fig. 1B). An ad-
ditional construct drives the CRE recombinase expression in a cell-type
specific manner, excising the STOP-cassette and thereby allowing basal                                     MATERIALS
expression of the Dam-POI. DamID requires a control for chromatin
accessibility, as methylation by the POI Dam fusion depends on it. As          Construction of DamID tissue-specific strains
a control for overall chromatin accessibility, we use a similar mCherry              9    Plasmid #506 [hsp-16.2p::loxP::mCherry::STOP::loxP::de-
floxed GFP-Dam construct, which is expressed in the same tissue in a                      gron::dam::rpb-6::unc-54 3’UTR]
control line treated in parallel.                                                    9    Plasmid #418 [hsp-16.2p::loxP::mCherry::STOP::loxP::de-
                                                                                          gron::gfp::dam::unc-54 3’UTR]
Critical aspects to consider before performing tis-                                  9    Plasmid pSR33 [hsp-16.2::egl-13nls::CRE::tbb-2 3’UTR]
sue-specific DamID                                                                   9    C. elegans gDNA or vector bearing the gene or promoter of
    DamID has many advantages, including its very low background                          interest.
noise and exquisite sensitivity. However, before embarking on the use                9    PacI restriction enzyme (R0547S, NEB)
of tissue-specific DamID, it is essential to be aware of its limits.                 9    KpnI restriction enzyme (R3142S, NEB)
    Steric effects of Dam fusion: One of the initial points to consider is           9    NruI restriction enzyme (R3192S, NEB)
whether the Dam should be fused at the N- or C-terminus of the POI,                  9    NotI restriction enzyme (R3189S, NEB)
in order to minimize the steric effect of the Dam and its impact on POI              9    Standard molecular biology reagents and materials of high
functionality, including its DNA-binding ability. This choice could                       analytic grade for cloning (primers to amplify the gene of
be potentially guided by pre-existing information on the functional                       interest, primers to amplify the promoter of interest, high-fi-
or binding domains of the POI, or by data from previous experiments                       delity polymerase, PCR-tubes, filter tips, micropipettes, LB-
in which fusion protein constructs have been functionally evaluated.                      Amp plates)
Even if a systematic comparison of N- and C-terminal fusion designs                  9    Thermocycler
on different transcription factors has shown robust target footprints                9    Gibson Assembly® Master Mix (E2611S, NEB)
regardless of the Dam position, the potential Dam steric effect remains              9    NEB® 5-alpha Electrocompetent E. coli (C2989K, NEB)
hard to predict and may vary on a case-by-case basis [47].                           9    Primer Dam-forward (5’-GAACCGCTACGGTTACAACGG)
    Spatial resolution: DamID spatial resolution depends on the density              9    Primer unc-54-reverse (5’-TAGGGGGTGGGAGCACAG)
of GATC sites in the genome. C. elegans has 269049 GATC motifs                       9    Primer M13 (-21) forward (5’-TGTAAAACGACGGCCAG)
per haploid genome [48], corresponding to a mean distance between                    9    Primer M13 (-40) reverse (5’-CAGGAAACAGCTATGACC)
sites of 374 bp and a median of 210 bp [49]. With this density, DamID                9    Standard materials and equipment for DNA agarose gel elec-
was successfully applied to obtain the genomic footprint of several                       trophoresis
transcription factors such as DAF-16 [13], CEH-60 [14] and CRH-1                     9    Materials required for Mos1-mediated Single-Copy Integration
(our unpublished data), as well as RNA Polymerases [43]. However,                         (MosSCI), including microinjection equipment, nematode
for most genomic regions the binding sites are defined as relatively                      host strains, co-injection plasmids [50].
large windows of several hundred bases, sometimes much larger in                     9    Reporter line SV1361 [rps-27p::loxP::NLS::mCherry::let858
some regions with low GATC density. This corresponds to a spatial                         UTR::loxP::NLS::GFP::let-858 UTR]

J Biol Methods | 2021 | Vol. 8(3) | e152                                                                                                              3
                                                                         POL Scientific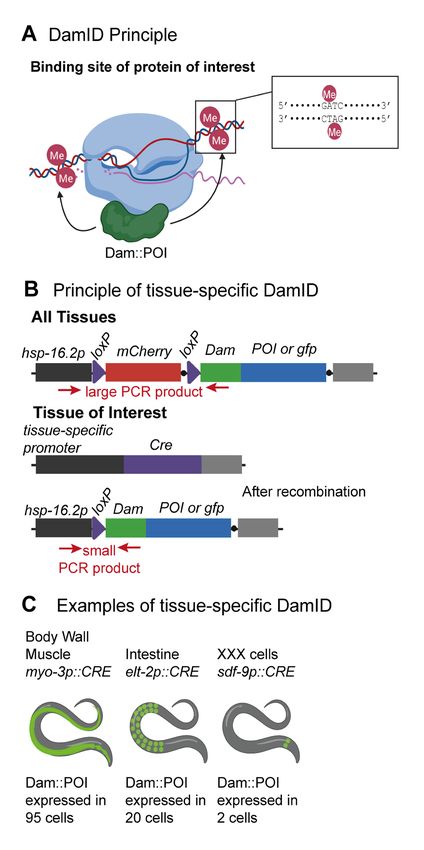
Protocol
Nematode culture                                                                       compatibles beads)
     9   NGM plates (100 mm)                                                       9   Magnetic particle rack for 1.5 ml tubes (e.g., 12321D, Thermo
     9   GM48 or GM119 (Dam-) E. coli available from https://www.                      Fisher Scientific or Z5342, Promega)
         dsmz.de/ or https://cgsc.biology.yale.edu/                                9   Qubit dsDNA BR Assay Kit (10146592, Thermo Fisher Sci-
     9   M9 buffer                                                                     entific)
     9   Tween 20                                                                  9   Tube Qubit assay thin-walled (12037609, Thermo Fisher
     9   13% w/v Sodium hypochlorite solution                                          Scientific)
     9   5 M KOH                                                                   9   Standard materials and equipment for DNA agarose gel elec-
     9   15 ml falcon tubes                                                            trophoresis
     9   1.5 ml microcentrifuge tubes
     9   15 ml serological pipettes                                        Multiplexed library preparation for DamID nanopore
     9   Glass Pasteur pipettes                                            sequencing
     9   P20, P200 and P1000 µl pipettes                                           9   NEBNext Ultra II End-Repair/dA-Tailing Module (E7546S,
     9   20, 200 and 1000 µl pipettes tips                                             NEB)
     9   Swinging bucket centrifuge (e.g., eppendorf microcentrifuge
         5804 R)                                                               NOTE: This module is part of the Ultra™ II workflow and
     9   Fixed-Angle centrifuge (e.g., eppendorf centrifuge 5415 D)            is compatible for library construction in both Illumina® and
                                                                               Oxford Nanopore Technologies® workflows.
Purification of gDNA
     9   DNeasy Blood and Tissue Kit (69504, QIAGEN)                               9   Ligation Sequencing kit (SQK-LSK109, ONT)
     9   RNase A (19101, QIAGEN)                                                   9   Native Barcoding Expansion kit (EXP-NBD104 [1-12] or
     9   Ammonium acetate 3 M                                                          EXP-NBD114 [13-24], ONT)
     9   Ethanol (Molecular biology grade)
     9   Heating block with shaking function (e.g., eppendorf Ther-            NOTE: Native Barcoding Expansion, is a kit to multiplex
         moMixerC)                                                             samples using PCR-free method to preserve additional in-
     9   Swinging bucket centrifuge (e.g., eppendorf microcentrifuge           formation such as base modifications. Using both expansion
         5804 R)                                                               kits (EXP-NBD104 and EXP-NBD114), there are 24 unique
                                                                               barcodes, allowing the user to pool up to 24 different samples
Digestion and purification of methylated DNA                                   in one sequencing experiment.
     9   DpnI restriction enzyme (R0176L, NEB)
     9   Thermocycler (e.g., Labcycler 48 Gradient-Thermal Cycler,                 9   Flow Cell Priming kit (EXP-FLP001, ONT)
         013-101, Witec AG)                                                        9   NEB Blunt/TA Master Mix (M0367S, NEB)
     9   Primers                                                                   9   NEBNext Quick Ligation Module (E6056S, NEB)
          • double-stranded adapters (ds-adapters)                                 9   AMPure XP 1.8 beads (A63880, Agencourt)
          • AdRt (5’-CTAATACGACTCACTATAGGGCAGCGTG-                                 9   Magnetic particle rack for PCR tubes (e.g., 492025, Thermo
            GTCGCGGCCGAGGA)                                                            Fisher Scientific or S1515S, NEB)
          • AdRb (5’-TCCTCGGCCG)                                                   9   Low Protein Binding (LoBind) Tubes (90410, Thermo Fisher
          • PCR primer                                                                 Scientific)
          • Adr (5’-NNNNGGTCGCGGCCGAGGATC; 50 μM)                                  9   0.2 ml UltraFlux SnapStrip PCR Tubes With Clear Flat Caps
     9   T4 DNA LIGASE (EL0013/10548730, Thermo Fisher Sci-                            (LC384, Labgene Scientific)
         entific)                                                                  9   Biosphere Quality Tips (70.1114.200, Biosphere)
     9   dNTPs PCR grade 4 × 25 μmol (11969064001, Sigma/Roche)                    9   Nanopore flow Cell (FLO-MIN106D, ONT)
     9   HiDi DNA polymerase (myPOLS#9001 M)                                       9   Thermocycler (e.g., Labcycler 48 Gradient-Thermal Cycler,
     9   Standard molecular biology reagents and materials of high                     013-101, Witec AG)
         analytic grade for digestion and PCR (0.2 ml PCR-tubes, filter            9   Standard molecular biology reagents and materials of high
         tips, micropipettes, 1.5 ml tubes)                                            analytic grade for library preparation (PCR-tubes, filter tips,
     9   Agencourt AMPure XP (A63880, Beckman Coulter, Inc.; or                        micropipettes, 1.5 ml tubes)

4                                                                                                                  J Biol Methods | 2021 | Vol. 8(3) | e152
                                                                  POL Scientific
Protocol
PROCEDURE AND ANTICIPATED RESULTS
The protocol presented below is visually summarized in Figure 2.
Figure 2. Overview of the entire tissue-specific DamID protocol. The scheme is divided into four main parts: I. Construction of DamID tissue-specific
plasmids and strains (step 1). II. Worm harvesting (step 2) and extraction of gDNA as starting material (step 3). III. Amplification of methylated fragments
(step 4), purification with magnetic beads (represented with a red magnet), and quantification with Qubit (represented with a blue square) and preparation
of multiplex libraries (step 5). IV. Sequencing of libraries using Nanopore technology (step 6) and data analysis (step 7).
1. Construction of DamID tissue-specific strains
The tissue-specific promoter driving the expression of CRE protein (promoter::CRE) is selected according to the
tissue to be studied (like for the examples in Fig. 1C). The CRE expression plasmid can be easily designed with
Gibson Assembly technology, allowing the fast and easy analysis of a POI in multiple tissues (Fig. 3).
NOTE: Pre-existing CRE expression lines containing single copy transgenes (Fig. 3 [43,51]) or integrated transgene
arrays [52] could potentially be used.
The plasmid expressing Dam-POI should be designed for each protein to analyse, whereas the GFP-Dam vector,
pCFJ150 hsp-16.2p::loxP::mCherry::STOP::loxP::gfp::dam::unc-58 3’ UTR [43], remains constant. Both plasmids
contain the loxP::mCherry::STOP::loxP cassette.
1.1. Using standard molecular cloning techniques clone the gene of interest into a Dam expression plasmid
of choice, e.g., plasmid #503 [pCFJ150 hsp-16.2p::loxP::mCherry::STOP::loxP::dam::rpb-6::unc-54
3’ UTR] or #418 [pCFJ150 hsp-16.2p::loxP::mCherry::STOP::loxP::gfp::dam::unc-54 3’ UTR], de-
pending on whether N- or C-terminal tagging is preferred [43,47]. Annotated plasmid sequences are
provided as supplementary material (File S1 and S2). The transgene must be under the control of an
inducible promoter with low basal activity and a characterized 3′UTR. The plasmids above include
the hsp-16.2 promoter and the unc-54 3’UTR (Fig. 3A).
1.2. Verify the sequence using primers that cover the insertion sites and the gene of interest. With the
plasmids above, primers Dam-forward and unc-54-reverse can be used.
1.3. Using standard molecular cloning techniques, such as Gibson Assembly, clone the promoter of interest
into a CRE expression plasmid of choice, e.g., pSR33 (Fig. 3B [51]).
J Biol Methods | 2021 | Vol. 8(3) | e152 5
POL ScientificProtocol
Figure 3. Design of the plasmids used in tissue-specific DamID. A. Outline of the Dam::POI (protein of interest) plasmid construction using Gibson
Assembly technology. Blue arrows represent the Gibson Assembly primers that amplify the gene of interest, violet arrows represent the Gibson Assembly
primers that amplify the dam gene. Scissors represent restriction sites for excision of gfp:dam fragment in pCFJ150 plasmid. Using Gibson Assembly
reaction, the gene of interest (blue) and the dam (violet) fragments are inserted in the pCFJ150 backbone. B. Outline of the tissue-specific CRE expression
plasmid construction using Gibson Assembly technology. Red arrows represent the Gibson Assembly primers to amplify the tissue-specific promoter of
interest. Scissors represent restriction sites for excision of hsp-16.2p in pSR33 plasmid. Using a Gibson Assembly reaction, a new promoter fragment
(blue) is inserted in the pSR33 backbone.
6 J Biol Methods | 2021 | Vol. 8(3) | e152
POL ScientificProtocol
1.4. Verify the sequence of the insertion. In the pSR33 backbone, M13 forward and M13 reverse primers
can be used for sequencing. Depending on the size of the inserted promoter, additional sequencing
primers may need to be designed.
1.5. Inject the DamID vectors into the gonad of an appropriate C. elegans host strain for MosSCI integration
and isolate transgenic lines according to standard MosSCI protocols [50]. Dam-POI constructs are inte-
grated either on chromosome II or IV and promoter::CRE constructs are integrated on chromosome X.
1.6. When designing new CRE drivers to target specific cell types, verify the correct localization and
recombination function of CRE in vivo, by crossing the promoter::CRE line with the reporter line
SV1361 available from CGC [51]. This reporter line ubiquitously expresses a nuclear red marker
from the [rps-27p::loxP::NLS::mCherry::let858 3'UTR::loxP::NLS::GFP::let-858 3'UTR] transgene.
Upon successful recombination of the mCherry cassette, CRE-expressing cells will start to produce
NLS::GFP, labeling the corresponding nuclei in green (Fig. 4B).
1.7. Cross the strains expressing Dam-POI and promoter::CRE to generate a line being homozygous for
both transgenes.
1.8. Using PCRs, verify the Dam-POI recombination causing the loxP::mCherry::STOP::loxP cassette
excision (Fig. 4A). The primers design must ensure that two amplification products are distinguished
(Fig. 1B): a small one, corresponding to the genomic DNA from the CRE-expressing tissues, for which
the mCherry cassette is excised; and a large one, corresponding to the rest of the tissues, in which
CRE is absent and the mCherry cassette is still present (Fig. 4A).
Figure 4. Verification of CRE-mediated recombination. A. Verification of recombination using PCR. Representative agarose gel electrophoresis results,
showing three successfully recombined samples (left lanes), a size ladder, and four controls. Primers should be designed to evaluate the presence or the
absence of loxP::mCherry::STOP::loxP cassette (as schematized in Fig. 1B). A successful PCR should generate two amplification products: a small one
(about 500 bp), corresponding to the gDNA from the CRE-expressing tissues for which the mCherry cassette is excised; and a large one (about 1700
bp), corresponding to the rest of the tissues in which the mCherry cassette is still present. Note: Although a smaller number of cells are expressing the
recombined product, the smaller PCR product tends to be more abundant due to PCR bias favoring the amplification of smaller products. B. Verification
of CRE-mediated recombination in the selected tissue with a reporter transgene. The depicted example shows the CRE expression in XXX neuroen-
docrine cells in vivo. An XXX-specific CRE driver strain using the sdf-9p promoter [DAG827; 43] was crossed with the reporter strain SV1361, which
carries a floxed mCherry::STOP cassette in front of an nls::gfp open reading frame. Upon successful recombination, the mCherry cassette is excised and
CRE-expressing cells produce NLS::GFP, here labeling XXX neuroendocrine nuclei (white arrow). The asterisks mark autofluorescence of intestinal cells.
2. Nematode culture
2.1. Collect embryos from asynchronous cultures by standard hypochlorite treatment.
2.1.1. Wash 3–4 mixed-stage 6 cm NGM plates containing many gravid adults with M9 and transfer
to a 15 ml Falcon tube.
2.1.2. Centrifuge at 400 g for 2 min in a swinging bucket centrifuge, and discard the supernatant using
a vacuum pump.
2.1.3. Wash animals twice with 14 ml M9 buffer. Each time, centrifuge at 400 g for 2 min and discard
the supernatant. Repeat if the solution is still cloudy, a sign that bacteria are still present.
J Biol Methods | 2021 | Vol. 8(3) | e152 7
POL ScientificProtocol
2.1.4. Add 2 ml of fresh bleach solution at room temperature (recipe for 5 ml: 3.5 ml Milli-Q water,
1 ml 13% sodium hypochlorite, 0.5 ml 5M KOH). Agitate the tubes by hand and vortex occa-
sionally (no more than 4 min; and no more than 4–6 strains at a time). Check worms regularly
with a dissecting stereoscope. When 60% of the worms are broken up, proceed to the next step.
In subsequent steps, work under sterile conditions to avoid contaminations with Dam positive
bacteria.
2.1.5. Add 13 ml Milli-Q water and completely resuspend the pellet to avoid worm death.
2.1.6. Centrifuge at 800 g for 1 min and discard supernatant.
2.1.7. Wash 5 times with 13 ml M9, centrifuge at 800 g for 1 min and discard supernatant. After the
last wash, resuspend in 5 ml of M9. Count the number of embryos in 2–10 μl aliquots.
2.1.8. Leave embryos to hatch overnight (14–16 h) at 16–20°C with gentle agitation on a roller.
2.1.9. Centrifuge at 600 g for 1 min and discard supernatant leaving about 1–1.5 ml to resuspend the
L1 larvae.
2.2. Count hatched L1s in 2–10 μl aliquots.
2.3. Place 1500–2000 L1 animals per 10 cm plate containing a thick lawn of Dam negative E. coli bacteria
(e.g., strain GM48, GM119) as a food source (prepared with 1 ml of a fresh Dam- overnight liquid
culture). Set at least two cultures per strain, as biological replicates.
2.4. Incubate worms at 15°C to 20°C and let them grow for two generations, making sure they never run
out of food.
2.5. Once the plate contains mainly gravid adults, wash the plates with M9 and transfer the liquid to a 15 ml
falcon tube.
2.6. Repeat steps 2.1 and 2.2.
NOTE: The first bleaching is to remove traces of OP50 Dam positive E. coli. This strain would create a high back-
ground Dam signal as methylated bacterial DNA is co-purified with the worm DNA. Animals are then grown with
GM48 Dam negative E. coli. We estimate that after 2 generations most remaining bacterial DNA is not methylated.
The second bleaching is to synchronize worm growth for the experiment.
2.7. Place 1000–1250 L1s per 10 cm plate containing a thick lawn of Dam negative E. coli bacteria (pre-
pared with 1 ml of fresh Dam negative strain grown overnight in LB and left to dry for 5 h to overnight
once spread on the plate). Use a total of four 10 cm-plates per strain and per biological replicate, in
order to grow a total of 4000–5000 worms for each replicate.
2.8. Incubate worms at 15°C to 20°C and collect animals when they reach the desired life stage (e.g., 74 h for
L4; 94 h for non-gravid young adults, etc.).
2.9. Harvest worms and wash them 5 times with 15 ml M9 to remove bacteria. Do not centrifuge, but let
worms go down by decantation; later wash worms 5–7 more times with M9 and centrifugation at 400 g
for 1 min. Keep the M9 at 15°C to avoid heat-shocking the animals.
2.10. After the last wash, resuspend the worms in less than 1.5 ml M9 and transfer the suspension to 1.5 ml
microcentrifuge tubes. Centrifuge at 13000 g for 30 s, discard supernatant and make aliquots containing
about 30–35 μl worm material. Remove as much as possible the excess liquid to obtain a worm pellet
of about 30 mg, snap-freeze in liquid nitrogen and store at −80°C until needed.
CRITICAL STEPS:
9 A GFP::Dam or Dam-only control, for each tissue, must be processed in parallel for each replicate.
9 Low growth temperature (15°C to 20°C) will prevent the induction of hsp-16.2p-driven transgenes. We have not
evaluated the effect of higher growth temperature, but we consider it might potentially increase methylation signal
background noise or trigger Dam::POI toxicity effect in case of higher transgene expression.
9 Performing a large number of washes and using decantation (instead of centrifugation) in the first five washes is
essential to avoid contamination with E.coli, which increases background during the DamID PCR (Fig. 5).
8 J Biol Methods | 2021 | Vol. 8(3) | e152
POL ScientificProtocol
9 If many worms are lost during washes as they stick to the plastic walls of the tubes during washing steps, a small
amount of detergent (0.01% Tween20) can be added to the M9. The use of glass pipettes similarly increases worm
recovery.
PAUSE POINT: Samples can be kept at −80°C until required.
3. Purification of gDNA
3.1. Purify genomic DNA (gDNA) from previously isolated 30 mg worm pellets. Use the DNeasy Blood
and Tissue Kit (QIAGEN #69504) with the enclosed protocol for purification of total DNA from
Animal Tissues (Spin-Column).
SPECIFIC STEPS:
9 The DNAeasy column should not be overloaded.
9 The ATL and AL buffers should be pre-warmed to dissolve precipitates.
9 All steps should be carried out as gently as possible to avoid gDNA shearing. The sample is only vortexed for the
addition of proteinase K.
9 Lysis with proteinase K is performed for 3 h in a shaking thermomixer, but can be extended for up to 6 h (see
critical steps below).
9 Add 4 µl of RNase A (100 mg/ml) after lysis.
9 To achieve complete elution of the DNA, the final elution is carried out in two successive rounds, first with 200
μl, then with 100 μl.
3.2. Measure gDNA concentration using Nanodrop or, for more consistent and accurate results, with a
DNA fluorometer (Qubit or equivalent).
NOTE: The expected yield is 3–5 μg and the concentration is expected to be below the minimal concentration of
200 ng/µl needed in step 4. Therefore, a concentration step using sodium acetate precipitation (see 3.3) is needed.
3.3. Precipitation with 3M sodium acetate:
3.3.1. Add 0.1 volume of 3M sodium acetate to your sample, and then 3 volumes of 96% ethanol (e.g.,
for a 300 µl sample, add 30 µl of 3M sodium acetate and 900 µl of 96% ethanol). Incubate at
−80°C overnight. Centrifuge 30 min at 4°C at 16000 g.
3.3.2. Remove supernatant (as much as possible).
3.3.3. Add 500 fresh and chilled 70% ethanol.
3.3.4. Centrifuge 15 min at 4°C at 16000 g.
3.3.5. Remove supernatant (as much as possible).
3.3.6. Let the pellet dry (do not overdry).
3.3.7. Add Milli-Q water or Tris 10 mM pH 8, incubate 1 min at room temperature and resuspend
well; aim for a final concentration of about 250 ng/µl.
3.3.8. Measure the concentration with Nanodrop, or better with Qubit or equivalent.
CRITICAL STEPS:
9 At the L1 or dauer stages, the cuticle is harder and more difficult to lyze. The proteinase K digestion step from
the DNeasy Blood and Tissue Kit can be extended to 6 h.
9 As quality control, 1 µl of gDNA can be run on a 1% agarose gel. gDNA should be visible as a single band at the
top of the gel without any smear of lower molecular weight fragments.
PAUSE POINT: gDNA can be stored at −80°C for at least 6 months.
J Biol Methods | 2021 | Vol. 8(3) | e152 9
POL ScientificProtocol
Figure 5. Standardization of DamID PCR. Examples of agarose gel electrophoresis analyses of amplified methylated fragments in tissue-specific DamID
samples and required controls (A, sample with methylated DNA, without DpnI but with ligase; B, sample with methylated DNA, with DpnI but without
ligase; C, sample with water, DpnI and ligase). The appropriate number of PCR cycles used to amplify the methylated fragments for each Dam-POI has
to be determined according to the tissue where it is expressed. A. Agarose gel showing the smear signal obtained for Dam::RBP-6 in XXX cells over
a range of 20 to 30 cycles. Several controls (A, B and C) are analyzed in parallel to the samples to rule out the production of non-DamID amplicons.
The cycle number selection is based on a strong signal for the sample (complete reaction: methylated DNA, DpnI and ligase) and an absence of signal
in the controls. B. Same as in A for muscle cells. One asterisk indicates the selected number of cycles for each tissue (24 for XXX cells; 22 cycles for
muscle cells). The cycle number selection is based on a strong signal for the sample and an absence of signal in the controls (A, B, C, and N2: sample
of unmethylated DNA, DpnI and ligase). Two asterisks indicate the cycle where a non-specific signal starts to be visible for one or more of the controls.
These might arise from contamination with methylated E. coli DNA (control A), gDNA breaks (control B) or contaminated reagents (control C or water),
as well as from non-specific amplicons arising from non-methylated worm DNA (control N2). C. Agarose gel showing amplicons obtained from DNA
of strains expressing different Dam-POI in two different cell types (each time two biological replicates). Left: amplicons obtained from strains with in-
testine-specific expression of Dam fusions to RPB-6 (RNA polymerase subunit 6), GFP (chromatin accessibility control) and LMN-1 (lamin). The RNA
polymerase subunit(RBP-6) produces stronger signals than LMN-1, associated with a shorter proportion of the genome. Right: amplicons obtained from
strains with XXX-specific expression of Dam fusions to RPB-6 (RNA polymerase), GFP (chromatin accessibility control) and CRH-1 (a transcription factor).
The RNA polymerase subunit (RPB-6) produces a stronger DamID signal than the CRH-1 transcription factor. D. Example of successful amplification
of Dam-methylated DNA after standardizations. Dam-POI and GFP-Dam experiments were processed and run in parallel with all technical controls.
Only a small volume of the preparation was analyzed on gel for this verification and the rest could be used for the DamID experiment. Methylated DNA
amplicons are visible as a smear (400–1200 bp range).
10 J Biol Methods | 2021 | Vol. 8(3) | e152
POL ScientificProtocol
4. Digestion and purification of methylated DNA
4.1. Digest 500 ng gDNA using 10 units DpnI (NEB #R0176S; cuts methylated GmATC).
4.1.1. Set up DpnI digestion reactions on ice (Table 1). Make sure to prepare additional tubes for
controls: (i) without DpnI (one control for each biological sample); (ii) for one of the biological
samples with methylated DNA, a second digestion replicate control digested with DpnI, which will
be later used without ligase (Fig. 5A).
Table 1. DpnI digestion mix.
Component Volume per reaction (μl) Final
10× CutSmart 1
DpnI (20 U/μl) 0.5
gDNA X (max. 8.5 µl) 500 ng
Nuclease-free water q.s. to 10 µl
4.1.2. Incubate 6 h at 37°C in a thermocycler.
4.1.3. Heat-inactivate the enzyme at 80°C for 20 min and cool at 4°C.
4.2. Prepare double-stranded adapters (ds-adapters, each at 50 μM final concentration).
4.2.1. Mix 50 μl of primer AdRt (100 μM) and 50 μl of AdRb (100 μM).
4.2.2. Anneal the primers in a thermocycler, using the following program: 95°C for 10 min and then
reduce 5 degrees every 1 min until 25°C, then 12°C forever (at least 10 min).
NOTE: The ds-adapter mix can be prepared in advance and kept frozen at −20°C.
4.3. Ligate the adapters to DpnI-digested DNA
4.3.1. Prepare the ds-adapter ligation reaction mix on ice (Table 2), as well as the control B (see above)
with DpnI-digested DNA, but without T4 DNA ligase.
Table 2. Ligation mix.
Component Volume per reaction (μl) Final
10× T4 ligase buffer 2 2x
T4 ligase 0.7
ds-adapters (50 μM) 0.6 3 μM
Nuclease-free water 6.7
4.3.2. Add 10 μl of the ligation mix to each sample (final volume 20 μl), as well as the 10 μl no ligase
control to the control B.
4.3.3. Incubate at 16°C overnight (at least 16 h) in a thermocycler.
4.3.4. Inactivate the T4 DNA ligase by incubating 10 min at 65°C.
4.4. Amplify methylated DNA using HiDi DNA polymerase and Adr primer (Table 3 and Table 4). Include
a “no DNA” control in which the DNA template is replaced with water (control C; Fig. 5A).
NOTE: Step 4 is subject to optimization in a sample-dependent manner (see critical steps below).
4.5. Verify each PCR reaction by loading 5 μl on a 1% agarose gel. Successful amplification of Dam-meth-
ylated DNA should yield a 400–1200 bp smear (Fig. 5C).
4.6. Purify the DNA with magnetic AMPure beads, following the AMPure XP 1.8× cleanup protocol de-
tailed below.
4.6.1. For each PCR reaction, transfer 45 μl of PCR product into a 1.5 ml microcentrifuge tube.
J Biol Methods | 2021 | Vol. 8(3) | e152 11
POL ScientificProtocol
Table 3. PCR-mix.
Component Volume per reaction (μl) Final
DNA (from ligation step) 20
10× HiDi PCR buffer 5 1×
dNTP Mix 2.5 mM 4 0.2 mM
Nuclease-free water 18.75
Adr (50 μM) 1.25 1.25 μM
HiDi DNA polymerase 1
Final volume 50
Table 4. PCR program (about 3 h).
Step Denaturation Annealing Extension
1 68°C for 10 min
2 94°C for 1 min 65°C for 5 min 68°C for 15 min
3 (4×) 94°C for 1 min 65°C for 1 min 68°C for 10 min
4 (20×) 94°C for 1 min 65°C for 1 min 68°C for 2 min
4.6.2. Briefly vortex the AMPure XP beads to resuspend them. Keep them on ice at all times.
4.6.3. Transfer 81 μl of bead suspension (corresponding to 1.8× the sample volume) into the tube
containing the sample and pipette up and down 10 times to mix thoroughly. Incubate at room
temperature for 5 min.
4.6.4. Transfer the tube to the magnetic stand and let it stand for at least 2 min for the beads to sepa-
rate. From this step onwards, do not move the tubes from the stand unless explicitly mentioned.
4.6.5. Gently pipette out the cleared solution, always taking care not to disturb the beads.
4.6.6. Add 200 μl of freshly prepared 70% ethanol solution to wash the beads. Incubate for at least 30 s.
Remove the supernatant. Repeat twice. (It is advisable to reach the bottom of the tube with the
pipette tip and then dispense the solution).
4.6.7. Take the tubes out of the magnetic stand and let it stand for 30–60 s with the lid open so as to
let the residual ethanol evaporate.
4.6.8. Elute by adding 30 μl of Milli-Q water or TE into the tube and resuspending the beads by pi-
petting (10 times).
4.6.9. Incubate at room temperature for 2 min and then place the tubes on the magnetic stand again.
4.6.10. Let the beads separate for 2 min and then slowly pipette out the eluted sample into a fresh micro-
centrifuge tube, recovering about 26–28 μl of purified DNA. Take care not to collect any bead.
4.7. Quantify DNA using Qubit. Concentration should be at least 20–50 ng/μl and the total amount > 0.08
pmol.
CRITICAL STEPS:
9 Do not vortex the sample at any step and only mix gently with a pipet to avoid shearing the gDNA.
9 All primers are HPLC-purified (IDT, Coralville, USA).
9 The first step of the PCR is an elongation from the ligated adapters. Therefore, the first step of the PCR is a 10
min incubation at 68°C, not a denaturation at 94°C.
9 It is useful to prepare double-stranded adapters in advance and keep them stored at −20°C (stored maximum 1 year).
12 J Biol Methods | 2021 | Vol. 8(3) | e152
POL ScientificProtocol
9 We currently use T4 ligase HC from Thermo Fisher (EL0013).
9 Step 4 is performed twice, first to standardize the number of PCR-cycles, which is optimized for each POI::Dam
expressed in a different tissue (Fig. 5A and 5B); and second to perform the experiment and continue with step 5
(Fig. 5C and 5D).
NOTE: To standardize the number of PCR-cycles, only change the last step in the PCR program. Collect 8 μl of
the amplicon after every 2 cycles ranging from cycle number 18 to 28 (last cycle); at cycle 28 background signal
in the N2 control begins to appear (Fig. 5B).
PAUSE POINT: Purified methylated fragments can be stored at −20°C up to 6 months.
5. Multiplexed library preparation for DamID Nanopore sequencing
The library preparation of DamIDseq uses the native barcoding genomic DNA workflow. In short, amplicon
ends are first repaired to create blunt-ended fragments and a single dA is added on both strands at the 3’ ends (step
5.1). This dA overhang is then ligated to a dT-tailed barcoded adapter (step 5.2). After purification, barcoded am-
plicons are pooled together in equimolar amounts and ligated to the sequencing adapter bound to the motor protein
necessary for nanopore sequencing (step 5.3).
5.1. End-repair
5.1.1. For each methylated fragment PCR sample, add 0.12 pmol diluted in 25 μl of Milli-Q water in
a 0.2 ml PCR tube. Prepare the End-repair master mix (multiply by [n samples + 0.2] to com-
pensate for pipetting errors during the distribution in single tubes) on ice and add 5 μl of the
mix to each amplicon sample (Table 5).
NOTE: To calculate the pmols of each sample, we consider an average length of 2000 bp for the amplicon size and
calculate the molarity of the purified DNA using the online tool dsDNA: Mass to/from Moles Convertor (https://
nebiocalculator.neb.com/).
Table 5. End-repair master mix.
Component Volume per reaction (μl)
0.12 pmol amplicon 25
Ultra II End-prep buffer 3.5
Ultra II End-prep enzyme 1.5
Final volume 30
5.1.2. Add 5 μl of the End-repair master mix to each 25 μl diluted amplicon PCR tube.
5.1.3. Mix gently by flicking the PCR tube, and quick spin to recover droplets.
5.1.4. Incubate at 20°C for 5 min in a thermocycler.
5.1.5. Inactivate the enzyme by incubating at 65°C for 5 min in a thermocycler.
5.1.6. Purify using magnetic beads:
5.1.7. (i) Add 1.8× volume (54 μl) of well resuspended AMPure XP beads. (ii) Incubate 10 min on the
rotator mixer for binding. (iii) Spin down the sample and pellet on a magnetic rack. Incubate at
least 5 min on the magnetic rack for the beads to separate. From this step onwards, do not move
the tubes from the stand unless explicitly mentioned. (iv) Gently pipette out the cleared solution,
always taking care not to disturb the beads. (v) Add 200 μl of freshly prepared 80% ethanol
solution to wash the beads. Incubate for at least 30 s and pipette out the cleared solution. (It is
advisable to reach the bottom of the tube with the pipette tip and then dispense the solution).
(vi) Repeat twice making sure no ethanol droplet is left on the tube walls. (vii) Take the tubes
out of the magnetic stand and let them dry for 5 min with the lid open so as to let the residual
ethanol evaporate. (viii) Elute with 11 μl of Milli-Q water into each tube and resuspend the
J Biol Methods | 2021 | Vol. 8(3) | e152 13
POL ScientificProtocol
beads by pipetting (10 times). (ix) Incubate at room temperature for 2 min and then place the
tubes on the magnetic stand again. (x) Let the beads separate for 2 min and then slowly pipette
out the eluted sample into a new 0.2 ml PCR tube, recovering about 10.5 μl of purified DNA.
Take care not to collect any bead with the eluate.
5.1.8. Use 1 μl to quantify DNA with Qubit. At least 50%–60% of input should be recovered.
CRITICAL STEPS:
9 Always set up the reactions on ice and perform the purification with magnetic beads at room temperature.
9 Be careful not to over-dry the magnetic pellet, because this may impede its complete resuspension.
9 It is advisable to finish the libraries on the same day, calculate the time well, considering the multiple purification
steps and quantifications with Qubit.
9 It is advisable to write down the concentrations obtained in each step, as well as essential annotations, for example,
the barcode used for each amplicon (next step).
5.2. Barcoding
5.2.1. Carefully record the barcode attribution for each amplicon sample.
5.2.2. Thaw barcodes at room temperature.
5.2.3. For each amplicon, prepare the mix on ice using a 0.2 ml PCR tube (Table 6).
5.2.4. Mix gently by flicking the PCR tube, and quick spin to recover droplets.
5.2.5. Incubate 10 min at 25°C using a thermocycler.
5.2.6. Purify using well resuspended magnetic beads (1.8× volume = 36 μl beads). Incubate 10 min on
the rotator mixer for binding and incubate at least 5 min on the magnet rack for bead collection.
5.2.7. Spin down the sample and pellet on the magnet rack. Incubate at least 5 min on the magnet
rack for bead collection.
5.2.8. Gently pipette out the cleared solution, always taking care not to disturb the beads.
5.2.9. Add 200 μl of freshly prepared 80% ethanol solution to wash the beads. Incubate for at least 30
s and pipette out the cleared solution. (It is advisable to reach the bottom of the tube with the
pipette tip and then dispense the solution).
5.2.10. Repeat twice making sure no ethanol droplet is left on the tube walls.
5.2.11. Take the tubes out of the magnetic stand and let them dry for 5 min with the lid open so as to
let the residual ethanol evaporate.
5.2.12. Elute with 11.5 μl of Milli-Q water into each tube and resuspend the beads by pipetting (10 times).
5.2.13. Incubate at room temperature for 2 min and then place the tubes on the magnetic stand again.
5.2.14. Let the beads separate for 2 min and then slowly pipette out the eluted sample into a new 0.2
ml PCR tube, recovering about 11 μl of purified DNA. Take care not to collect any beads with
the eluate.
5.2.15. Use 1 μl to quantify DNA with Qubit. You should recover > 0.011 pmol.
Table 6. Barcoding mix.
Component Amount per reaction (μl)
End-repaired amplicons 9
Barcode (ONT) 1
NEB/Blunt TA master mix 10
Final volume 20
14 J Biol Methods | 2021 | Vol. 8(3) | e152
POL ScientificProtocol
CRITICAL STEPS:
9 For the barcoding mix, use as much as possible End-repaired amplicons, with a maximum of 0.038 pmol.
9 Always perform the reactions on ice and the purification with magnetic beads at room temperature.
9 Be careful not to over-dry the magnetic pellet, because this may impede its complete resuspension.
TROUBLESHOOTING: If the end-repaired amplicon concentration is too low, the barcoding reaction can be
scaled up 1.5 times (using 13.5 μl of end-repaired amplicons).
5.3. Multiplexed library preparation
5.3.1. Using a DNA low-binding 1.5 ml tube, combine equivalent amounts (same mass) of the different
libraries in 65 μl final volume, adding water to complete.
NOTE: To calculate the pmols of each sample, we consider an average length of 1000 bp for the amplicon size and
calculate the molarity of the purified DNA using the online tool dsDNA: Mass to/from Moles Convertor (https://
nebiocalculator.neb.com/). At this stage, there is only one tube for several libraries. You can typically combine up
to 12 libraries, ensuring that sufficient samples are combined to produce a pooled sample comprising at least 0.15
pmol of each library, but without exceeding a total mass of 1.5 μg DNA.
5.3.2. Prepare the adapter ligation mix on ice (Table 7).
5.3.3. Incubate 10 min at 26°C in a thermocycler.
5.3.4. Purify the library with magnetic AMPure XP beads: (i) Add 1.2× volume (120 μl) of well-re-
suspended magnetic beads. (ii) Incubate 5 min on the rotator mixer for binding. (iii) Spin down
the sample and pellet on the magnet rack. Incubate at least 5 min on the magnet rack for bead
collection and remove the supernatant. (iv) Wash beads with 250 μl of SFB buffer (ONT), not
ethanol (critical step). Resuspend by flicking well. (v) Spin down the sample and pellet on the
magnet rack for at least 5 min. (vi) Repeat wash with SFB buffer. (vii) Spin down the sample
and pellet on the magnet rack for at least 5 min. (viii) Remove residual supernatant. (ix) Dry
30 s after the second wash, remove droplets on the sides of the tubes using vacuum suction. Do
not overdry the pellet. (x) Remove from magnetic rack, elute and resuspend in 15 μl EB (ONT).
(xi) Incubate 10 min at room temperature. (xii)Put in the magnetic rack for pellet formation,
transfer 14.5 μl in a DNA low-binding PCR tube and keep on ice. The library is ready to load
onto the flow cell.
Table 7. Adapter ligation mix.
Component Volume per reaction (μl)
Pooled barcode sample 65
Adapter Mix II (AMII, ONT) 5
NEBNext ligase buffer (5×) 20
Quick T4 DNA Ligase 10
Final volume 100
CRITICAL STEPS:
9 SFB and EB buffers should always be kept on ice once thawed.
9 Washes should be performed with an SFB buffer. Ethanol can denature the motor protein on the sequencing
adapters, producing pore occupancy close to 0. Therefore it is necessary to make the wash step after sequencing
adapter ligation with the SFB buffer. SFB (Short Fragment Buffer) is used to retain DNA fragments of all sizes.
If you need to enrich DNA fragments of 3 kb or longer, it is recommended to use LFB (Long Fragment Buffer).
This purification is the most critical step in the protocol.
J Biol Methods | 2021 | Vol. 8(3) | e152 15
POL ScientificProtocol
9 Optionally the library can be quantified to check the DNA concentration. The total amount should be about 430 ng.
TROUBLESHOOTING: For high molecular weight DNA, incubating at 37ºC with EB can improve the recovery
of long fragments.
6. Sequencing
6.1. Priming and loading the spotON flow cell. A detailed protocol can be download from the ONT website
(https://community.nanoporetech.com/):
6.1.1. Thaw the Sequencing Buffer (SQB), Loading Beads (LB), Flush Tether (FLT) and one tube of
Flush Buffer (FB) at room temperature and thereafter keep the tubes on ice.
6.1.2. Mix the SQB and FB tubes by vortexing, and FLT by pipetting, spin down and return to ice.
6.1.3. Open the lid of the nanopore sequencing device and slide the flow cell’s priming port cover
clockwise so that the priming port is visible.
6.1.4. Check for any small bubble under the cover.
If needed, draw back a small volume to remove any bubble (a few µls) as follows:
9 Set a P1000 pipette to 200 µl.
9 Insert the tip into the priming port.
9 Turn the wheel until the dial shows 220–230 µl, or until a small volume of buffer enters the pipette tip.
9 Visually check that there is a continuous buffer from the priming port across the sensor array.
9 Check for any small bubble under the cover.
6.1.5. Prepare the flow cell priming mix: Add 30 µl of FLT directly to the tube of FB, and mix by
pipetting up and down.
6.1.6. Load 800 µl of the priming mix into the flow cell via the priming port, avoiding the introduction
of air bubbles (with spotON closed). Wait for 5 min.
6.1.7. Thoroughly mix the contents of LB by pipetting.
6.1.8. In a new tube, prepare the library mix for loading (Table 8).
6.1.9. Complete the flow cell priming. Open the spotON port.
6.1.10. Add 200 μl of priming mix to the priming port (not the spotON port). Avoid the introduction
of air bubbles.
6.1.11. Mix the library by pipetting and add 75 μl in dropwise fashion to the spotON port.
6.1.12. Close spotON and priming ports.
Table 8. Library sequencing mix.
Component Volume per sample (μl)
SQB (ONT) 37.5
LB (ONT) 25.5
Pooled library 12
Final volume 75
6.2. Starting sequencing run.
6.2.1. Turn on MinIT/computer/plug Minion.
6.2.2. Choose the flow cell type and check the “Available” box.
16 J Biol Methods | 2021 | Vol. 8(3) | e152
POL ScientificProtocol
6.2.3. Make a hardware check of the Minion using the Configuration Test Cell. The flow cell must
have >1000 active pores.
6.2.4. Click the “New Experiment” button at the bottom left of the GUI.
6.2.5. Select the running parameters for your experiment (FASTQ or FAST5).
6.2.6. Click “Start run”. We estimate that a good library should have at least 10 million reads after
an overnight run.
CRITICAL STEPS:
9 The array of pores must be covered by buffer at all times. When you remove more than 20–30 µl (step 6.1.4) you
can damage the pores in the array.
9 Perform all pipetting with great care not to introduce bubbles.
9 The LB tube contains a suspension of beads. It is vital that they are mixed immediately before use.
9 If you want to reuse the flow cell, please follow the manufacturer’s Wash Kit instructions after the sequencing
experiment, and store the washed flow cell at 2°C to 8°C.
7. Sequencing data analysis
Oxford Nanopore raw signal data are stored in a compressed format called fast5. Before using it, the base
sequence has to be extracted from this raw signal in a process called basecalling. Additionally, as one flow cell
is sufficient to sequence at least 8 different libraries at once using barcoding, each sequence has to be assigned to
a given barcode, a process called demultiplexing. The following sequence analysis steps contain the parameters
used for the analysis in [43] and are available at https://github.com/CellFateNucOrg/basic_ont/releases/tag/v1.0,
including the ad hoc R filtering script.
7.1. Basecalling
7.1.1. Basecalling is carried out using a continuously developed software provided by ONT called
Guppy. Guppy works best on computers with Graphics Processing Units (GPUs) and can be
downloaded for free from the Community webpage at Oxford Nanopore (https://community.
nanoporetech.com/downloads [requires free registration]). ONT provides up-to-date models
(called configurations) for the raw signal to base conversion, depending on the flow cell version.
The basecaller also provides options for quality score filtering of the basecalled sequences. A
minimal quality score of 3 is a good compromise between sequence quality and the number of
recovered sequences.
7.1.2. guppy_basecaller:
--input_path insert input_path;
--save_path insert destination fastq path;
-c insert location of the configuration file;
--records_per_fastq insert the number of reads per output fastq file;
--compress_fastq #destination fastq file should be gzip compressed;
--recursive #guppy will look for fast5 files in all folders inside the input path;
--qscore_filtering #guppy will apply basecall quality score filtering;
--min_qscore 3 #a quality score of 3 is required for the sequence to be kept;
--device auto #if using GPU, guppy will chose automatically available GPUs.
7.2. Quality check
7.2.1. Global read qualities can be assessed using pycoQC, a QC mapper specifically developed for
ONT sequencing data. pycoQC is freely available here: https://pypi.org/project/pycoQC/.
7.2.2. pycoQC:
-f insert fastq directory/sequencing_summary.txt;
-o insert path and name of QC file;
--report_title name the report;
--min_pass_qual 3 #this is the min_qscore applied above.
J Biol Methods | 2021 | Vol. 8(3) | e152 17
POL ScientificProtocol
7.3. Demultiplexing
7.3.1. Splitting the sequences based on their barcode is done using another part of guppy, the gup-
py-barcoder command. guppy-barcoder requires the user to enter the name of the barcoding kit
and will output the number of sequences for each output and a folder for each barcode which
was found.
7.3.2. guppy_barcoder:
-i insert fastq directory;
-s insert barcoded destination fastq directory;
--recursive #guppy looks for fastq files in folders inside the fastq directory;
-q 40000 #number of reads per barcoded fastq file;
--compress_fastq #destination fastq file should be gzip compressed; (vi) --device auto #if using GPU,
guppy will chose automatically available GPUs;
--barcode_kits “EXP-NBD104” #barcoding kit used.
7.4. Read mapping
7.4.1. Although a number of read mappers have been initially used for long read sequences, the current
best in class is minimap2 [53] and can be obtained here: https://github.com/lh3/minimap2. As
for basecalling, a threshold for mapping quality is required, classically put to 30. Minimap2
requires a genome file to map to in fasta format.
7.4.2. minimap2:
-ax map-ont #minimap can map short or different types of long reads. This is the option for ONT reads;
genomeFile #fasta file with chromosomal sequences;
path_to_fastq_files #provide the path and file names for fastq files;
The result can be directly piped to samtools for quality filtering
| samtools view -q 30 -u - #the -u option outputs uncompressed bam files for fast subsequent use and
pipe for sorting | samtools sort -T insert temporary file name pass_${bc} -o insert output folder/name.
7.5. DamID Read filtering
7.5.1. DamID amplicons should start and end with a GATC motif. If one or both ends does not, the
amplicon likely originates from the ligation of a DNA break to the DamID adapter (step 1.27
above). Sequencing reads are therefore filtered based on the presence of a GATC close to the
end of the read, as the sequences sometimes align with neighbouring bases and do not exactly
end at the GATC. We consider reads for which both ends fall +/- 8 bp to a GATC as valid DamID
reads. All other reads are discarded. Filtering is done using a custom R script.
7.6. DamID signal determination
7.6.1. The DamID profile is classically calculated as the log2 ratio between the Dam signal of the
protein of interest and a freely moving Dam, here fused to GFP (this method is described as
rpm normalization). This normalizes for chromatin accessibility, as DNA in euchromatic re-
gions is more accessible and will therefore be easier to methylate than DNA in less accessible
heterochromatic regions. The pipeline described in [54] can be used for C. elegans, using the
bam files generated by the previous step as starting point. It can be downloaded from https://
github.com/owenjm/damidseq_pipeline. As mentioned in [43], this is done with parameters:
–bamfiles –extend_reads = 0 --norm_method rpm.
7.6.2. For certain Dam fusion proteins, the DamID profile is highly correlated with open chromatin
(e.g., RNA polymerase since transcribed genes are typically open chromatin accessible to
the free Dam). If the classical normalization method were to be used, this would lead to an
artificial reduction of the Dam signal [discussed in detail in 54]. To mitigate this problem, the
above-mentioned pipeline first provides a value for the correlation between the free Dam and
the POI Dam fusion libraries. If libraries are highly correlated (R > 0.7), an alternative method
based on kernel normalization is used to calculate the log2 ratio between the Dam fusion and
the free Dam signal [54] (option --norm_method kde).
7.6.3. For all normalization methods, the damid-seq pipeline directly provides a normalized profile
in bedGraph format, which can be visualized in a genome browser such as igv (http://software.
broadinstitute.org/software/igv/) or used for downstream analysis.
18 J Biol Methods | 2021 | Vol. 8(3) | e152
POL ScientificYou can also read