Synoptic atmospheric circulation patterns associated with deep persistent slab avalanches in the western United States - Recent
←
→
Page content transcription
If your browser does not render page correctly, please read the page content below
Nat. Hazards Earth Syst. Sci., 21, 757–774, 2021
https://doi.org/10.5194/nhess-21-757-2021
© Author(s) 2021. This work is distributed under
the Creative Commons Attribution 4.0 License.

Synoptic atmospheric circulation patterns associated with deep
persistent slab avalanches in the western United States
Andrew R. Schauer1 , Jordy Hendrikx1 , Karl W. Birkeland2,1 , and Cary J. Mock3
1 Snow and Avalanche Lab, Department of Earth Sciences, Montana State University,
P.O. Box 173480, Bozeman, MT 59717, USA
2 USDA Forest Service National Avalanche Center, P.O. Box 130, Bozeman, MT 59771, USA
3 Department of Geography, University of South Carolina, Columbia, SC 29208-0001, USA

Correspondence: Andrew R. Schauer (andrew_schauer@hotmail.com)

Received: 10 September 2020 – Discussion started: 8 October 2020
Revised: 7 January 2021 – Accepted: 11 January 2021 – Published: 25 February 2021

Abstract. Deep persistent slab avalanches are capable of          commonly precede deep persistent slab avalanche activity.
destroying infrastructure and are usually unsurvivable for        By identifying these patterns, we provide an improved un-
those who are caught. Formation of a snowpack conducive           derstanding of deep persistent slab avalanches and an addi-
to deep persistent slab avalanches is typically driven by me-     tional tool to anticipate the timing of these difficult-to-predict
teorological conditions occurring in the beginning weeks to       events.
months of the winter season, and yet the avalanche event may
not occur for several weeks to months later. While predict-
ing the exact timing of the release of deep persistent slab
avalanches is difficult, onset of avalanche activity is com-      1   Introduction
monly preceded by rapid warming, heavy precipitation, or
high winds. This work investigates the synoptic drivers of        Deep persistent slab avalanches are challenging to predict
deep persistent slab avalanches at three sites in the western     and generally more destructive than other snow avalanche
USA with long records: Bridger Bowl, Montana; Jackson,            types. They threaten infrastructure, transportation, and recre-
Wyoming; and Mammoth Mountain, California. We use self-           ationists in snow-covered mountain regions around the
organizing maps to generate 20 synoptic types that summa-         world (McClung and Schaerer, 2006). Deep persistent slab
rize 5899 daily 500 mbar geopotential height maps for the         avalanches occur due to two different mechanisms, depend-
winters (November–March) of 1979/80–2017/18. For each             ing on whether they are primarily dry or wet. Dry deep
of the three locations, we identify major and minor deep per-     persistent slab avalanches occur when a weak layer in the
sistent slab avalanche seasons and analyze the number of          snowpack fails due to applied stress from an external load
days represented by each synoptic type during the beginning       such as new and wind-transported snow, cornice fall, explo-
(November–January) of the major and minor seasons. We             sives, or the weight of a human. In wet deep persistent slab
also examine the number of days assigned to each synoptic         avalanches, the weak layer typically fails due to the introduc-
type during the 72 h preceding deep persistent slab avalanche     tion of liquid water to the snowpack, which deteriorates the
activity for both dry and wet slab events. Each of the three      bonds between grains in the weak layer such that the weak
sites exhibits a unique distribution of the number of days as-    layer can no longer support the weight of the overlying slab
signed to each synoptic type during November–January of           (Baggi and Schweizer, 2009; Marienthal et al., 2012; Piet-
major and minor seasons and for the 72 h period preceding         zsch, 2009).
deep persistent slab avalanche activity. This work identifies        A snowpack conducive to deep persistent slab avalanches
the synoptic-scale atmospheric circulation patterns contribut-    is characterized by two key features: (1) a persistent weak
ing to deep persistent slab instabilities and the patterns that   layer of snow that exists in the snowpack for days, weeks,
                                                                  or even months after it is buried and (2) a thick, cohesive

Published by Copernicus Publications on behalf of the European Geosciences Union.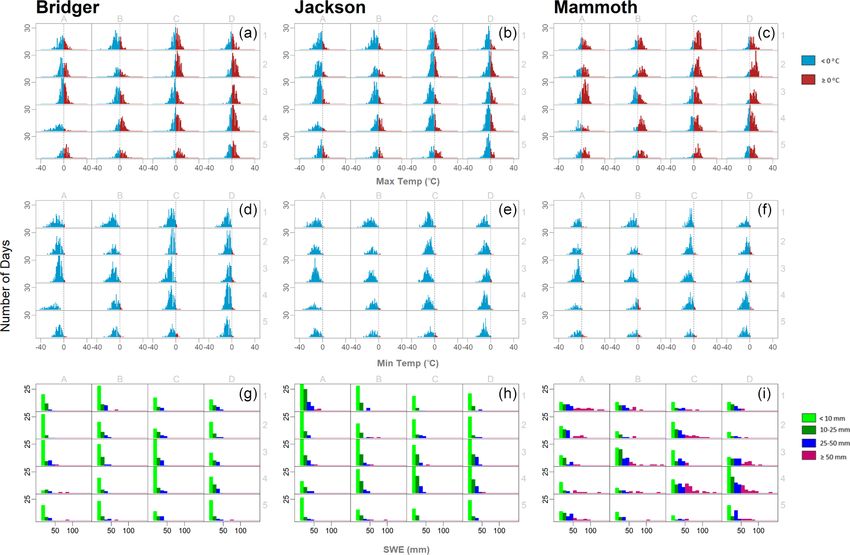
758      A. R. Schauer et al.: Synoptic atmospheric circulation patterns associated with deep persistent slab avalanches

slab of snow overlying that persistent weak layer. Although        making tool to aid in forecasting deep slab avalanches. Their
there is no specific universal slab thickness threshold defin-     tool uses snowpack properties, weather history, and recent
ing the difference between a persistent slab avalanche and a       avalanche activity to correctly predict deep slab avalanche
“deep” persistent slab avalanche, previous research has in-        activity for 77 out of 103 d – roughly 75 % of the days used
vestigated events with minimum crown depths ranging from           in their study.
0.8 to 1.2 m (Conlan and Jamieson, 2016; Conlan et al., 2014;         A large amount of variability in surface meteorology of
Marienthal et al., 2015; Savage, 2006).                            the western USA, and subsequently snow stratigraphy, is
   The relationship between slab depth and snow stability is       driven by synoptic-scale upper atmospheric circulation pat-
complex. Although the crack length required for onset of           terns. Upper-level air movement is a major driver of uplift,
fracture propagation within a weak layer tends to decrease         which promotes cloud formation and precipitation, as well
with increasing slab thickness and density, crack length tends     as subsidence, which facilitates drier conditions (Barry and
to increase with increasing slab stiffness (Gaume et al.,          Chorley, 2003). Air mass trajectories play an important role
2017). Schweizer and Camponovo (2001) found that when              in orographic precipitation processes, with the largest pre-
a load is applied at the snow surface, the area affected by that   cipitation events occurring when a mountain range is ori-
load increases with depth, effectively decreasing the magni-       ented perpendicularly to the direction of the upper-level flow
tude of stress with depth. In their experiments, stresses mea-     (Birkeland et al., 2001). Winter precipitation over the west-
sured at 1 m depth were equal to roughly 10 % of the applied       ern USA reveals spatially heterogeneous responses between
load at the surface. Additionally, as slab stiffness increases,    northern and southern regions, with positive precipitation
stress is more effectively dispersed with depth, which results     anomalies in one region coinciding with negative anomalies
in an additional decrease in applied stress at the buried weak     in the other. This phenomenon is driven by semi-permanent
layer (Thumlert and Jamieson, 2014). The result of these pro-      upper-level circulation patterns, which tend to favor precip-
cesses is that as the depth to the weak layer increases, it        itation over either northern or southern regions but seldom
becomes increasingly difficult to initiate failure in a weak       both (Dettinger et al., 1998; Wise, 2010).
layer, yet propagation often becomes more likely. This leads          The field of synoptic climatology relates synoptic-scale
to large uncertainty concerning the exact timing of deep slab      upper atmospheric circulation to the surface environment, in-
release, making these events particularly difficult to predict.    cluding characterizing avalanche activity in the western USA
   Formation of a snowpack conducive to deep persistent slab       (Birkeland et al., 2001); the Selkirk Mountains of British
avalanches is typically controlled by meteorological condi-        Columbia, Canada (Fitzharris, 1987); Norway (Fitzharris and
tions occurring during the early months of the winter season       Bakkehøi, 1986); Iceland (Keylock, 2003); and the Presiden-
(Marienthal et al., 2015), with low snow accumulation and          tial Range in the northeast USA (Martin and Germain, 2017).
cold temperatures driving weak-layer development near the          These studies identify significant avalanche events based
ground. Onset of slab avalanche activity is commonly pre-          on magnitude, frequency, destruction, or fatalities. However,
ceded by new or wind-transported snow loading, rapid warm-         there is no research to date relating upper-atmosphere circu-
ing, or rain-on-snow events (Conlan et al., 2014; Davis et al.,    lation patterns specifically to slab avalanches failing on deep
1999; Marienthal et al., 2012). It is often the case that a weak   persistent weak layers. This work addresses that knowledge
layer will facilitate widespread avalanche activity when it is     gap, with the goal of providing an additional tool for fore-
initially buried and transition to a period of dormancy where      casting these difficult-to-predict events through a better un-
avalanches are less common as the thickness of the overlying       derstanding of the processes that drive them. This study ex-
slab increases (Statham et al., 2018). Such a snowpack may         amines upper-air synoptic patterns associated with deep per-
even undergo multiple loading events with little or no result-     sistent slab avalanches for three sites in the western USA.
ing avalanche activity before being pushed to its breaking         We identify synoptic circulation types that commonly occur
point, resulting in a widespread avalanche cycle (e.g., Mari-      early in the season during years with increased deep persis-
enthal et al., 2012).                                              tent slab activity, as well as those that occur commonly in the
   Associations between meteorological events and slab             days immediately prior to deep persistent slab events.
avalanche activity have long been used as a tool to aid
in avalanche forecasting (e.g., Atwater, 1954; LaChapelle,
1966; LaChapelle, 1980), but extending this approach to per-       2     Study locations and methods
sistent deep slab avalanches is not as well understood. Recent
research has studied meteorological thresholds prior to the        2.1    Study locations
onset of avalanche activity, highlighting the importance of
precipitation totals, daily maximum temperatures, and rain         This research focuses on three ski areas in the western USA:
events in time periods ranging from 24 h to 7 d prior to on-       Bridger Bowl, Montana; Jackson Hole, Wyoming; and Mam-
set of activity (e.g., Marienthal et al., 2015; Conlan et al.,     moth Mountain, California. The Bridger Bowl ski area is
2014; Savage, 2006). Conlan and Jamieson (2017) used sur-          located on the east side of the Bridger mountain range in
vey data from avalanche professionals to develop a decision-       southwest Montana approximately 27 km north of Boze-

Nat. Hazards Earth Syst. Sci., 21, 757–774, 2021                                   https://doi.org/10.5194/nhess-21-757-2021
A. R. Schauer et al.: Synoptic atmospheric circulation patterns associated with deep persistent slab avalanches                 759

Table 1. Length of avalanche and meteorological records used at
each study site.

  Location             Avalanche record   Meteorological record
  Bridger Bowl         1979/80–2017/18      1979/80–2017/18
  Jackson Hole         1979/80–2017/18      1979/80–2017/18
  Mammoth Mountain     1979/80–2017/18      1982/83–2013/14

man (45.8174◦ N, 110.8966◦ W) with a summit elevation
of 2652 m and base elevation of 1859 m (Fig. 1). Jackson
Hole Mountain Resort is located in western Wyoming in the
Teton Range (43.833◦ N, 111.871◦ W). The base elevation
at Jackson Hole is 1924 m, and the summit rises to 3185 m.
The Grand Targhee ski area is located in the same moun-
tain range approximately 20 km (12 mi) northwest of Jack-
son Hole. Due to their close proximity, the records for both
of these ski areas are used to describe avalanche activity in
the Jackson area for this analysis. Mammoth Mountain Ski
Area is located in the Sierra Nevada range in central Cali-
fornia (37.630◦ N, 119.050◦ W) with a summit elevation of
3698 m and a base elevation of 2424 m. Bridger Bowl and
Jackson Hole typically fall within the intermountain snow
climate regime (Mock and Birkeland, 2000), characterized
by cool winter temperatures and moderate to heavy seasonal
snowfall. Mammoth Mountain lies within the coastal snow
climate zone, with high seasonal snowfall totals, relatively
warm temperatures, and somewhat regular rainfall events
                                                                   Figure 1. Location map of the sites used in this study. Geographic
during the winter season (Mock and Birkeland, 2000). We            data from US Census Bureau (2017) and USGS National Center for
selected these study sites because they cover a broad ge-          EROS (2005).
ographical extent within the western USA and have some
of the longest-term and most consistent meteorological and
avalanche data available.
                                                                   by intentionally triggering many small avalanches through-
2.2   Meteorological and avalanche records                         out the season, with the goal of avoiding a large avalanche
                                                                   later in the season. A ski resort will also have a higher rate
Professional ski patrollers collect daily meteorological and       of skier compaction, although the effect of this on stabil-
avalanche data at each study site. This research uses the daily    ity is not always clear, and there are well-documented in-
data from 1 November to 31 March for each operational sea-         cidents of large avalanches failing on heavily compacted
son. The operational season depends on snow coverage, so           slopes (e.g., Marienthal et al., 2012). Although mitigation
November data are somewhat sparse for most seasons, de-            programs continue to become more effective, deep persis-
pending on the season’s opening date. The data record for          tent slab avalanches remain a challenging problem, and there
each site ranges from 32 to 39 seasons (Table 1). Though           is not an obvious trend over time towards decreasing (or in-
data are available for earlier years at each site, we did not      creasing) frequency of such events (Fig. 4).
use them due to the necessity of aligning the data with at-           Individual avalanches are characterized by crown depth,
mospheric data (discussed in the next section) and to reduce       bed surface, avalanche type, and relative (R) size (Ameri-
apparent state changes in the record due to migration of in-       can Avalanche Association, 2016). In most cases, observers
strument location and changes in recording practices.              record some but not all of these values for an avalanche.
   We use ski patrol records as they are virtually the only type   Additionally, observers cannot always ascertain whether
of record in the USA which has a recording rate that is not        avalanches fail within the old snow versus at the inter-
dependent on fatalities, injuries, or damage to infrastructure.    face between old and new snow. For this reason, we only
However, there is a distinct difference between a snowpack         use the “old snow” bed surface designation in conjunction
within the boundaries of a ski area with an active avalanche       with other indicators of deep persistent slabs (e.g., type is
mitigation program and a backcountry snowpack. Active mit-         “hard slab”, crown depth ≥ 0.9 m, and R size ≥ 4). When
igation programs reduce the risk to clients and infrastructure     observers designate the bed surface as “ground”, it indicates

https://doi.org/10.5194/nhess-21-757-2021                                    Nat. Hazards Earth Syst. Sci., 21, 757–774, 2021
760 A. R. Schauer et al.: Synoptic atmospheric circulation patterns associated with deep persistent slab avalanches
that an avalanche failed deep within the snowpack, even if Table 2. DSAI score for each R-size designation.
there is some uncertainty as to exactly which layer failed.
We used the recorded avalanche type to separate slab and Avalanche R size DSAI score
loose avalanches, as well as wet and dry. The classification 1 0.01
between “wet” and “dry” avalanches is most commonly as- 2 0.1
sessed at the start zone, although it may also be based on 3 1
observations from the track or the deposition area. R size is 4 10
based on a visual assessment of size relative to the slide path. 5 100
US avalanche professionals regularly use this size classifica-
tion, and we use the scores as recorded except for apparent
errors (noted in Appendix B of Schauer, 2019). slab avalanches for which crown depth exceeds 0.9 m, the
avalanche is classified as a hard slab, the bed surface is des-
2.3 Synoptic data ignated as old snow, and the R size is greater than or equal to
4.
We obtained synoptic atmospheric data from the National
As a final step, we inspect events identified using our clas-
Centers for Environmental Prediction/National Center for
sification criteria manually to ensure that the events retained
Atmospheric Research (NCEP/NCAR) Reanalysis dataset
are in fact deep persistent events. Though it is possible these
(Kalnay et al., 1996), which includes daily 500 mbar geopo-
criteria may omit a small number of ambiguous or smaller-
tential height values on a 2.5◦ × 2.5◦ grid extending from 20
magnitude events, we maintain that including such events in
to 70◦ N latitude and 160◦ E to 60◦ W longitude. A 1197-
our record of deep persistent slab events would increase un-
cell grid describes the spatial distribution of the atmospheric
certainty in our analysis and make it difficult to assess atmo-
conditions for each day. The spatial extent of this study area
spheric patterns related specifically to deep persistent slab
is similar to previous synoptic studies (e.g., Mock and Birke-
events.
land, 2000; Wise and Dannenberg, 2014). We used daily data
for the winter season from 1 November–31 March to cor- 2.5 Deep slab activity index
respond with the meteorological and avalanche data and to
avoid a seasonal signal in the circulation patterns after Yarnal Each avalanche classified as a deep slab event is scored
(1993). based on the size of the avalanche using the avalanche ac-
tivity index (AAI) from Schweizer et al. (1998). We refer to
2.4 Avalanche classification this score as the deep slab activity index (DSAI) since any
event not classified as a deep slab avalanche receives a score
We classified deep slab avalanches failing on persistent weak
of 0. DSAI scores are summed over each avalanche season
layers based on the recorded bed surface, crown depth,
(1 November–31 March), resulting in a seasonal DSAI score:
avalanche type, R size, and 72 h storm totals. Avalanches Xny
with a bed surface recorded as ground and crown depth DSAIy = i=1
10Ri −3 , (2)
greater than 0.9 m are flagged as deep slab events. We also
retained events failing in the old snow if crown depth ex- where DSAIy is the seasonal DSAI score for year y, Ri is the
ceeded 0.9 m and was greater than 150 % of the mean crown R size of event i, and ny is the number of deep slab events
depth from all avalanches for the day. We further consider occurring during year y. The size weighting scheme for the
events using a dimensionless scaling factor representing the AAI was developed using the D-size classification that es-
ratio of crown height to 72 h new-snow totals: timates the mass of each event, which increases logarithmi-
cally with size (American Avalanche Association, 2016). We
D applied the AAI index to the R sizes recorded in our dataset
C= , (1)
HN72 based on previous research suggesting the relative mass of an
avalanche also increases logarithmically with R size (Birke-
where D is the crown depth and HN72 is the 72 h new-snow land and Landry, 2002; Table 2).
total. For each site, we select the value of C corresponding
with the 99th percentile of the distribution to indicate a deep 2.6 Self-organizing maps
persistent slab event. This yields C values of 4.0 for Bridger
Bowl, 4.4 for Jackson Hole, and 3.1 for Mammoth Mountain. A self-organizing map (SOM) is a type of neural network
By considering the tail of the distribution with the larger val- that generates a set of descriptive models, or nodes, from a
ues for C, we retain the events where the crown depth is large multidimensional dataset. The distribution of these nodes de-
relative to the new-snow depth, which should represent deep scribes the range of variability across the dataset, and each
slab avalanches failing on persistent weak layers. node summarizes a collection of observations that are ob-
For avalanches associated with 3 or more consecutive days jectively determined by the neural network model to be cat-
of missing precipitation data, we add another set of deep egorically similar (Kohonen, 1998). The SOM provides a
Nat. Hazards Earth Syst. Sci., 21, 757–774, 2021 https://doi.org/10.5194/nhess-21-757-2021A. R. Schauer et al.: Synoptic atmospheric circulation patterns associated with deep persistent slab avalanches 761
clear way of summarizing complex multidimensional data, Using the new synoptic classification scheme and the daily
as the algorithm takes into account the similarity between meteorological and avalanche record, we quantify distribu-
nodes as they are generated and then displays them on a tions of daily maximum and minimum temperature and new
two-dimensional array such that adjacent nodes are similar, snow water equivalence (SWE) for each synoptic type at
while distant nodes are not. SOMs improve on traditional each of the three study sites. For each site, we calculate me-
multivariate methods (i.e., principal component analysis or dian daily maximum and minimum temperatures for days
k-means clustering) because they characterize and display assigned to each synoptic type. Similarly, we calculate the
synoptic circulation patterns on a defined spectrum of related 75th percentile for daily SWE totals (P75 ) for days assigned
circulation types, rather than in terms of several independent to each synoptic type at each site. Using these descriptive
groups. By initially generating nodes that collectively repre- statistics, we identify the synoptic types in the upper and
sent all of the variability within the dataset, the SOM is less lower quartiles of all the synoptic types for median daily
sensitive to changes in the number of synoptic types retained maximum temperature, median daily minimum temperature,
than previously used methods such as rotated principal com- and P75 to characterize the coldest, warmest, wettest, and dri-
ponent analysis (PCA). For instance, increasing the num- est circulation patterns at each site. Additionally, we consider
ber of synoptic types defined by SOMs may highlight sub- the number of days assigned to each synoptic type at the
tle changes in synoptic circulation patterns, while increasing beginning of the winter season (November–January) when
the number of types retained using PCA or various clustering deep persistent weak layers tend to form (Marienthal et al.,
algorithms may generate entirely new, and sometimes unreal- 2015) and compare differences in the frequency distribution
istic, circulation types (Huth, 1996; Reusch et al., 2005). Re- of daily synoptic types for major and minor deep slab years
cent research utilizes SOMs to classify synoptic atmospheric at all three study sites. We then count the number of days as-
variability (e.g., Sheridan and Lee, 2011; Smith and Sheri- signed to each synoptic type in the 3 d preceding deep slab
dan, 2018; Wise and Dannenberg, 2014). However, there is avalanche activity to identify any relationships between cir-
little work applying SOMs to snow and avalanches. Shan- culation patterns and onset of deep slab avalanches. For each
dro and Haegeli (2018) used SOMs to characterize avalanche location, we compare frequency distributions that summa-
types in western Canada for over 14 000 avalanche advi- rize the number of days assigned to each synoptic type from
sories in order to better understand typical avalanche prob- November to January over all major seasons to all minor sea-
lems. Schweizer et al. (1994) incorporated SOM, along with sons on the record. Last, we identify similarities and differ-
rule-based systems and expert knowledge, to aid in avalanche ences between atmospheric setups prior to wet and dry slab
forecasting in the Swiss Alps. In this work, we apply the activity.
methodology developed by previous synoptic climatology
studies to the deep persistent slab avalanche problem.
Each SOM node is characterized by 1197 grid point val- 3 Results
ues on the same 2.5◦ × 2.5◦ grid used by the NCEP/NCAR
daily 500 mbar geopotential height maps. The SOM is im- 3.1 Map pattern classification
plemented in R using the Kohonen package (Wehrens and
Buydens, 2007) to generate 20 synoptic types summarizing The SOM-generated 500 mbar map pattern classification
the atmospheric circulation patterns observed over the study scheme is arranged in an array of five rows (labeled 1–5,
area. We explored various SOM configurations using 9, 12, top to bottom) and four columns (labeled A–D, left to right)
15, 20, 25, 35, and 56 node arrays in order to determine an (Fig. 2). The array shows a gradual transition from merid-
appropriate number of synoptic types to retain. An optimal ional flow (enhanced north–south movement) in the top rows
configuration minimizes variability among synoptic types as- to zonal flow (direct west–east movement) in the bottom
signed to the same node and maximizes the variability be- rows. There is also a transition from a negative (reverse)
tween nodes. However, if this was the only goal of SOM op- Pacific–North American (PNA) phase in the lower left cor-
timization, one could simply set the number of nodes equal to ner to a positive phase in the upper right, following main
the number of observations, which would defeat the purpose modes of variability as described by Leathers et al. (1991).
of implementing a classification scheme. Since the analysis An upper-level trough over Hudson Bay (referred to here-
is both more practical and easier to understand with fewer after as the Hudson Bay trough) in the upper left of the ar-
types retained, an optimal classification scheme has to find ray becomes weaker moving diagonally to the lower right.
a balance between interpretability and over-generalization. An upper-level ridge over the eastern Pacific Ocean and ex-
We found major reduction in within-group variability as the tending north to the Aleutian Islands and eastern Siberia in
number of nodes increased from 9 to 20, with incremental column A migrates eastward moving to the right across the
improvements thereafter. Thus, we identified an optimal con- array, until it lies over North America in column D. The east-
figuration of 20 nodes, which is similar to previous synoptic ward migration of this ridge is coupled with development of
studies (e.g., Esteban et al., 2005; Kidson, 2000; Schuene- an upper-level trough over the Aleutian Islands and a tran-
mann et al., 2009). sition from a more northwesterly flow over the continental
https://doi.org/10.5194/nhess-21-757-2021 Nat. Hazards Earth Syst. Sci., 21, 757–774, 2021762 A. R. Schauer et al.: Synoptic atmospheric circulation patterns associated with deep persistent slab avalanches
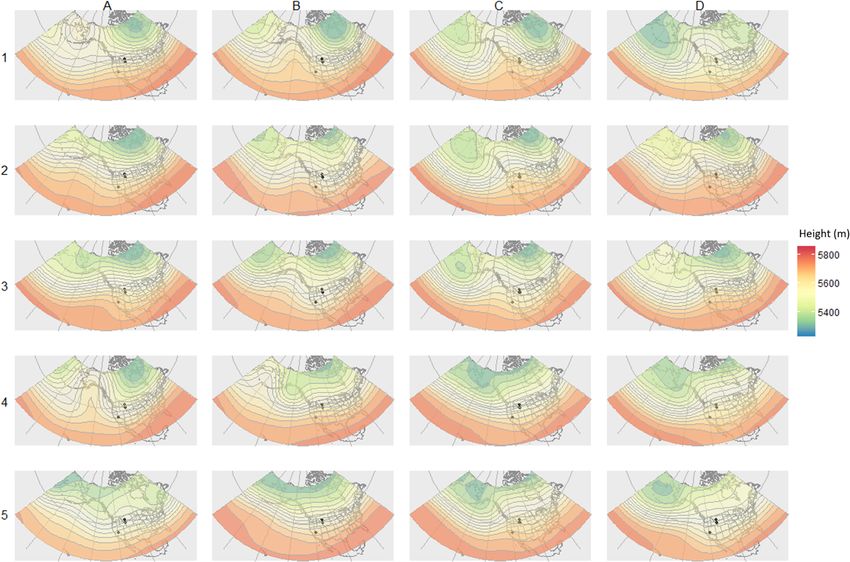
Figure 2. Array of 500 mbar geopotential height map patterns generated using self-organizing maps. Each map pattern, or synoptic type, is
a generalization of a group of days exhibiting a similar circulation pattern.
USA in column A to a more west-southwest flow in the pat- Map patterns for types observing the most frequent pre-
terns in column D. cipitation events at Bridger Bowl feature a ridge over the
eastern Pacific or west coast of the USA and some devel-
3.2 Meteorological characteristics associated with the opment of the Hudson Bay trough, which results in localized
synoptic types northwest flow over Bridger Bowl (Table 3, Figs. 2 and 3).
Type B2 has the second highest P75 total with 13 mm, with
3.2.1 Bridger Bowl 61 % of the days assigned to this type recording some amount
of precipitation, making it the wettest of all synoptic types
The coldest synoptic types (A1, A2, A4, B1, B2, B3, and C3)
at Bridger Bowl. The Pacific ridge for type B2 is less pro-
at Bridger Bowl are characterized by a strong north-to-south
nounced than the other five types with frequent precipitation,
trajectory over the northwest USA (Table 3, Figs. 2 and 3).
which results in a more zonal flow pattern and thus more
Median daily maximum temperatures for days assigned to
efficient vapor transport as air masses travel a more direct
these synoptic types range from −3 to −9 ◦ C, while median
path inland from the Pacific, crossing fewer orographic bar-
daily minimum temperatures are −10 to −19 ◦ C. This is in
riers. The driest synoptic types at Bridger Bowl are charac-
stark contrast to the warmest synoptic types (B4, C2, C5, D2,
terized by a moderate to strong ridge over the western USA,
and D3) at Bridger Bowl, which have median daily maximum
leading to increased subsidence in the region and a south-
temperatures ranging from 2 to 4 ◦ C and median daily mini-
west flow trajectory over the study site. SWE distributions
mum temps from −4 to −6.6 ◦ C. These warm types feature
for patterns D2 and C5 have a low percentage of precipitation
ridging over the Rocky Mountains and a southerly flow tra-
days (30 % and 39 %, respectively) but high values for P75
jectory over Bridger Bowl.
(11.2 and 12.5 mm, respectively), suggesting that storms oc-
curring during these patterns are infrequent but can be large.
The SWE distribution for type A4 is noteworthy because al-
Nat. Hazards Earth Syst. Sci., 21, 757–774, 2021 https://doi.org/10.5194/nhess-21-757-2021A. R. Schauer et al.: Synoptic atmospheric circulation patterns associated with deep persistent slab avalanches 763
Table 3. Descriptive statistics for meteorological metrics at all three locations. SWE is summarized with the 75th percentile of daily SWE
for all days assigned to each synoptic type, along with percent of total days during which any amount of precipitation was recorded. Daily
maximum and minimum temperatures are summarized using median values for all days assigned to each synoptic type. For each column, the
top five wettest or warmest types are highlighted in bold, while the five driest or coldest types are italicized.
Bridger Jackson Mammoth
Total no. Max T Min T SWE (mm) Max T Min T SWE (mm) Max T Min T SWE (mm)
of days (◦ C) (◦ C) (◦ C) (◦ C) (◦ C) (◦ C)
Median P75 no. of Median P75 no. of Median P75 no. of
days > 0 days > 0 days > 0
A1 256 −3 −12 10 53 −4.4 −11 18.7 75 2.8 −6.7 50.8 39
B1 288 −6 −13 10.8 59 −7.8 −14 8.5 77 2.2 −8.3 33 29
C1 332 0 −7 9.5 32 −2.8 −10 6.4 40 6.7 −5.6 19.9 21
D1 244 −1 −9 9.3 46 −4.4 −11 6.4 64 2.8 −6.7 23.6 36
A2 272 −3 −10 12 43 −6.1 −13 10.3 78 1.4 −8.9 34.3 35
B2 254 −3 −10 13 61 −3.9 −12 8.8 68 6.1 −5.8 23.2 20
C2 356 2 −6 10 29 −2.2 −9.2 6.7 53 5 −6.7 30.5 37
D2 350 2 −6 11.4 30 −1.7 −8.9 7.6 44 8.3 −5 18.4 15
A3 391 −1 −8 11 41 −5.6 −13 11.4 69 4.7 −6.7 21.6 19
B3 302 −2 −11 10 58 −5.6 −12 8.9 82 −1.1 −11 26.2 58
C3 329 −3 −10 11 55 −6.1 −13 7.6 76 2.2 −8.9 20.4 36
D3 258 3 −4 9.3 42 −1.7 −6.7 15.2 68 6.7 −4.4 41.9 35
A4 158 −9 −19 6 59 −8.9 −16 8.9 85 −1.7 −10 23.9 44
B4 277 2 −6.6 11 43 −1.7 −8.9 12.4 62 5.6 −2.8 37.1 22
C4 355 0 −8 11 50 −4.4 −11 11.4 79 2.2 −6.7 49.5 48
D4 407 2 −7 10 37 −3.9 −10 10.2 71 1.7 −7.2 38.5 49
A5 223 1 −8 11 50 −2.8 −11 8.9 75 3.3 −6.7 38.3 47
B5 237 1 −8 15.1 52 −3.1 −10 10.9 65 4.4 −5.6 19.2 29
C5 312 4 −6 12.5 39 −0.6 −7.8 8 53 6.1 −5.6 20.1 24
D5 298 0 −8 10 54 −3.9 −11 6.4 72 1.1 −8.9 34 37
though the percentage of days during which precipitation is ble 3, Figs. 2 and 3). Although most days exhibiting these
recorded is the second highest of all types (59 %), the P75 patterns record precipitation, storm totals are near average
value is among the lowest overall (6 mm). This map pattern compared to the rest of the synoptic types, with P75 val-
shows the strongest ridge over the east Pacific and the most ues between 8.9 and 10.3 mm. The synoptic types with the
intense northerly flow trajectory. largest 24 h storm totals typically exhibit a more zonal pat-
tern. Types A1 and A3 have P75 values of 18.7 and 11.4 mm,
3.2.2 Jackson Hole respectively, and show a weak ridge over the Pacific coast,
which leads to a more northwesterly trajectory. Types C4,
Similarly to the trends observed at Bridger Bowl, the cold- B4, and D3 have a slightly different configuration, with a
est synoptic types at Jackson Hole (A2, A3, A4, B1, B3, and trough over the Gulf of Alaska and zonal flow over eastern
C3) all exhibit an eastern Pacific ridge, Hudson Bay trough, Canada, which results in zonal flow slightly out of the south-
and a resulting localized northerly flow trajectory (Table 3, west over the continental USA. These patterns have P75 val-
Figs. 2 and 3). These synoptic types have median daily max- ues of 11.4–15.2 mm. The patterns with the smallest percent-
imum temperatures ranging from −8.9 to −5.6 ◦ C, and me- age of days recording precipitation (40 %–62 %) feature en-
dian minimum temperatures from −15.6 to −12.6 ◦ C. The hanced troughing over the Aleutian Islands and Hudson Bay
warmest daily temperature distributions are characterized by and a moderate to strong ridge over the western USA.
a southerly flow direction and moderate to strong ridging
over the Rockies. These patterns, including B4, C2, C5, D2, 3.2.3 Mammoth Mountain
and D3, have median daily maximum temperatures ranging
from −2.0 to −1.7 ◦ C, with median daily minimum temper- Similarly to Bridger Bowl and Jackson, the coldest synop-
atures ranging from −9.2 to −6.7 ◦ C. tic types at Mammoth Mountain (A2, A4, B3, and C3) are
Types A2, A4, B1, B3, and C4 are characterized by a mod- characterized by a ridge over the east Pacific and strong
erate to strong ridge over the east Pacific and the Hudson Bay Hudson Bay trough, resulting in a strong northwest flow
trough, recording precipitation on 77 % to 85 % of days (Ta- (Table 3, Figs. 2 and 3). These patterns have median daily
https://doi.org/10.5194/nhess-21-757-2021 Nat. Hazards Earth Syst. Sci., 21, 757–774, 2021764 A. R. Schauer et al.: Synoptic atmospheric circulation patterns associated with deep persistent slab avalanches Figure 3. Histograms of daily maximum temperature (a–c), minimum temperature (d–f), and snow water equivalence totals (g–i) for Bridger Bowl (a, d, g), Jackson (b, e, h), and Mammoth Mountain (c, f, i). For each of the nine arrays, the position of the plot corresponds with the map pattern shown in Figs. 2 and 3. For example, the histograms located in the upper left corner of each array correspond with synoptic type A1. maximum temperatures between −1.7 and 1.4 ◦ C, with me- and 35 %, respectively) but record high P75 totals (50.8 and dian daily minimum temperatures from −8.9 to −10.6 ◦ C. 41.9 mm, respectively). These patterns feature a split flow, Type D5 is one of the coldest synoptic types at Mammoth, with an omega block over the Bering Sea and zonal flow but it is also associated with average temperatures at Jack- over the continental USA at Mammoth Mountain; both types son Hole and above-average temperatures at Bridger Bowl. result in southwest flow trajectory. Types B3 and A4 show This map pattern shows a split flow at approximately 45◦ N, a more northwesterly flow trajectory, with a ridge over the with a weak ridge extending to the north and a trough ex- east Pacific. Although the percentage of days receiving pre- tending to the south. Types B2, C1, C5, D2, and D3 fea- cipitation is relatively high (58 % and 44 %, respectively), ture a southwest flow with moderate to strong ridging over P75 totals are modest (26.2 and 23.9 mm). For the patterns the coast, resulting in warm daily temperature distributions, with the smallest percentage of days receiving precipitation with median daily maximum temperatures ranging from 6.7 (15 %–22 %), Mammoth Mountain is situated on the down- to 8.3 ◦ C and median daily minimum temperatures between stream end of an upper-level ridge. This results in blocking −5.8 and −2.6 ◦ C. For type B2, Jackson and Bridger are sit- and a northwest flow trajectory and is conducive to increased uated farther downstream of the ridge, which leads to average subsidence. Types B5 and C5 see a slightly higher percent- or below-average temperatures at each site. age of days with precipitation (29 % and 24 %, respectively), Types C4, D4, and A5 see among the highest percentage of but precipitation totals for days associated with the two pat- days with recorded precipitation (44 %–58 %) and the high- terns are among the lowest of all synoptic types (19.2 and est P75 totals (38.3 to 49.5 mm). These types are all charac- 20.1 mm, respectively). These patterns are again associated terized by a trough over the Gulf of Alaska, with southwest with enhanced northwest flow (type B5) and a blocking ridge zonal flow patterns over the western USA. Types A1 and (type C5). D3 see a smaller percentage of days with precipitation (39 % Nat. Hazards Earth Syst. Sci., 21, 757–774, 2021 https://doi.org/10.5194/nhess-21-757-2021
A. R. Schauer et al.: Synoptic atmospheric circulation patterns associated with deep persistent slab avalanches                       765

Figure 4. Scatterplots of seasonal deep slab activity index scores for Bridger Bowl, MT (a); Jackson Hole, WY (b); and Mammoth Mountain,
CA (c). Highlighted points represent the years considered major and minor deep persistent avalanche seasons, and dashed lines represent the
cutoff thresholds used to identify those points.

3.3   Early-season patterns for major and minor seasons                 an additional 3 seasons with DSAI scores less than or equal
                                                                        to 0.1 as minor seasons (1999, 2005, and 2016). We find
                                                                        7 seasons at Mammoth Mountain with DSAI scores equal to
At each location, we use scatterplots of seasonal cumula-               or greater than 100, which corresponds with the 82nd per-
tive DSAI score to identify clear breaks that separate seasons          centile at that site. We found 18 seasons with a seasonal
with high scores from the rest of the seasons (Fig. 4). These           DSAI score of zero at Mammoth Mountain.
seasons are hereafter referred to as “major seasons”. Addi-
tionally, we designate any season with a cumulative DSAI                3.3.1   Bridger Bowl
score of zero as a “minor season”. There is a distinct group
of seasons with exceptionally high DSAI scores at each site,            At Bridger Bowl, there appears to be a shift towards in-
indicating these seasons had a particularly large number of             creased meridional flow during the beginning of major DSAI
events or large-magnitude events. The threshold separating              seasons, marked by the large increase in the number of days
major seasons from the rest varies by site as does the num-             assigned to types A1, A2, C1, and D1 and the dramatic de-
ber of years designated as major seasons. These differences             crease in counts for types B4 and D4 (Fig. 5). Major seasons
can be attributed to the differences in the snow and avalanche          also see a decrease in counts for type B1, which is charac-
climates and the respective locations as they relate to the at-         terized by enhanced northwest flow over Bridger Bowl on
mospheric circulations. At Bridger Bowl, there are 4 seasons            the back side of a trough and is commonly associated with
with DSAI scores equal to or exceeding 284, representing the            increased precipitation. During minor DSAI seasons, there
90th percentile for annual DSAI scores at that site (Table 4).          are a large number of days represented by types D2, B4, and
There are 4 seasons with a DSAI score of zero at Bridger                C5. Median daily maximum and minimum temperatures for
Bowl. We also include the 2014 and 1997 seasons as minor                these types are in the upper quartile of all synoptic types at
seasons, which had seasonal scores of 0.01 and 0.1, respec-             Bridger Bowl.
tively. At Jackson Hole, we find 10 seasons with DSAI scores
exceeding 209, representing the 75th percentile at that site.
Similarly to Bridger Bowl, there were only 2 seasons (1993
and 2003) with seasonal DSAI scores of zero, so we include

https://doi.org/10.5194/nhess-21-757-2021                                         Nat. Hazards Earth Syst. Sci., 21, 757–774, 2021
766 A. R. Schauer et al.: Synoptic atmospheric circulation patterns associated with deep persistent slab avalanches
Table 4. Major and minor deep slab avalanche seasons for the three study sites, determined by cumulative seasonal DSAI score.
Location Major seasons Minor seasons
Bridger Bowl 1979, 1980, 1984, 2011 1987, 1988, 1995, 1997, 2014, 2017
Jackson Hole 1979, 1982, 1985, 1994, 1996, 1997, 2001, 1993, 1999, 2003, 2005, 2016
2004, 2008, 2009
Mammoth Mountain 1985, 1987, 1996, 1997, 2001, 2006, 2008 1979–1982, 1984, 1986, 1988, 1989, 1991–
1993, 1999, 2000, 2012, 2014–2017
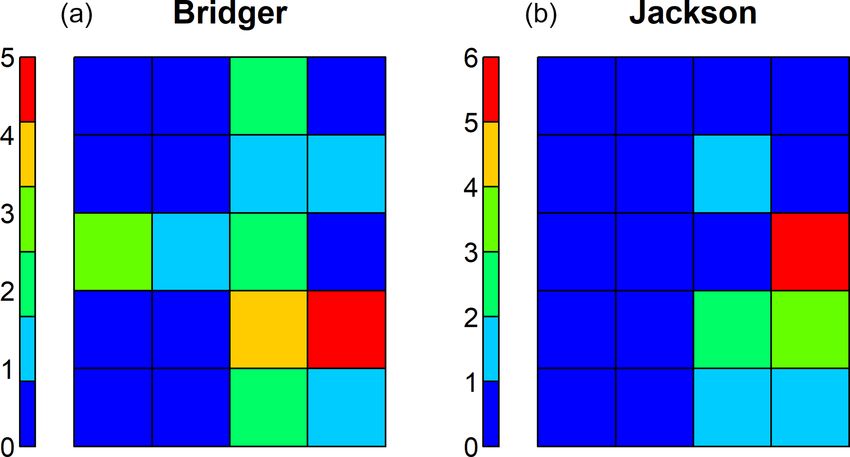
Figure 5. Relative frequencies for each synoptic type from November–January for the entire study period (a), over all minor seasons (b, d, f),
and all major seasons (c, e, g). Heat maps are given for Bridger Bowl (b, c), Jackson (d, e), and Mammoth Mountain (f, g). Frequencies are
calculated by summing counts of days assigned to each synoptic type over all major (minor) seasons and dividing by total number of days
for all major (minor) seasons.
3.3.2 Jackson Hole A3 and B4, which exhibit a zonal flow pattern with a west-
erly or slightly southwesterly trajectory over Jackson. The
The November–January synoptic type counts during major dominant synoptic types during November–January of mi-
DSAI years at Jackson Hole indicate high counts for the nor deep slab years in Jackson Hole feature enhanced zonal
number of days assigned to patterns D1, C2, and D3, all of flow, with very few days assigned to the synoptic types repre-
which are associated with an enhanced ridge over the west- senting blocking patterns in the upper row of the SOM array.
ern USA. There is a marked decrease in the number of days Minor DSAI seasons exhibit high frequencies for synoptic
assigned to the same types during minor seasons (Fig. 5). types B5, C5, and D5 which may be attributed to above av-
For most major DSAI seasons, the synoptic types with the erage temperatures or frequent precipitation observed during
largest number of days have a weak to moderate Hudson Bay those circulation patterns.
trough. Major DSAI seasons also have low counts for types
Nat. Hazards Earth Syst. Sci., 21, 757–774, 2021 https://doi.org/10.5194/nhess-21-757-2021A. R. Schauer et al.: Synoptic atmospheric circulation patterns associated with deep persistent slab avalanches 767
3.3.3 Mammoth Mountain
There is an increase in frequencies for types C2, C4, and D4
during major DSAI seasons at Mammoth Mountain (Fig. 5).
Type C2 is characterized by enhanced ridging over the west
coast, while types C4 and D4 are zonal patterns with local-
ized southwest flow. There was not a single deep slab event
in 18 of the 35 seasons at Mammoth Mountain with complete
meteorological and avalanche records. Minor DSAI seasons
have a large number of days assigned to types D2, A3, and
C5, which are associated with direct zonal flow and a slight
ridge over the coast of California. None of the minor DSAI
seasons had large counts for days associated with type A4
or A5. Type A4 is characterized by a strong ridge over the
eastern Pacific, with enhanced northwesterly flow over Mam-
moth Mountain, while type A5 has a slight ridge further to
the west over the Aleutian Islands. Both patterns tend to be
associated with cold temperatures at Mammoth Mountain.
3.4 Atmospheric conditions 72 h prior to deep slab
activity Figure 6. Relative frequencies for each synoptic type within 72 h
prior to a day with dry deep slab avalanches recorded at Bridger
At each site, the total number of avalanches during the study Bowl (a), Jackson Hole (b), and Mammoth Mountain (c), and total
counts for the duration of the study period.
period ranges from approximately 20 000 to just over 40 000,
while the number of deep slab events is roughly 2–3 orders
of magnitude smaller (Table 5). While the recorded deep slab
events are primarily dry slab avalanches, there are a small
number of deep persistent events classified as wet slabs at
Bridger Bowl and Jackson. Each of the three study sites dis-
plays a unique distribution of the number of days assigned
to each synoptic type in the 72 h prior to deep slab activity
for dry and wet slabs (Figs. 6 and 7). We expect a difference
between the synoptic conditions for triggering wet and dry
deep slabs due to the different processes required to produce
these avalanches. At each site a small group of synoptic types
occur much more frequently than the others in the 3 d leading Figure 7. Counts for each synoptic type within the 72 h prior to
deep wet slab avalanches at Bridger Bowl (a) and in the Jackson
to deep slab activity. The relative frequencies for each type
area (b).
during the 72 h preceding deep persistent slab activity dif-
fer from the overall relative frequency distribution during the
study period, which indicates a unique circulation preference
flow from eastern Siberia all the way across to the Atlantic,
for deep persistent slab avalanches at each study site. with a direct westerly trajectory.
Types A1, A2, A3, D3, and D4 dominate the period imme-
3.4.1 Dry slab events diately prior to dry deep slab activity at Jackson Hole (Figs. 2
and 6). Patterns A1, A2, and A3 are characterized by zonal
Types A3, D4, and D5 are associated with the greatest num- flow over the western USA coming slightly out of the north
ber of days at Bridger Bowl in the 72 h prior to dry deep and moderate to strong Hudson Bay trough. In patterns A1
slab events (Fig. 6). All three types are zonal patterns with and D3 there is a split flow, with an omega block over the
varying degrees of troughing over the Aleutian Islands and Aleutian Islands and western Alaska and more zonal flow
slightly different north–south orientations (Fig. 2). Type B2 over the continental USA. However, the two patterns dif-
was recorded less than 10 times in the days leading to dry fer in that pattern D3 also shows a weak upper-level ridge
deep slab events, while type B5 was never observed. Type over the Rockies, whereas type A1 does not. This leads to
B2 is characterized by a strong ridge over the east Pacific and a more southwesterly flow in type D3, whereas the trajec-
Hudson Bay trough, which results in strong north–south flow tory for type A1 is more directly out of the west and even
over the western USA, while type B5 shows strong zonal slightly northwest over Jackson. Pattern D4 shows more en-
https://doi.org/10.5194/nhess-21-757-2021 Nat. Hazards Earth Syst. Sci., 21, 757–774, 2021768 A. R. Schauer et al.: Synoptic atmospheric circulation patterns associated with deep persistent slab avalanches
Table 5. Summary of number of total avalanches, all deep slab events, dry deep slab events, and wet deep slab events. The number of days
each type of avalanche was recorded is given in parentheses.
All avalanches All deep slab Dry deep slab Wet deep slab
Bridger Bowl 31 455 (2161) 314 (176) 287 (169) 27 (7)
Jackson Hole 20 180 (2343) 293 (173) 284 (168) 9 (5)
Mammoth Mountain 41 751 (1177) 92 (60) 92 (60) 0 (0)
hanced troughing over the Aleutian Islands and the east Pa- 4 Discussion
cific, which results in a zonal pattern over the western USA
with enhanced southwesterly flow. There are very few days
associated with types B5, C5, and D5 during the period lead- 4.1 Processes related to deep persistent slab avalanches
ing to dry deep slab avalanches at Jackson Hole, all of which
are zonal patterns with mild ridging over Jackson.
The 72 h period prior to dry deep slab events at Mammoth The SOM-generated 500 mbar maps (Fig. 2) provide insight
is dominated by types A4 and C4, which are two very differ- into the key atmospheric processes for persistent deep slab
ent patterns (Figs. 2 and 6). Type A4 has the strongest ridge avalanches, both for the early-season conditions to generate
over the Pacific and towards the Gulf of Alaska, while type a snowpack conducive to subsequent avalanches and for the
C4 shows a trough over the Gulf of Alaska that transitions 72 h period preceding an event. The predominant synoptic
into a direct zonal pattern moving southward into the Pacific. types are different for each of the three locations consid-
Type A5 was the third most frequent pattern observed in the ered (Fig. 6), a function of the location relative to the Pa-
3 d prior to dry deep slab events at Mammoth. This pattern cific Ocean, latitude, altitude, regional topography, and site-
closely resembles type C4 in the southwest quarter of the specific conditions.
study area, especially over the central and west Pacific and This research supports an extensive body of previous work
the California coast. The lack of synoptic types with more in- identifying the influence of early-season snowfall and tem-
termediate counts at Mammoth Mountain may be attributed peratures in the development of snowpack conducive to deep
to the smaller number of dry deep slab events compared to persistent slab avalanches (e.g., Bradley, 1970; Marienthal
the other sites over the duration of the study period. et al., 2015). Major deep slab seasons at Bridger Bowl and
Jackson Hole are characterized by a large number of days
3.4.2 Wet slab events with synoptic types associated with low frequency of precip-
itation events at the beginning of the season. Some of these
Of the 314 deep persistent slab events recorded at Bridger dry patterns are controlled by a blocking ridge over the con-
Bowl, 27 were classified as wet slab avalanches. These oc- tinental USA (e.g., types C1, D1, and C2 in Fig. 2), which
curred on 5 different days in the record. Of the 293 deep are assigned to a large number of days during major deep
slab avalanches, 9 were wet slabs at Jackson on 6 differ- slab seasons at both locations and are much less common
ent days, while there were no deep slab events classified as during minor seasons. Major deep slab seasons at both sites
wet slab avalanches at Mammoth Mountain (Table 5). The tend to shift towards a positive PNA pattern, with a high con-
synoptic types leading to the days with wet slabs at Bridger centration of synoptic types in the upper right corner of the
Bowl show a large number of days associated with type D4, SOM array. This is consistent with research showing these
which was also a frequently observed type during dry deep patterns are associated with reduced snowfall totals in the
slab events (Figs. 6 and 7). The second most common pattern western USA (Wise, 2012) and is supported by meteorologi-
was type C4, which was not as pronounced in the dry deep cal records at Bridger and Jackson (Fig. 3). Although the dif-
slab record. Types D3, C4, and D4 were assigned the highest ference in 24 h precipitation (as approximated by the P75 val-
number of days prior to deep wet slab avalanches at Jackson. ues) varies only by a few millimeters of water among the syn-
For both Bridger Bowl and Jackson, the synoptic types as- optic types, the difference does have practical significance.
signed the most days prior to deep wet slab activity are char- For example, the median P75 value for the five wettest syn-
acterized by a distinct trough over the Gulf of Alaska, which optic types at Bridger Bowl (12.5 mm) is a 134 % increase
is coupled with enhanced southwesterly zonal flow over the relative to the five driest types (9.5 mm). At Jackson Hole, the
continental USA. difference is 185 %, and at Mammoth Mountain it is 210 %.
As these daily trends are sustained over a period of several
weeks and months, these differences will have a strong in-
fluence on snowpack structure. Mock and Birkeland (2000)
showed that low snowfall totals at the beginning of the season
lead to persistent weak-layer development by increasing the
Nat. Hazards Earth Syst. Sci., 21, 757–774, 2021 https://doi.org/10.5194/nhess-21-757-2021A. R. Schauer et al.: Synoptic atmospheric circulation patterns associated with deep persistent slab avalanches 769 bulk temperature gradient in intermountain and continental tent slab avalanche seasons, especially when combined with snowpacks. periods warm enough to facilitate melt–freeze cycles at the On the other hand, mild early winter conditions inhibit surface or with rain events early in the season. the formation of weak basal snow layers. This is confirmed During minor deep slab seasons at Mammoth Mountain by our research, which shows an increase in synoptic types there simply may not be enough snow to develop a snow- commonly associated with mild temperatures during the be- pack conducive to deep persistent slab avalanches. This was ginning of minor seasons (Fig. 5). Warmer early-season tem- the case during the 1988 and 1989 seasons, which were dom- peratures reduce temperature gradients within the snowpack, inated by northwest zonal flow (type A3), and the 1991 and thereby minimizing the development of depth hoar or near- 1993 seasons, which had a persistent blocking ridge over the surface faceted layers. west coast (types C1, C2, and D2). There is also a subset of A large number of days with synoptic types characterized minor seasons with little to no precipitation during the be- by cold temperatures (e.g., types A2 and A4) or infrequent ginning of the season but subsequent heavy precipitation for precipitation (type C2) occur during November–January of the rest of the season (1992 and 1999). In the coastal climate major deep persistent slab seasons at Mammoth Mountain of Mammoth Mountain, even if there was a persistent weak (Fig. 5). This is consistent with Bridger Bowl and Jackson layer, it may have simply been buried so deeply that no load Hole. However, unlike the other two study sites, at Mam- applied at the surface would be able to initiate a fracture in moth Mountain there are also a substantial number of days the weak layer. For the major seasons of 1987, 1996, 1997, in November–January of major seasons assigned to synoptic and 2001, there was an initial dry period followed by inter- types that are associated with frequent or heavy precipitation mediate snowfall. This provided a period during which a per- (e.g., patterns A4, D4, and A5). Additionally, there are a large sistent weak layer could develop, and there was enough snow number of days assigned to the drier synoptic types (D2, C3, to subsequently bury the persistent weak layer deep enough and B5) during the beginning of minor seasons. Given the to form a deep persistent slab but shallowly enough that it re- processes driving dry snow metamorphism, one would ex- mained prone to large applied loads. For these four seasons, pect the exact opposite – less frequent precipitation leading all of the deep slab events occurred from November–January. to enhanced faceting and depth hoar during major seasons At all three sites, the 72 h prior to dry deep slab events is (e.g., Armstrong, 1977; Bradley et al., 1977) and increased commonly associated with synoptic types characterized by precipitation with less faceting during minor seasons. How- high levels of precipitation (Fig. 6). Again, these patterns dif- ever, the majority of the deep persistent slabs at Mammoth fer by site depending on latitude, proximity to the coast, and Mountain occur in December and January, so sizable precip- local and regional topography. At Bridger Bowl, the types oc- itation events early in the season are needed to build the thick curring most commonly during this time period have either slabs necessary for deep slab avalanches. Additionally, large enhanced zonal flow (types D4 and D5) or a localized north- precipitation events provide the load required to push a deep westerly storm track (type A3). The relatively high counts persistent weak layer to its breaking point. Indeed, type A4 for types A3 and D4 mimic the frequency pattern for the en- is associated with regular precipitation at Mammoth Moun- tire study period. This suggests that these two types show up tain, and it shows up frequently during the beginning of ma- frequently in this 72 h window due to their high frequency jor seasons as well as in the 72 h preceding deep persistent of occurrence overall, rather than due to an association with slab events (Figs. 5 and 6). deep persistent avalanches. This is not the case with type D5, In addition to the large number of days assigned to wet which has a very high frequency of occurrence preceding synoptic types in November–January of major seasons at deep persistent slab avalanches despite exhibiting relatively Mammoth, there are also major seasons with high counts for low counts for the duration of the study period. The types types C2 and C5. These patterns tend to have above-freezing with a northwesterly storm track dominate the period prior daily maximum temperatures with subfreezing minimum to deep slabs at Jackson as well; however, there are also very temperatures. An early season with intermittent precipitation high counts for type D3, which is characterized by a strong and alternating warm and cold temperatures would facilitate southwesterly storm track that channels warm, moist air in- near-surface faceting and ice lens formation, which could act land up the Snake River plain. There is also a distinct spike as a low-friction bed surface conducive to avalanches later in patterns A1, A2, and D3 during the 72 h preceding deep in the season. Conlan et al. (2014) took field measurements slab activity at Jackson, which stands out when compared at 41 deep persistent slab avalanches in western Canada and to the relatively low counts for all three patterns during the identified melt–freeze crusts directly below or directly above overall duration of the study period. This suggests that these the failure layer in multiple events. Jamieson et al. (2001) three patterns may indeed be good indicators of increasing studied deep persistent avalanche cycles for two consecutive likelihood of deep persistent slab avalanches at Jackson Hole seasons in western Canada, both of which were attributed to given a conducive snowpack. The patterns with the highest faceted snow on top of a crust. This may explain another pro- count for this 72 h period at Mammoth (types A4 and C4) ex- cess by which November–January circulation can favor pre- hibit localized west-southwesterly flow (Figs. 2 and 6). How- cipitation at Mammoth Mountain during major deep persis- ever, the two patterns differ greatly over the full extent of the https://doi.org/10.5194/nhess-21-757-2021 Nat. Hazards Earth Syst. Sci., 21, 757–774, 2021
You can also read