The Fruit Fly Brain Observatory: From Structure to Function - bioRxiv
←
→
Page content transcription
If your browser does not render page correctly, please read the page content below
bioRxiv preprint first posted online Mar. 18, 2019; doi: http://dx.doi.org/10.1101/580290. The copyright holder for this preprint
 (which was not peer-reviewed) is the author/funder, who has granted bioRxiv a license to display the preprint in perpetuity.
                                    All rights reserved. No reuse allowed without permission.

             The Fruit Fly Brain Observatory: From Structure to Function

     Nikul H. Ukani1 , Chung-Heng Yeh1 , Adam Tomkins2 , Yiyin Zhou1 , Dorian Florescu2 ,
   Carlos Luna Ortiz2 , Yu-Chi Huang3,4,5 , Cheng-Te Wang3,4,5 , Mehmet K. Turkcan1 , Tingkai
   Liu1 , Paul Richmond6 , Chung-Chuan Lo3,4,5 , Daniel Coca2 , Ann-Shyn Chiang3,5,7,8,9,10 and
                                       Aurel A. Lazar1,*
                   1
                   Department of Electrical Engineering, Columbia University, New York, NY 10027, USA
      2
       Department of Automatic Control & Systems Engineering, The University of Sheffield, Sheffield, S1 3JD, UK
                        3
                          Brain Research Center, National Tsing Hua University, Hsinchu 30013, Taiwan
                4
                  Institute of Systems Neuroscience, National Tsing Hua University, Hsinchu 30013, Taiwan
                     5
                       Department of Life Science, National Tsing Hua University, Hsinchu 30013, Taiwan
                    6
                      Department of Computer Science, The University of Sheffield, Sheffield, S1 4DP, UK
                         7
                           Genomics Research Center, Academia Sinica, Nankang, Taipei 11529, Taiwan
                             8
                               Institute of Physics, Academia Sinica, Nankang, Taipei 11529, Taiwan
    9
      Department of Biomedical Science and Environmental Biology, Kaohsiung Medical University, Kaohsiung 80708,
                                                              Taiwan
       10
          Kavli Institute for Brain and Mind, University of California, San Diego, La Jolla, California 92093, USA
                                  *
                                    Corresponding author: Aurel A. Lazar, aurel@ee.columbia.edu

                                                                Abstract

               The fruit fly is a key model organism for studying the activity of interconnected
           brain circuits. A large scattered global research community of neurobiologists and
           neurogeneticists, computational and theoretical neuroscientists, and computer scien-
           tists and engineers has been developing a vast trove of experimental and modeling
           data that has yet to be distilled into new knowledge and understanding of the func-
           tional logic of the brain. Developing open shared models, modelling tools and data
           repositories that can be accessed from anywhere in the world is the necessary engine
           for accelerating our understanding of how the brain works.
               To that end we developed the Fruit Fly Brain Observatory (FFBO), the next gen-
           eration open-source platform to support open, collaborative Drosophila neuroscience
           research. FFBO provides a (i) hub for storing and integrating fruit fly brain research
           data from multiple data sources worldwide, (ii) unified repository of tools and methods
           to build, emulate and compare fruit fly brain models in health and disease, and (iii) an
           open framework for fruit fly brain data processing and model execution. FFBO pro-
           vides access to application tools for visualizing, configuring, simulating and analyzing
           computational models of brain circuits of the (i) cell type map, (ii) connectome, (iii)
           synaptome, and (iv) activity map using intuitive queries in plain English. Tools are
           provided to extract the function inherent in these structural maps. All applications
           can be accessed with any modern browser.

                                                                                                                                    1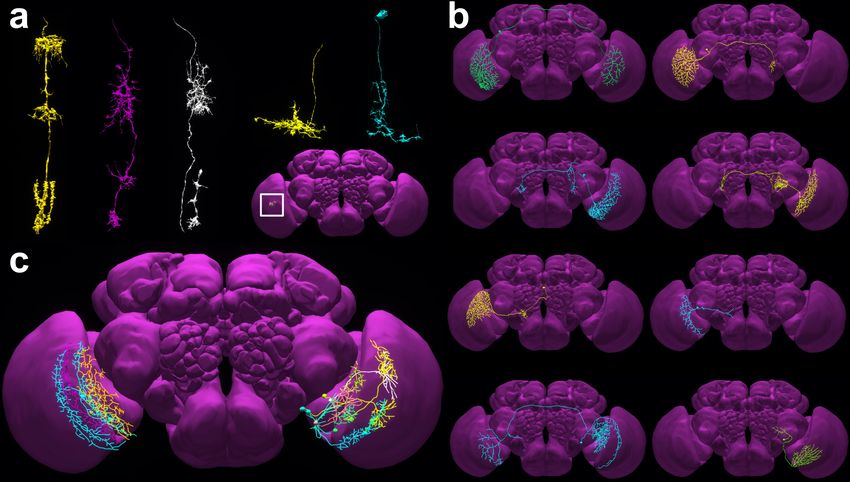
bioRxiv preprint first posted online Mar. 18, 2019; doi: http://dx.doi.org/10.1101/580290. The copyright holder for this preprint
 (which was not peer-reviewed) is the author/funder, who has granted bioRxiv a license to display the preprint in perpetuity.
                                    All rights reserved. No reuse allowed without permission.

   Introduction
   Animal behavior is governed by the activity of interconnected brain circuits. Comprehensive
   brain wiring maps are needed to formulate hypotheses about information flow and also
   to guide genetic manipulations aimed at understanding how genes and circuits orchestrate
   complex behaviors. The availability of a powerful toolbox of transgenic methods for neuronal
   circuit analysis, wide variety of mutants, the ease of culture and short development cycles
   makes Drosophila an ideal model system for investigating the relationship between genes,
   brain structure, function and behavior [1–3].
   A successful determination of how the brain’s highly complex structure implements specific
   functions requires its decomposition into functional modules whose input-output relation-
   ships can be individually analyzed and whose interactions can be explained in terms of the
   groups of synaptic connections that exist between them. Understanding how the fruit fly
   brain works, requires the assembling of four major reference maps, namely, (i) the cell type
   map - classification of cells into groups characterized by their morphology, molecular ex-
   pression pattern and distribution/innervation in all brain regions; (ii) the connectome - the
   wiring diagram of the nerve connections among all neurons in the brain; (iii) the synaptome
   - the set of all synapses, their distribution and expressed neurotransmitter and receptor type
   in all brain regions, and (iv) the activity map - the electrical activity of all neurons in the
   brain associated with a particular brain state.
   In the last century pioneering work began to map out these four areas on a small scale.
   For example, staining-based cell type classification has led to the FlyBrain, the very first
   online atlas of the Drosophila brain [4]. Around the same time, Flybase was created as a
   database of Drosophila genes and genomes [5]. Electron Microscopy (EM) has been used to
   precisely map columnar elements in the lamina neuropil [6]. Electrophysiological recordings
   of neurons such as Lobula Plate Tangential Cells has played a central role in gaining insight
   into visual motion detection [7].
   In the past decade, biological data contributing to the cell type map, connectome and synap-
   tome of the fruit fly brain have been rapidly and increasingly made available thanks to ad-
   vancing genetic technology and volume EM technology. A number of genetics data libraries
   have been greatly expanded, including the FlyBase [8], and others newly created. For exam-
   ple, functional genomics data is provided by the Drosophila RNAi Screening Center (DRSC)
   and Transgenic RNAi Project (TRiP) [9], RNAi Libraries by the Vienna Drosophila Re-
   search Center [10] and FlyLight GAL4 and Split-GAL4 lines by the HHMI Janelia Research
   Campus [11, 12]. Furthermore, EM-based data has been provided for the lamina cartridge
   [13], medulla [14, 15] and mushroom body [16]. Most recently, the whole fly brain has been
   imaged using EM [17]. In addition, the cell type map of the mushroom body [12], medulla
   [15] and central complex [18, 19] have been published. A large mesoscale connectome of the
   fruit fly brain has been provided (FlyCircuit) [20] and the connectome of 7 medulla columns
   (Janelia) [15] has been reconstructed, and made publicly available. In contrast, despite the
   strong interest in Drosophila neuron recordings, open neurophysiological data can rarely
   be found in the public domain. One of the exceptions is the DoOR database for mapping
   Drosophila odorant responses [21].

                                                                                                                                    2
bioRxiv preprint first posted online Mar. 18, 2019; doi: http://dx.doi.org/10.1101/580290. The copyright holder for this preprint
(which was not peer-reviewed) is the author/funder, who has granted bioRxiv a license to display the preprint in perpetuity.
All rights reserved. No reuse allowed without permission.
Figure 1: The FFBO open collaborative ecosystem. The FFBO assembles the cell type,
connectome, synaptome and activity maps within a single ecosystem that benefit three group
of stakeholders, namely, the neurobiologists/neurogenetists, the computational/theoretical
neuroscientists and the computer scientists/engineers. The FFBO will, in the future, build
additional tools, such as those in the small circles shown in the middle ring, to help each
group of stakeholders to contribute to building the 4 maps as well as to fully utilize them
for understanding the function of the fly brain.
This diverse set of data has been utilized by three stakeholder groups towards understanding
the function of fly brain circuits (see Figure 1). The first group consists of neurobiologists
and neurogenetists who are interested to find neurons, genes, genetic lines to perform experi-
ments. Many existing fruit fly brain databases, web services and software, such as FlyCircuit
DB [20], FlyBrain Neuron Database [22], Virtual Fly Brain [23] and BrainBase [24], serve
this group of researchers. They enable search and visualization of confocal imaging stacks
of lines/neurons and/or information describing individual neurons.
The second stakeholder group consists of computational/theoretical neuroscientists. Several
computational models have been proposed to study whole brain function [25], the early visual
system [26] and visual motion detection [27, 28]. Electrophysiology data has been used
to identify the computation underlying photoreceptor function [29]. A number of recent
computational investigations addressed the function of the central complex (CX) [30–33]
whose anatomical structure, physiological properties and behavioral connection have been
subject to active recent studies [18, 19, 34, 35].
3bioRxiv preprint first posted online Mar. 18, 2019; doi: http://dx.doi.org/10.1101/580290. The copyright holder for this preprint
(which was not peer-reviewed) is the author/funder, who has granted bioRxiv a license to display the preprint in perpetuity.
All rights reserved. No reuse allowed without permission.
A third stakeholder group consists of computer scientists/engineers who independently in-
vestigated pattern classification using deep learning and/or applied such methods to model
the lamina cartridges and medulla columns of the fly [36, 37]. The overriding goal here is to
create novel circuits and models for deep learning [38] and reinforcement learning [39].
While extensive amounts of data has become increasingly influential within the domain of
each of the stakeholders, researchers are still faced with several challenges including the lack
of a (i) hub for storing and integrating fruit fly brain research data from multiple data sources
worldwide, (ii) standardized repository of tools and methods to build, emulate and compare
fruit fly brain models in health and disease, and (iii) open framework for fruit fly brain data
processing and model execution.
The Fruit Fly Brain Observatory (FFBO) presented here addresses these challenges heads-on
(see Figure 1). FFBO provides all stakeholders with the (i) means to build and access the
four maps (see inner circle), and (ii) tools to build upon these maps the algorithms tailored
to their respective knowledge domain (some examples are briefly described in the circles in
blue surrounding the inner circle).
Results
The Fruit Fly Brain Observatory
The FFBO assembles the cell-type, connectome, synaptome and activity maps within a
single ecosystem, and more importantly, supports the building of the functional map of the
fruit fly brain. The latter map is a key step in gaining insights into the functional logic of
the fruit fly brain circuits and their I/O behavior at different levels of abstraction.
The system architecture of the FFBO (shown in Figure S1) is built around an expanding
modular architecture. At the heart of the FFBO is the NeuroArch database [40], that inte-
grates both biological data and computational models of brain circuits into a single database,
and Neurokernel, a GPU-enabled computational engine for emulating the fruit fly brain [41].
The integrated database can be leveraged through the NeuroNLP and NeuroGFX front-ends.
NeuroNLP enables researchers to query biological data in plain English, including morphol-
ogy and position of neurons (cell type map), connectivity between neurons (connectome)
and distribution and type of synapses (synaptome). Moreover, it provides the first open
neurophysiology data service for the fruit fly brain (activity map). NeuroGFX offers users
means to explore the functional map of the fly brain circuits by providing them with a highly
intuitive graphical interface to configure, compose and execute neural circuit models within
Neurokernel. The main modules of the FFBO architecture are briefly described below.
NeuroArch is a graph database for codifying knowledge about fruit fly brain circuits. It is
designed with two user communities in mind: (i) neurobiologists/neurogeneticists interested
in querying the database to address questions regarding neuroanatomy, neural circuits, neu-
rons, synapses, neurotransmitters, and gene expression, and (ii) computational/theoretical
neuroscientists and computer science/engineers interested in the instantiation of models of
4bioRxiv preprint first posted online Mar. 18, 2019; doi: http://dx.doi.org/10.1101/580290. The copyright holder for this preprint
(which was not peer-reviewed) is the author/funder, who has granted bioRxiv a license to display the preprint in perpetuity.
All rights reserved. No reuse allowed without permission.
neural circuits and architectures, their program execution, and validation of hypotheses re-
garding brain function. A key aim of NeuroArch is to provide a resource that supports
and connects the research carried out by these two communities. To this end, NeuroArch
defines a data model for representation of both biological data and model structure and the
relationships between them within a single graph database [40].
The connectomic and anatomical data currently in the FFBO platform includes all available
open fly brain data from the (i) FlyCircuit [20], spanning some 20,000 neurons and 1,260,000
inferred synaptic connections [25], and (ii) the Janelia seven column Medulla EM reconstruc-
tion that includes some 500 neurons and 67,000 synapses [15, 42], and (iii) the Janelia larval
EM reconstruction that currently includes some 500 neurons and 138,000 synapses [43, 44].
The physiological data currently in the database consists of 1.6 hours of electrophysiology
recordings from photoreceptors [29, 45], olfactory sensory neurons [46] and antennal lobe
projection neurons [47].
The current NeuroArch database also includes two different models of the retina, developed
by two research groups, and a model of the lamina neuropil of the Drosophila. Additionally,
a model of the early olfactory system, including the antenna and antennal lobe resides in
the current NeuroArch.
Neurokernel is an open-source engine implemented in Python for the collaborative emula-
tion and validation of fruit fly brain models on multiple Graphics Processing Units (GPUs)
[41]. Neurokernel provides a programming model based on the structural organization of the
fly brain that consists of some 50 functional modules called Local Processing Units (LPUs)
and the connectivity patterns that link them. Neurokernel defines application programming
interfaces for communication between LPUs regardless of their internal design. Researchers
can independently model different regions of the fly brain as LPUs and easily interconnect
these for more complex functional validations.
NeuroNLP provides a modern web-based portal for navigating biological data relating to
fruit fly brain circuits. It is equipped with a user-friendly, graphical interface to aggre-
gate cell-type, connectome, synaptome and physiology data in the NeuroArch database,
with the ability to simultaneously query against and retrieve information from disparate
datasets.
NeuroNLP features a novel natural language interface that constructs complex queries against
the underlying database from plain English instructions such as “show GABAergic neurons
that have dendrites in left antennal lobe and axons in both left lateral horn and right dorso-
lateral protocerebrum” (or simply “show GABAergic neurons that have dendrites in al and
axons in both lh and DLP”). This provides highly intuitive access to the integrated fruit
fly brain circuit data, without the presumption of knowledge of a query language, syntax or
cumbersome user interfaces. The results of the queries are presented using powerful 3D visu-
alization and can be shared using a tag (see Methods, Figure S2 and Video S1) or by a demo
script (see Methods and Video S2) for publication and collaboration. In addition, any neuron
in the scene can be explored in greater detail using the information panel, which provides a
one stop access to all data associated with a particular neuron (see Methods).
NeuroGFX provides an environment to easily explore circuit structure and function ulti-
5bioRxiv preprint first posted online Mar. 18, 2019; doi: http://dx.doi.org/10.1101/580290. The copyright holder for this preprint
(which was not peer-reviewed) is the author/funder, who has granted bioRxiv a license to display the preprint in perpetuity.
All rights reserved. No reuse allowed without permission.
mately leading to biological validation. On the whole brain level NeuroGFX lays out the
guidelines for the development of whole brain emulation. On the neuropil level, NeuroGFX
allows users to study the I/O of each LPU. The canonical circuits (circuit motifs) are also
identified on this level and NeuroGFX can be used to study the effect of different composi-
tions mediated by local neurons.
NeuroGFX features a set of highly intuitive tools for exploring the function of neural cir-
cuit models, which can be accessed through a graphical user interface (GUI), allowing the
user to (i) associate circuit diagrams with biological data, (ii) graphically construct an in
silico experiment and execute manipulated circuits on GPUs, (iii) visualize the execution
results in the context of biological brain structure. These capabilities are supported by a
seamless integration of the NeuroArch database and the Neurokernel engine in the FFBO
architecture.
Specifically, NeuroGFX assembles executable circuits of the fruit fly brain neuropils through
composition of queries of the NeuroArch database that hosts executable models alongside
biological data (for an example, see Methods). The resulting circuits are optimized for
parallel execution by the Neurokernel Engine on general purpose Graphics Processing Units
(GPGPUs) [41]. NeuroGFX enables the exploration of the function of the fruit fly brain
on 3 levels of abstraction on (i) the whole brain level, (ii) the neuropil level and (iii) the
local circuit level. On all levels, the goal of NeuroGFX is to help decipher the mechanisms
underlying the function of circuits extracted from biological data through the construction,
manipulation and comparison of executable brain circuits.
Exploring Fruit Fly Brain MAPs with NeuroNLP
Building the Cell Type Map NeuroNLP enables the study of cell types and the con-
struction of circuits in the cell type map. As an example, with the simple query “show Mi1
neuron in the home column in Medulla”, the Mi1 neuron that belongs to the home column
in the Janelia Medulla dataset can be visualized (see Figure 2a far left in orange, and also
Video S3). The majority of the neuron morphology data do not have assigned cell types,
however. NeuronNLP still allows the user to probe certain neurons known in the literature.
For example, if the innervation pattern of such cells is known, the following queries can be
used: “show neurons that connect neuropil A to neuropil B” or “show neurons that have a
dendrite in neuropil A and an axon in neuropil B”. Queries can also be used to filter or
modify the current set of results, for example using “keep/remove cholinergic neurons”, it
is possible to filter neurons by the expression pattern of their neurotransmitter. [48] has
characterized over 20 types of Lobula Plate Tangential Cells (LPTCs) in the blowfly. Using
NeuroNLP, 8 types of LPTCs are revealed by a series of queries in NeuroNLP, as shown in
Figure 2b. 6 out of them each corresponds to a blowfly LPTC type, but the innervation
pattern of the other two have not been previously described (see Video S4).
In addition to finding previously known cell types, NeuroNLP supports the search for new
cell types. In Figure 2c, the NeuroNLP query reveals a new type of Lobula Plate intrinsic
(LPi) neurons that innervate layers 1 and 2 of the Lobulat Plate. These neurons are the
6bioRxiv preprint first posted online Mar. 18, 2019; doi: http://dx.doi.org/10.1101/580290. The copyright holder for this preprint
(which was not peer-reviewed) is the author/funder, who has granted bioRxiv a license to display the preprint in perpetuity.
All rights reserved. No reuse allowed without permission.
Figure 2: Querying from and building a cell-type map in FFBO. FFBO integrates different
fly brain data sources to provide a queryable cell type map. The wealth of neurons in the
database can be used to expand the current known cell-type map. (a) Neurons of existing cell
types can be directly queried by their name, e.g., “Show Mi1 neuron in the home column”.
Exemplary neurons are shown, from left to right, Mi1, Mi4, Mi9, Dm8 and Dm2. Inset
indicates the approximate location of these neurons in the brain (see also Video S3). They
can be accessed with the tag “paper:fig2a v2”. (b) 8 types of lobula plate tangential cells
(LPTCs) revealed by a series of queries in NeuroNLP. 6 of them each has a homology in
calliphora that was previously described in [48], and two of the shown types have no obvious
homology in the previous literature. With queries of presynaptic and postsynaptic partners,
it is possible to obtain, respectively, tentative circuits that give rise to the function of the
LPTC and subsequent circuits that further process information encoded in the LPTC (see
also Video S4). Access in NeuroNLP for: H1 with tag “LPTC-H1”, H2 with tag “LPTC-
H2”, H3 with tag “LPTC-H3”, H4 with tag “LPTC-H4”, CH with tag “LPTC-CH”, VS
with tag “LPTC-VS”, Unknown type 1 with tag “LPTC-unknown1”, and Unknown type 2
with tag “LPTC-unknown2”. (c) Queries in NeuroNLP also reveal a subset of Lobula Plate
intrinsic (LPi) neurons of the Lobulat Plate (on the left in the right Lobula Plate, see also in
NeuroNLP with tag “glutamatergic LPi v1”), that has a different tiling pattern from those
of the LPi neurons that innervates layers 3 and 4 as described in [49] (on the right in the left
Lobula Plate). Such a tiling pattern may suggest that these neurons may innervate layer
1 and 2 of Lobula Plate and interact with the T4 neurons that encode horizontal motion
in a similar way to the LPi neurons in layer 3/4 that interact with T5 neurons (see also
Video S5).
7bioRxiv preprint first posted online Mar. 18, 2019; doi: http://dx.doi.org/10.1101/580290. The copyright holder for this preprint
(which was not peer-reviewed) is the author/funder, who has granted bioRxiv a license to display the preprint in perpetuity.
All rights reserved. No reuse allowed without permission.
sister neurons of the LPi neurons that innervate layers 3 and 4 in [49] (see Video S5).
Building the Connectome NeuroNLP can be used to query the connectivity between fly
brain neurons. The resulting information is critical for constructing and exploring model
brain circuits and pathways. Brain circuits can be built up in the NeuroNLP workspace,
by combining results from successive queries, for example “add GABAergic neurons in EB”
or “add postsynaptic neurons”. Alternatively, individual presynaptic/postsynaptic partners
can be added to the scene through the information panel. The connectivity of the resulting
neural circuit can be exported from the GUI to a CSV file.
In Figure 3a-c, we demonstrate how to build a neural circuit responsible for visual motion
detection. The query about connectivity is highly intuitive. We start from a T4a neuron
(Figure 3a) that is known to be directional selective to front-to-back motion, and trace
back to the neurons that provide direct inputs to it by adding presynaptic neurons with
at least 3 synapses (Figure 3b), and those that provide indirect inputs by adding again
presynaptic neurons with at least 5 synapses from the result of the first query (Figure 3c).
This allows us to easily build a motion pathway and notice that not only columnar neurons
but also a large number of non-columnar ones may play a critical role in motion detection
(see Video S6).
In [50], a two-stage visual pathway between the medulla and the bulb (BU, or lateral triangle)
was uncovered. This identifies potential sources of visual input to ring neurons that link the
BU and EB neuropils; the latter is believed to maintain an internal compass of the fly.
Through a series of queries and GUI operations, we construct this pathway as shown in
Figure 3d. By combining connectivity and cell type information, it is possible to provide
more information, such as tentative neurotransmitter type for each of the neurons involved
in the pathway (see Video S7).
In light of the recent progress in understanding the brain structure of the larva [51], Neu-
roNLP for the larva Drosophila is also provided (see Figure S2). Thus, it is possible now
to compare larva and adult fly circuitry in, for example, the early olfactory system and
mushroom body (see Video S8).
Building the Synaptome Synapses can be added in NeuroNLP by using the information
panel. For each pre- and post-synaptic partner, we provide a button to add into or remove
from the workspace the synapses associated with the connection. In Figure 4a, we show
the distribution of synapses from columnar neurons onto T4a neurons. This type of neurons
have recently received major attention since they are the first neuron that exhibit a direction
selective response to visual motion. By a few simple steps (see Video S9), it is possible to
obtain a map of synapse onto T4a neurons similar to image provided by the data source
[42], but with more powerful interactive 3D visualization. We can repeat the construction
for other subtypes of T4 neurons (see Figure 4b-d).
In Figure 4e, we show the distribution of synaptic inputs and outputs of an Mi4 neuron in
Medulla strata 2-5. In Figure 4f, the locations of synapse between pairs of R7, R8 and Dm9
neurons in the color vision pathway are visualized. However, to complete the synaptome
information, it is necessary to also include data about neurotransmitter and receptor types
for the current available synapse information. We expect that such data will be provided in
8bioRxiv preprint first posted online Mar. 18, 2019; doi: http://dx.doi.org/10.1101/580290. The copyright holder for this preprint
(which was not peer-reviewed) is the author/funder, who has granted bioRxiv a license to display the preprint in perpetuity.
All rights reserved. No reuse allowed without permission.
Figure 3: Constructing neural pathways based on the connectivity map in NeuroNLP. (a-
c) Querying neurons in the visual motion detection pathway. Starting from a T4a neuron
(a) with tag “ffbo:fig3a v1”, that is known to be directionally selective to an ON motion
signal, we query a pathway in medulla that provides direct and indirect inputs to this T4a
neuron. (b) Adding presynaptic neuron to this T4a neuron with at least 3 synapses provides
the neurons that directly synapse onto the T4a neuron (tag: “ffbo:fig3b v1”). (c) Adding
presynaptic neurons to the neurons in (b) with at least 5 synapses expands the set of neurons
that provide indirect inputs to the T4a neuron. Columnar neurons in columns home and A-F
are colored with red, green, yellow, blue, magenta, cyan and brown, respectively. In addition
to the columnar neurons, a large number of non-columnar neurons (white) are involved in
the ON motion pathway (see also Video S6). Inset: Top-down view. Access in NeuroNLP
with tag: “ffbo:fig3c v1”. (d) Construction of a visual pathway into EB as described in
[50] using the connectivity map. Neurons from Medulla directly innervate the lower part of
the OPTU and make synaptic contact with the TB neurons. The TB neurons project to
the lateral triangle where ring neurons have their dendrites.(see also Video S7). Access in
NeuroNLP with tag “10.1038/nn.4581 v0.1”.
9bioRxiv preprint first posted online Mar. 18, 2019; doi: http://dx.doi.org/10.1101/580290. The copyright holder for this preprint
(which was not peer-reviewed) is the author/funder, who has granted bioRxiv a license to display the preprint in perpetuity.
All rights reserved. No reuse allowed without permission.
Figure 4: Using the synaptome map to probe the distribution of synapses. (a-d) Visualizing
synaptic sites of inputs to four subtypes of T4 neuron, each are known to be sensitive to
motion in one of the four cardinal directions. The 3D version can be accessed via tags: (a)
“T4a home inputs” for the T4a neuron (see also Video S9), (b) “T4b home inputs” for the
T4b neuron, (c) “T4c home inputs” for the T4c neuron and (d) T4d home inputs” for the
T4d neuron. The T4 neurons are shown in transparent cyan. Synaptic sites are indicated
by small spheres of different color. Each color correspond to synaptic input sites from a
different cell type, but can be from multiple of such cells. (green) Mi1, (red) Tm3, (yellow)
Mi4, (purple) Mi9, (cyan) C3, (dark blue) other T4 neurons, (white) presynaptic sites of
this T4 neuron. (e) Distribution of pre- and post-synaptic sites of a Mi4 neuron in Medulla
strata M2, M3 and M4. Majority of the inputs (shown in color dots) are located at the
lower part of the dendrite in M2 and M3, while the terminals (white dots) are located at the
upper part of the dendrite in M2. (green) inputs from Mi1, (purple) inputs from L5, (yellow)
inputs from Mi9, (orange) inputs from R8, (blue) inputs from Dm2, (red) inputs from Dm4,
(white) all outputs. (f) Distribution of synapses amongst a Dm9 neuron (blue) and an R7
(yellow) and an R8 (red) neurons. Sphere shows the location of synapses. (white) Dm9 to
R8 synapses. (green) Dm9 to R7 synapses. (cyan) R7 to Dm9 synapses. (purple) R8 to Dm9
synapses. (red) R8 to R7 synapses. Access in NeuroNLP with tag color input medulla”.
the near future.
Building the Activity Map In addition to providing a cell type map, a connectivity map,
and the synaptome, NeuroNLP also provides an interface for accessing neurophysiology data
to construct an activity map. Through NeuroNLP’s neurophysiology interface, users can
search for available physiological data for a particular cell type, select datasets of interest
and visualize them immediately in the web browser or download them in Neurodata Without
Borders (NWB) format [52]. To our knowledge, this is the first instance of a completely
searchable open physiology dataset for the fruit fly and we invite the research community to
contribute additional fruit fly physiology data on the FFBO platform.
Figure 5 shows FFBO’s neurophysiology interface. Here, we query physiology data for an
10bioRxiv preprint first posted online Mar. 18, 2019; doi: http://dx.doi.org/10.1101/580290. The copyright holder for this preprint
(which was not peer-reviewed) is the author/funder, who has granted bioRxiv a license to display the preprint in perpetuity.
All rights reserved. No reuse allowed without permission.
Figure 5: FFBO hosts an expanding activity map of the fruit fly brain, queryable in Neu-
roNLP. (a) Querying for physiology data for OS59b OSN recordings in a list of available data
that users can scroll through and add to a list of dataset to be downloaded in NWB format.
Each column shows a particular type of experiment where the input odorant waveform is
shown on the top and the averaged spiking rate is shown at the bottom. The number of
trials is indicated on the top. (b) Querying for physiology data for a photoreceptor.
OR59b olfactory sensory neuron and for a photoreceptor, as shown in Figure 5a and Fig-
ure 5b, respectively. The queries result in lists of available data that users can scroll through
and add to a list of dataset to be downloaded in the NWB format. Each column shows a
particular type of experiment where the input waveform is shown on the top and the output
at the bottom.
From Fruit Fly Brain Structure to Function with NeuroGFX
We present here a complete example of how NeuroGFX is used to construct the Central
Complex [30]. Figure 6 shows the NeuroGFX interface for the CX. On the left panel, the
biological structure of neuropils and neurons in the CX is visualized. On the right panel,
NeuroGFX is loaded with an executable circuit diagram of the CX that reflects the biological
data. The diagram is executable in that it is connected to a circuit model in the NeuroArch
database that can be retrieved by Neurokernel for execution.
On the local circuit level, NeuroGFX supports the exploration of the function of circuits of
manageable size, e.g., a canonical circuit or a basic building block in an LPU. In Video S10,
we construct a cartridge of the Lamina neuropil. The complete shape of neurons and con-
nectivity between neurons in a single cartridge of the lamina have been determined by serial
electron microscopy [13]. Using NeuroGFX, we visualize side by side both the morphology
11bioRxiv preprint first posted online Mar. 18, 2019; doi: http://dx.doi.org/10.1101/580290. The copyright holder for this preprint
(which was not peer-reviewed) is the author/funder, who has granted bioRxiv a license to display the preprint in perpetuity.
All rights reserved. No reuse allowed without permission.
Figure 6: NeuroGFX enables the exploration of circuit function from circuit structure.
A neuropil level exploration of the Central Complex (CX). The circuit structure of the
CX, including neuropils and neurons in the CX (left), are visualized in parallel with the
executable circuit diagram of CX (right). NeuroGFX loads the circuit model associated
with the diagram from the NeuroArch database. Its GUI enables users to remove/add
neurons in the circuit by clicking on the neurons in the left panel or the circuit diagram in
the right panel. Reconfiguration of the circuit is then done by the NeuroArch database, and
the resulting executable circuit is retrieved by Neurokernel for execution.
(skeletons) of the neuron and the circuit diagram.
The neural circuit configuration, manipulation and composition capabilities in NeuroGFX
are a significant step towards providing design automation tools for computational neuro-
science. We have already used these tools to develop and demonstrate computational models
for various subregions of the fruit fly brain including retina, lamina, antenna and antennal
lobe. Different implementations of the retina, independently developed [29, 53], can be in-
terfaced with the lamina, validating the composibility of LPU implementations enabled by
the design of the Neurokernel architecture [41].
Discussion
Recent tools in fly neurogenetics and neurobiology have unveiled a staggering and constantly
increasing amount of structural fruit fly brain data. While lagging behind, and thanks to
increasing massively parallel computing power, computational studies have focussed on the
emulation of the function of brain circuits. The link between the two has been largely lacking,
however.
12bioRxiv preprint first posted online Mar. 18, 2019; doi: http://dx.doi.org/10.1101/580290. The copyright holder for this preprint
(which was not peer-reviewed) is the author/funder, who has granted bioRxiv a license to display the preprint in perpetuity.
All rights reserved. No reuse allowed without permission.
The FFBO raises to this challenge by a tight integration of the neurogenetics, anatomy
and physiology data with computational modeling data of the fruit fly brain into a single
database. By endowing the FFBO with a powerful query, circuit execution and visualiza-
tion framework, we have taken a key step towards creating a platform for exploring and
validating brain function from structure. Among others, FFBO enables the comparison of
different computational models of the same brain circuit or reused circuit motifs as well as
the comparison between the function of analogous circuits in the adult and larva fly.
FFBO greatly increases the accessibility of fruit fly brain data, and provides tools for creating
structural circuits of interest. It also facilitates disseminating results of complex queries
through the use of tags, uniquely enabling a collaborative exploration and dissemination of
neural circuit compositions. Furthermore, FFBO provides neurophysiology data in public
domain, a first step towards building an activity map of the fly brain and for studying the
function of neural circuits and their biological validation. Finally, FFBO enables the study
of brain function on multiple levels of abstractions including the circuit and whole brain
level.
To meet the increase of future data [17], the underlying design of the main FFBO components
is scalable. For example, the NeuroNLP interface and its underlying NeuroArch database
are easily extensible with new data types and can handle large amounts of additional data.
Support for an in silico experimental workbench and for in silico optogenetic experiments
can be added as well.
For neurobiologists and neurogenetists, the tools we created will catalyze the discovery of
fly circuit function by creating a reservoir of neurons and neurons types that can be easily
targeted using genetics. For computational/theoretical neuroscientists, the tools will allow
them to transcend the physical limitations of biological experiments that generate massive
amounts of data. For computer scientists/engineers new architectures for deep learning net-
works can be explored. Model libraries built by computational/theoretical neuroscientists
and computer science/engineers will, in turn, enable easy to configure computational ex-
periments for neurogeneticists/neurobiologists to test various hypotheses. With these tools,
thereby, the FFBO ecosystem will accelerate the pace of creating computational models
of fly brain circuits, and of uncovering the logic of neuroinformation processing in the fly
brain.
Finally, we note that in order to create accurate large scale models of the brain of an
organism, independent labs must be able to easily share and integrate independently created
computational models. The standardized model of communication among LPUs makes such
an integration under FFBO a reality. Furthermore, by adopting the standards defined by
Neurodata Without Borders (NWB) [52] FFBO enables users to upload data to NeuroArch
in the NWB format. Note that a circuit model format has not yet been adopted in the
literature.
The key features of the FFBO differ in fundamental ways from other platforms such as
the Virtual Fly Brain [23] and the Insect Brain Database (https://insectbraindb.org).
While the Virtual Fly Brain and Insect Brain Database mainly serve confocal imaging stacks,
they do not provide any electrophysiology and imaging data. The point and click interface
13bioRxiv preprint first posted online Mar. 18, 2019; doi: http://dx.doi.org/10.1101/580290. The copyright holder for this preprint
(which was not peer-reviewed) is the author/funder, who has granted bioRxiv a license to display the preprint in perpetuity.
All rights reserved. No reuse allowed without permission.
they provide limits the comprehensiveness of the queries and the resulting data to be used
in designing and performing new experiments. This is to be contrasted with the simpler to
use and expression rich natural language interface provided by FFBO. More importantly,
both repositories also lack native support for integration of executable circuit models and,
anatomical and physiological data, i.e., these platforms lack tools for bridging structural
data and functional data.
By supporting the exploration of new neural pathways, new circuit diagrams and new exe-
cutable circuit models, FFBO has become a key resource for exploring the function of neural
circuits from structured data. The availability and easy of use of these capabilities have
raised a number of important new questions regarding the functional map of fruit fly brain
circuits. First, with the natural language processing interface of NeuroNLP we demonstrated
the visual display of known neural pathways. Can FFBO support the exploration of novel
pathways between an arbitrary pair of neuropils, say the optic lobes and the central complex
(see Figure 3)? Second, can the data shown in Figure 5 be displayed in conjunction with a
display of the putative neurons the recordings may be associated with? Third, can FFBO
support NeuroCAD utilities (see Figure 1) that enable the design of neural circuits akin to a
Computer Aided Design tool for silicon circuits? Fourth, the executable circuit in Figure 6
was designed and implemented by hand. An arbitrarily chosen subcircuit in the same figure
can be executed and functionally evaluated. Can arbitrary brain circuits be constructed,
executed and biologically validated?
The answer to all these questions is explored with the interactive open computing platform
FlyBrainLab, currently under development [54]. Users are encouraged to download and
contribute to its development. The results will be published elsewhere.
There are other efforts in the literature that aim at providing data repositories and soft-
ware tools for model organisms. Two major efforts stand out: the OpenWorm (http:
//openworm.org) and the Allen Brain Atlas (http://brain-map.org). The OpenWorm
project is dedicated to creating a virtual C. elegans in computer program with all features of
its behaviors, by crowdsourcing a community of computational neuroscientists and computer
scientists across the world [55]. The Allen Brain Atlas is a repertoire of brain data with an
emphasis on mouse as a model organism. Unlike the OpenWorm project driven by the open
source community, the Allen Brain Atlas is an in-house effort by an industrial-scale team
of researchers from the Allen Institute. It serves different stakeholders with various data
repositories, including the Allen Brain Observatory hosting in-vivo recording, the Cell Type
Database containing a survey of biological features, the Allen Software Development Kit for
data analysis and model simulation, and many other datasets and toolkits [56]. In alignment
with the OpenWorm project and the Allen Brain Atlas, FFBO champions the focus on model
organism in quest of understanding brain functions.
Methods
System Architecture of the Fruit Fly Brain Observatory The system architecture of
the FFBO consists of three levels of abstraction, as shown in Figure S1. The lowest level
14bioRxiv preprint first posted online Mar. 18, 2019; doi: http://dx.doi.org/10.1101/580290. The copyright holder for this preprint
(which was not peer-reviewed) is the author/funder, who has granted bioRxiv a license to display the preprint in perpetuity.
All rights reserved. No reuse allowed without permission.
consists of the (i) FFBO Processor operating as central control for registering services and
routing messages (ii) NeuroArch Database and associated APIs for querying and manipu-
lating the data, and (iii) Neurokernel Engine for the emulation of Drosophila brain circuits
on massively parallel GPU clusters. The mid level consists of the NLP Module, a natural
language translator for Neuroarch API access, a Visualization Engine for anatomy and phys-
iology data and, a Neural Circuit Design Module, a set of tools for exploring brain circuit
models. Finally, at the top layer, reside the NeuroNLP and NeuroGFX front-ends.
The messaging between components is handled using the Web Application Messaging Pro-
tocol (WAMP) (https://wamp-proto.org), stable implementations of which exist for all
major languages. The FFBO Processor serves as a WAMP router, and components provid-
ing services register their services with the FFBO Processor. Applications then call these
services using Remote Procedure Calls (RPCs). Multiple backend components can register
with the processor. For example, when multiple NeuroArch components launched on differ-
ent machines are registered, different users can be served on a local machine for better user
experience and redundancy.
Finally, all backend components are containerized using Docker (https://www.docker.com).
This allows for easy sharing, installation and deployment, and for compartmentalization of
the distributed components.
NeuroArch Database The NeuroArch data model preserves the structural and semantic
relationships between different biological and modeling objects. Its query interface provides
an object-graph mapping (OGM) that enables both neurobiologists and neural circuit model
designers to easily perform sophisticated queries relevant to their respective needs without
having to explicitly specify complex query strings. OGM provides methods associated with
each object that dynamically construct and execute queries. Two key differences between
NeuroArch’s OGM and that of currently available general purpose OGMs are (i) its use of
the hierarchical data model to enable extraction of subcircuits owned by nodes corresponding
to specific subdivisions of biological components or circuit abstractions, and (ii) its ability
to use the subgraph extracted by an OGM query as the starting point for traversals by
subsequent queries or as an operand that may be passed to graph operators. Thus queries
can be composed with other queries using various operators. For example, query results can
be added (union) or subtracted (difference), and thereby, novel, more complex, queries easily
constructed.
The Neuroarch API is exposed through a Remote Procedure Call (RPC) initiated by the
NeuroArch component; the latter component accepts a JavaScript Object Notation (JSON)
object. The JSON object specifies the method/operator, arguments for the method/operator
and the object or class to access the method/operator. Multiple access methods may be
specified in a single RPC call; an RPC specific results queue allows intermediate results
as the starting point or as operands for subsequent method/operator calls. Additionally,
the NeuroArch component maintains a user specific memory queue, allowing for subsequent
queries to act on present or past results.
Technical documentation and code for NeuroArch and NeuroArch component is available on
Github. Further information on the design considerations for NeuroArch data model and
15bioRxiv preprint first posted online Mar. 18, 2019; doi: http://dx.doi.org/10.1101/580290. The copyright holder for this preprint
(which was not peer-reviewed) is the author/funder, who has granted bioRxiv a license to display the preprint in perpetuity.
All rights reserved. No reuse allowed without permission.
API are described in Neurokernel RFC #5 [40].
Neurokernel Engine Neurokernel is an open-source engine implemented in Python for the
collaborative emulation and validation of fruit fly brain models on multiple Graphics Pro-
cessing Units (GPUs). Neurokernel defines communication interfaces that specify how spikes
and neuron membrane states are transmitted between LPU models. It provides the neces-
sary machinery for efficient transfer of information between different LPU implementations.
Other than the communication API, it does not impose any other restrictions on the LPU
implementation.
Technical documentation and the code is available on Github. Further information about
the API design and the implementation performance can be found in [41].
Natural Language Processing Module To translate natural language queries from Neu-
roNLP into machine code understandable by the NeuroArch API, the current NLP module
is built upon the Quepy framework (https://github.com/machinalis/quepy). The NLP
Module attempts to generate a semantic parse tree from the natural language query, opti-
mizes it where possible, and finally produces the NeuroArch API representation from the
optimized parse tree. If it fails to generate a semantic parse tree, it informs the requestor
that it could not interpret the query. Documentation and code is available on the Github
repository (https://github.com/fruitflybrain/neuroarch_nlp).
NeuroNLP Demos An easy-to-use scripting tool supports the creation of guided demon-
strations that can be composed by defining an ordered list of queries, user interactions and
informational messages to be displayed during the demonstration. We employ this func-
tionality to provide demos that help users to get started with NeuroNLP, and it can easily
be used to provide demos for specific educational or research dissemination purposes. The
demo scripts are formatted in JavaScript Object Notation (JSON). An example is provided
as following:
"demo1": {
"script": [
["notify", {"message": "Querying for Mi1 neurons",
"pause": 1000, "timeout": 2000}],
["search", {"query": "Show Mi1 neurons"}],
["click", {"label": "Mi1-home"]
]
}
NeuroNLP Tags The results obtained at any point of query, possibly through multiple
user interactions, can be shared easily using the ’tag’ feature, which can exactly recreate the
state of the sharer’s session on any modern browser, including smartphones, when shared
as a link to the public and/or collaborators. A tag consists of a complete snapshot of the
current workspace; loading the tag on any other device will recreate the same workspace,
including camera angles and neuron colors. Therefore, The tag feature can be used for easy
sharing of circuits, for recreation of figures from published papers or for use directly as 3D
interactive figures in publication, presentation and education.
16bioRxiv preprint first posted online Mar. 18, 2019; doi: http://dx.doi.org/10.1101/580290. The copyright holder for this preprint
(which was not peer-reviewed) is the author/funder, who has granted bioRxiv a license to display the preprint in perpetuity.
All rights reserved. No reuse allowed without permission.
Information Panel in NeuroNLP By clicking on a neuron displayed in the main workspace
of NeuroNLP, data associated with the neuron are shown in the information panel. For neu-
rons originated by the FlyCircuit database, we display a list including the GAL4 driver
used, putative neurotransmitter, gender and age, putative birth time and soma coordinate.
In addition, we show the confocal images of the neuron. These data are directly provided by
the FlyCircuit database. When available, we also include a link to the neuron in Virtual Fly
Brain. For neurons obtained using EM methods, we only list the neurotransmitter informa-
tion if they are available in the literature. The information panel also contains the synaptic
profile of the neuron. For neurons from FlyCircuit database, a bar chart is provided to
summarize the percentage of putative pre- and post-synaptic partners of each driver line. A
list of pre-synaptic and post-synaptic neurons is at users’ full disposal, showing the number
of putative synaptic contacts. Users can click on the ‘+’ button to add a neuron individually
to the workspace. For EM-based data, since precise number of synapses is available, they
are listed in the pre-synaptic and post-synaptic neurons. The bar chart is again used to
summarize percentage of each type of neuron that are pre- and post-synaptic to the neuron
in question. Moreover, for dataset in which information about individual synapses is avail-
able, the information panel provides a button to visualize all the synapses in their respective
position between the pre- and post-synaptic neurons.
Inferred Synaptic Connectivity Connectivity of neurons in the FlyCircuit database are
inferred via the method detailed in [25]. The dendritic and axonal terminals of each neuron
are inferred by the SPIN method detailed in [57].
Visualization Engine The visualization engine processes the anatomical data retrieved
from NeuroArch and renders the data in 3D in the web browsers at the user end. Two data
formats are supported by the engine: (i) the mesh format that represents a neuropil as a
3D surface consisting of vertices and triangular faces, and (ii) the SWC format that stores a
neuron as a 3D tree with vertices and edges. Each tree vertex is labeled with soma, dendrites
or other anatomical properties.
The visualization engine is built upon three.js (https://threejs.org), a cross-browser
JavaScript library for creating and displaying 3D computer graphics in web browsers. The
visualization engine provides a user with basic operations such as translation and rotation
as well as advanced features including changing colors and highlighting neurons.
To allow researchers to share customized neural circuits of interest among other researchers,
the API of the visualization engine supports importing and exporting the configuration of
a customized visualization from and to NeuroArch. This allows users to visualize the same
neural circuits with exactly the same configuration.
NeuroGFX User Interface Circuit diagrams in the NeuroGFX are created by hand in
Scalable Vector Graphics (SVG) format. They are loaded in NeuroGFX at a corresponding
level of abstraction and bound to biological structure by a custom javascript program. The
whole brain level diagram of the network of Local Processing Units (LPUs), i.e., model
abstractions of neuropils, is laid out based on [58]. Through the interface, the circuit diagram
can be reconfigured to include any subset of neuropils, allowing to probe how a particular
composition of neuropils leads to a specific brain function. On the neuropil level, NeuroGFX
17bioRxiv preprint first posted online Mar. 18, 2019; doi: http://dx.doi.org/10.1101/580290. The copyright holder for this preprint
(which was not peer-reviewed) is the author/funder, who has granted bioRxiv a license to display the preprint in perpetuity.
All rights reserved. No reuse allowed without permission.
allows users to study the I/O of each LPU. The circuit diagram of the CX is created according
to [30]. On the local circuit level, the focus of NeuroGFX is to explore the function of a circuit
of manageable size, e.g., a canonical circuit in an LPU, thereby facilitating the understanding
of the basic building blocks of their respective LPUs. The complete shape of neurons and
connectivity between neurons in a single cartridge of the lamina have been determined by
serial electron microscopy [13]. The circuit diagram of the cartridge is created according to
the connectome data. By clicking on the Load Cartridge button, NeuroGFX is instructed to
fire a series of queries to the NeuroArch Database where a model of the retina and lamina
network resides. Upon retrieving the circuit model, information about an individual neuron
can be shown by hovering the mouse over the neuron in the circuit diagram. When the Open
NK button is clicked, the Neurokernel Engine is instructed to retrieve the configured circuit
from the NeuroArch Database for execution.
Neural Circuit Design Module To facilitate interaction with circuit diagrams in Neu-
roGFX, the Neural Circuit Design Module offers a set of tools for manipulating neural circuits
in the scalable vector graphics (SVG) format. To enable seamless integration between the
circuit diagram and the 3D visualization of a neural circuit, additional attributes in the SVG
file associate an object in the diagram with the name of a neuron or with the property of a
synapse. The object based on JavaScript code can then be manipulated in the browser.
Code Availability and Current Hosting The source-code for the Fruit Fly Brain Obser-
vatory is publicly available on Github under the account https://github.com/fruitflybrain.
The FFBO is also publicly accessible at http://fruitflybrain.org using any modern web
browsers, including those running on smartphones. Core components of the FFBO have been
released in a containerized form to be easily installed and launched locally. In addition, a
repository available at https://github.com/fruitflybrain/ffbo.launcher can be used
to connect individual components such that any lab can easily host all FFBO services locally,
to access their own data, and independently develop interoperable network models. We also
provide an Amazon Machine Image to allow users to launch a full copy of the FFBO services
on Amazon Web Services EC2 with a few simple clicks.
Acknowledgements
The “Fruit Fly Observatory” was selected as a Phase I winner of the 2016 Open Science Prize
Challenge and was initially supported in part by the NIH, Wellcome Trust and HHMI. The
research reported here was also supported, in part, by NSF under grant #1544383, in part by
BBSRC #BB/M025527/1, in part by AFOSR under grant #FA9550-16-1-0410 and in part
by the Higher Education Sprout Project funded by the Ministry of Science and Technology
and Ministry of Education in Taiwan. The authors would like to thank Jonathan N. Martin
for contributing to FFBO installation and launcher scripts.
18bioRxiv preprint first posted online Mar. 18, 2019; doi: http://dx.doi.org/10.1101/580290. The copyright holder for this preprint
(which was not peer-reviewed) is the author/funder, who has granted bioRxiv a license to display the preprint in perpetuity.
All rights reserved. No reuse allowed without permission.
Author Contributions
A.A.L., A.-S.C., D.C., C.-C.L., P.R. conceived of the study. N.H.U., C.-H.Y., A.T. and
Y.Z. created prototype of the open-source platform, and improved it together with M.K.T.
and T.K.L.. Y.-C.H., C.T.W., N.H.U, C.-H.Y. Y.Z. C.L.O. processed data. N.H.U., A.T.,
C.-H.Y. Y.Z., C.L.O., D.F. contributed to computational modeling. N.H.U., C.H.Y., A.T.
Y.Z., D.C., and A.A.L. wrote the manuscript with input from the other authors.
References
1. Jeibmann, A. & Paulus, W. Drosophila melanogaster as a Model Organism of Brain
Diseases. Int. J. Mol. Sci. 10, 407–440 (2009).
2. Bellen, H. J., Tong, C. & Tsuda, H. 100 years of Drosophila research and its impact
on vertebrate neuroscience: a history lesson for the future. Nat. Rev. Neurosci. 11,
514–522 (2010).
3. Haberkern, H. & Jayaraman, V. Studying small brains to understand the building
blocks of cognition. Curr. Opin. Neurobiol. 37, 59–65 (2016).
4. Armstrong, J. D. et al. Flybrain, an on-line atlas and database of the Drosophila nervous
system. Neuron 15, 17–20 (1995).
5. consortium, T. F. FlyBase: a Drosophila database. Nucleic Acids Res. 25, 63–66 (Jan.
1997).
6. Meinertzhagen, I. A. & O’Neil, S. D. Synaptic organization of columnar elements in the
lamina of the wild type in Drosophila melanogaster. Journal of Comparative Neurology
305, 232–263 (1991).
7. Borst, A., Haag, J. & Reiff, D. F. Fly motion vision. Annu. Rev. Neurosci. 33, 49–70
(2010).
8. Gramates, L. S. et al. FlyBase at 25: looking to the future. Nucleic Acids Res. 45,
D663–D671 (Oct. 2016).
9. Perkins, L. A. et al. The Transgenic RNAi Project at Harvard Medical School: Resources
and Validation. Genetics 201, 843–852 (2015).
10. Dietzl, G. et al. A genome-wide transgenic RNAi library for conditional gene inactiva-
tion in Drosophila. Nature 448, 151–156 (2007).
11. Jenett, A. et al. A GAL4-driver line resource for Drosophila neurobiology. Cell Rep. 2,
991–1001 (2012).
12. Aso, Y. et al. The neuronal architecture of the mushroom body provides a logic for
associative learning. eLife 3, e04577 (2014).
13. Rivera-Alba, M. et al. Wiring economy and volume exclusion determine neuronal place-
ment in the Drosophila brain. Curr. Biol. 21, 2000–2005 (2011).
14. Takemura, S.-y. et al. A visual motion detection circuit suggested by Drosophila con-
nectomics. Nature 500, 175–181 (2013).
15. Takemura, S.-y. et al. Synaptic circuits and their variations within different columns in
the visual system of Drosophila. Proc. Natl. Acad. Sci. 112, 13711–13716 (2015).
19You can also read