To Click, Or Not To Click? - The Institute for Computing and ...
←
→
Page content transcription
If your browser does not render page correctly, please read the page content below

Bachelor thesis
              Computing Science

                  Radboud University

    To Click, Or Not To Click?
  A User Study on Phishing Click-Through Rates in
           Instant Messaging Applications

Author:                           First supervisor/assessor:
Reinier Sanders                         dr. Katharina Kohls
s4335422                                  kkohls@cs.ru.nl

                                          Second assessor:
                                          dr. Hugo Jonker
                                       hugo.jonker@ou.nl

                      March 19, 2021
Abstract

Phishing is a very common problem affecting businesses and individuals
on an almost daily basis. Many solutions have been proposed to mitigate
phishing on a technical level, but very few focus on the human aspects. We
conducted a user study with 49 participants in order to measure how users
perceive the trustworthiness of a message in an instant messaging (IM) ap-
plication. Knowing what users unconsciously perceive as trustworthy, we
can give useful recommendations to developers on how to improve security
warnings.

We found that users are mostly influenced by a link preview image which
does not fit the content of the rest of the message. Since the preview image
can be controlled by an attacker for phishing purposes, a new method of link
preview generation must be found. Least influential were URLs containing
http://, which poses a big security threat and IM applications should thus
provide better warnings for messages containing these. Finally, we found
that older and less experienced users of IM apps are more trustful of mes-
sages from unknown senders, so special warnings for these users should be
put into place.
Contents

1 Introduction                                                                                                    3

2 Background                                                                                                      4
  2.1 Phishing . . . . . . . . . . . . . . . . . .                .   .   .   .   .   .   .   .   .   .   .   .   4
      2.1.1 Example Phishing Attack . . . .                       .   .   .   .   .   .   .   .   .   .   .   .   4
      2.1.2 Phishing Today . . . . . . . . . .                    .   .   .   .   .   .   .   .   .   .   .   .   5
  2.2 Link Previews . . . . . . . . . . . . . . .                 .   .   .   .   .   .   .   .   .   .   .   .   5
      2.2.1 Generating Previews . . . . . . .                     .   .   .   .   .   .   .   .   .   .   .   .   5
      2.2.2 Security Threat . . . . . . . . . .                   .   .   .   .   .   .   .   .   .   .   .   .   6
  2.3 User Study . . . . . . . . . . . . . . . .                  .   .   .   .   .   .   .   .   .   .   .   .   6
      2.3.1 Data Generation . . . . . . . . .                     .   .   .   .   .   .   .   .   .   .   .   .   6
      2.3.2 Dunning-Kruger Effect . . . . . .                     .   .   .   .   .   .   .   .   .   .   .   .   6
  2.4 Statistical Analysis . . . . . . . . . . . .                .   .   .   .   .   .   .   .   .   .   .   .   7
      2.4.1 Null Hypothesis and Correlation                       .   .   .   .   .   .   .   .   .   .   .   .   7
      2.4.2 Pearson Correlation Coefficient .                     .   .   .   .   .   .   .   .   .   .   .   .   7
      2.4.3 Statistical Significance . . . . . .                  .   .   .   .   .   .   .   .   .   .   .   .   8

3 Methodology                                                                                                      9
  3.1 Online Survey . . . . . . . .   .   .   .   .   .   .   .   .   .   .   .   .   .   .   .   .   .   .   .    9
      3.1.1 Overview . . . . . .      .   .   .   .   .   .   .   .   .   .   .   .   .   .   .   .   .   .   .    9
      3.1.2 Phishing Messages .       .   .   .   .   .   .   .   .   .   .   .   .   .   .   .   .   .   .   .   10
      3.1.3 Open Questions . . .      .   .   .   .   .   .   .   .   .   .   .   .   .   .   .   .   .   .   .   11
      3.1.4 Data Collection . . .     .   .   .   .   .   .   .   .   .   .   .   .   .   .   .   .   .   .   .   11
  3.2 Usability Pre-study . . . . .   .   .   .   .   .   .   .   .   .   .   .   .   .   .   .   .   .   .   .   12
  3.3 Method Validity Post-study      .   .   .   .   .   .   .   .   .   .   .   .   .   .   .   .   .   .   .   13
  3.4 Recruiting Participants . .     .   .   .   .   .   .   .   .   .   .   .   .   .   .   .   .   .   .   .   13
      3.4.1 Convenience . . . . .     .   .   .   .   .   .   .   .   .   .   .   .   .   .   .   .   .   .   .   13
      3.4.2 Snowball . . . . . .      .   .   .   .   .   .   .   .   .   .   .   .   .   .   .   .   .   .   .   13

4 Results                                                                 14
  4.1 Usability Pre-study . . . . . . . . . . . . . . . . . . . . . . . . 14
  4.2 Method Validity Post-study . . . . . . . . . . . . . . . . . . . 14
  4.3 User Study . . . . . . . . . . . . . . . . . . . . . . . . . . . . 14

                                      1
4.3.1   Outliers . . . . .   . . . . . . . . . . .               .   .   .   .   .   .   .   .   .   .   14
        4.3.2   General Results .    . . . . . . . . . . .               .   .   .   .   .   .   .   .   .   .   15
        4.3.3   Data Grouped by      Age . . . . . . . .                 .   .   .   .   .   .   .   .   .   .   16
        4.3.4   Data Grouped by      Internet Use . . .                  .   .   .   .   .   .   .   .   .   .   17
        4.3.5   Data Grouped by      IM App Use . . .                    .   .   .   .   .   .   .   .   .   .   18
        4.3.6   Data Grouped by      Phishing Victim .                   .   .   .   .   .   .   .   .   .   .   19
        4.3.7   Data Grouped by      Detection Rating .                  .   .   .   .   .   .   .   .   .   .   20

5 Discussion                                                                                                     22
  5.1 Usability Pre-study . . . . . . .      .   .   .   .   .   .   .   .   .   .   .   .   .   .   .   .   .   22
  5.2 Method Validity Post-study . .         .   .   .   .   .   .   .   .   .   .   .   .   .   .   .   .   .   22
  5.3 User Study Results . . . . . . .       .   .   .   .   .   .   .   .   .   .   .   .   .   .   .   .   .   23
      5.3.1 General Results . . . . .        .   .   .   .   .   .   .   .   .   .   .   .   .   .   .   .   .   23
      5.3.2 Significant Correlations         .   .   .   .   .   .   .   .   .   .   .   .   .   .   .   .   .   24
      5.3.3 Other Results . . . . . .        .   .   .   .   .   .   .   .   .   .   .   .   .   .   .   .   .   25
  5.4 Future Research . . . . . . . .        .   .   .   .   .   .   .   .   .   .   .   .   .   .   .   .   .   25
      5.4.1 Online Platform . . . .          .   .   .   .   .   .   .   .   .   .   .   .   .   .   .   .   .   25
      5.4.2 Participants . . . . . . .       .   .   .   .   .   .   .   .   .   .   .   .   .   .   .   .   .   26
      5.4.3 Statistical Analysis . . .       .   .   .   .   .   .   .   .   .   .   .   .   .   .   .   .   .   26

6 Related Work                                                                                                   28

7 Conclusions                                                                                                    29

References                                                                                                       30

Appendix                                                                                                         31
  A.1 Website Source Code . . . . . .        .   .   .   .   .   .   .   .   .   .   .   .   .   .   .   .   .   32
      A.1.1 index.html . . . . . . .         .   .   .   .   .   .   .   .   .   .   .   .   .   .   .   .   .   32
      A.1.2 experiment.html . . .            .   .   .   .   .   .   .   .   .   .   .   .   .   .   .   .   .   33
      A.1.3 styles.css . . . . . . .         .   .   .   .   .   .   .   .   .   .   .   .   .   .   .   .   .   34
      A.1.4 script.js . . . . . . .          .   .   .   .   .   .   .   .   .   .   .   .   .   .   .   .   .   37
  A.2 Link Preview Images . . . . . .        .   .   .   .   .   .   .   .   .   .   .   .   .   .   .   .   .   45
  A.3 Tables . . . . . . . . . . . . . .     .   .   .   .   .   .   .   .   .   .   .   .   .   .   .   .   .   50
      A.3.1 Pre-study . . . . . . . .        .   .   .   .   .   .   .   .   .   .   .   .   .   .   .   .   .   50
      A.3.2 User Study . . . . . . .         .   .   .   .   .   .   .   .   .   .   .   .   .   .   .   .   .   50
      A.3.3 Outliers . . . . . . . . .       .   .   .   .   .   .   .   .   .   .   .   .   .   .   .   .   .   52
  A.4 Pearson Correlation Coefficient        .   .   .   .   .   .   .   .   .   .   .   .   .   .   .   .   .   53

                                        2
Chapter 1

Introduction

In 2020, 22% of the 3, 950 data breaches reported to Verizon Communica-
tions Inc. alone were caused by phishing attacks [1]. Of the attacks targeted
at companies in 2020, the average requested amount of money was $75, 000
[2]. From these numbers it is easy to conclude that phishing poses a big se-
curity and financial problem and that researching better methods to avoid it
are necessary. Unfortunately, people are generally unaware of security issues
[3] and not good at detecting phishing [4, 5]. It has been shown that security
warnings can help, but the method of warning can vary in effectiveness [6, 7].

Instead of focusing on technical solutions, like the use of artificial intelligence
[8], we instead study how humans actually perceive the trustworthiness of a
message. Knowing which factors are important in a user’s decision to click
on a link, might drastically improve the effectiveness of warning methods.
This study serves as a proof-of-concept for a large-scale field study.

We focus on human behaviour in a simulated instant messaging applica-
tion. Through a novel user study method, we measure how much a discord
between the link preview image and URL, format of the URL and familiarity
of the sender influences link click-through rate. These factors are measured
against a participant’s age, daily use of Internet and IM apps, whether the
participant has been the victim of phishing and how well the participant
grades their skill of phishing detection.

In this thesis we first provide some background information on the sub-
ject in Chapter 2. Then we present the method of our survey in Chapter
3. In Chapter 4 we present the results of our user study. Then, in Chapter
5, we will discuss the results as well as the methodology and provide rec-
ommendations for future research. In Chapter 6 we discuss how our study
compares to other research within this field. Finally, in Chapter 7 we draw
our conclusions.

                                        3
Chapter 2

Background

Before delving further into the methodology and results of the study, we
provide the necessary background information to understand the concepts
treated in this thesis. In Section 2.1 we define what phishing is and how
it works. Then, in Section 2.2 we explain how social media platforms and
instant messaging applications generate a link preview and how this can
be abused by attackers. In Section 2.3 we delve into what a user study is
and how it is performed. Lastly, in Section 2.4 we provide insight into the
statistical analysis method we use.

2.1      Phishing
A phishing attack is a scamming
method that involves an attacker
impersonating a trustworthy entity
                                                                                   2
and abusing the trust between the                             1
                                                                               Persuade

entity and a victim [9]. The attacker
                                                         Impersonate
sends a message to a victim, con-                                             Information

                                       Credit Card Company           Attacker      3      Victim
vincing them that the message orig-
inated from the impersonated party.           Figure 1: Example of a phishing attack.
The goal of the attacker is to pro-
voke an action from the victim through that message, which will cause the
victim to give sensitive information to the attacker willingly.

2.1.1      Example Phishing Attack
An example phishing attack is depicted in Figure 1: An attacker imper-
sonates a credit card company (Step 1 Figure 1). The attacker sends the
victim a forged message, persuading the victim to provide their credit card
information (Step 2 Figure 1). The victim, oblivious to the fact that they
are communicating with the attacker, provides it (Step 3 Figure 1).

                                               4
2.1.2    Phishing Today
Although scams are as old as time, the term phishing was not used until
January 2, 1996 to denote the cybercrime [10]. In the modern era the at-
tacker lures the victim to click on a hyperlink that takes them to a website
controlled by the attacker. Currently phishing is a very well known phe-
nomenon and attacks are carried out daily. A recent example is the 2020
SMS phishing attack1 in the Netherlands, where attackers impersonated de
Belastingdienst 2 [11].

2.2     Link Previews
One feature that enables phishing
attacks on social media is the link
                                                          1
preview. Most social media plat-
                                                          URL
forms and instant messaging appli-
cations, like WhatsApp [12], gener-
ate a small preview banner when a            Sender                  Application server
message containing a hyperlink is
sent. This preview gives the re-                          SSR              Link preview
ceiver of the message a meaning-
                                                          2                            3
ful first glance of the website’s con-
tents. The preview usually contains
a thumbnail image and the website’s
title and description.
                                         Target website                     Receiver
2.2.1    Generating Previews
                                         Figure 2: Sequence of generating a link preview.
The link preview is generated by the
application’s server, although the
information itself is provided by the
target website. This process is depicted in Figure 2. When a user inputs a
URL into a message, the client-side of the application sends the URL to the
server (Step 1 Figure 2). The server then uses server-side requests (SSRs)
to fetch the additional information from the target website (Step 2 Figure
2) [13]. Finally, the message along with the link preview data is sent to the
receiver (Step 3 Figure 2).
  1
     A phishing attack executed via SMS is also known as smishing. Other forms of
phishing exist as well, such as vishing (voice phishing).
   2
     De Belastingdienst is the Dutch tax and customs administration.

                                         5
2.2.2 Security Threat
This poses a potential security risk however [14]. Since the link preview
data is provided by the target website, an attacker can use this as an attack
vector [15]. Since the attacker has full control over any malicious websites
they construct, the attacker controls the information that the website sends
to the application’s server via the SSRs. They can thus intentionally make
the link preview look benign in order to trick victims to click on it.
2.3 User Study
To study the effect that different factors, such as link previews, have on link
click-through rates, we conducted a user study. A user study is a form of
survey and a method of data generation.
2.3.1 Data Generation
In a survey, data is obtained from a large group of people in a standardized
and systematic manner. It works by taking a sample from a larger popu-
lation and using the data gathered from the sample group to find patterns
and make generalized conclusions of the whole population [16]. The gener-
ated data can be quantitative, qualitative, or both. A user study specifically
focuses on how participants interact with something, or how they behave in
certain situations.
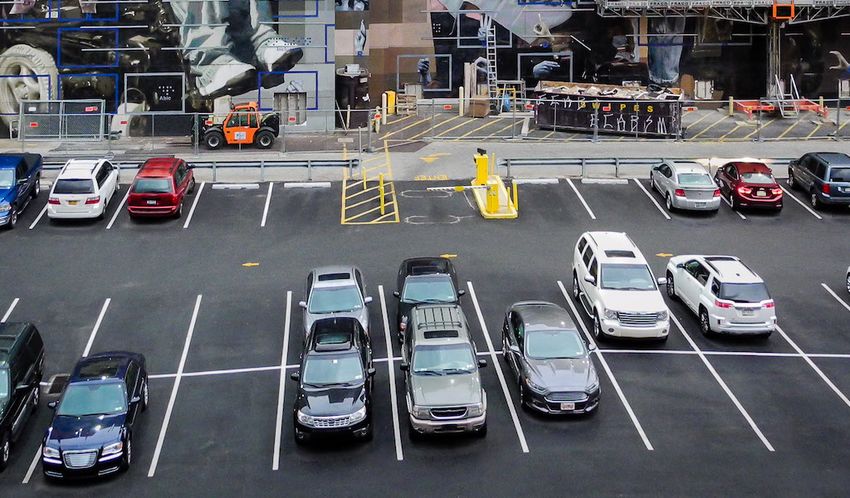
2.3.2 Dunning-Kruger Effect
Since our user study measures
human behaviour, effects studied
in social sciences come into play.
A well known psychological ef-
fect that influences survey results
is the Dunning-Kruger effect [17].
Confidence
It states that people overestimate
their abilities when their actual real
competence of a skill is low [18, 19].
Figure 3 shows the shape of this ef-
fect. Since it undermines the accu-
racy of some results, we have to take
it into account when designing our
user study, as well as during data Competence
analysis.
Figure 3: Dunning-Kruger Effect.
6
2.4       Statistical Analysis
In order to make sense of and draw conclusions from the raw quantitative
data our user study provides, a statistical analysis must be performed. The
goal of this analysis is to provide a general sense of the data and more
importantly, quantify and bring to light connections between two different
variables.

2.4.1      Null Hypothesis and Correlation
These connections are called correlations and they are predicted by the null
hypothesis.3 The null hypothesis is derived from a research question. Specif-
ically the null hypothesis is the assumption that the answer to the research
question implies there is no correlation between two variables. It is impor-
tant that the null hypothesis is falsifiable, meaning that it must be possible
to prove that the null hypothesis is false. This is done by gathering data and
using statistical analysis methods to determine the strength of correlations
between two variables. If the correlation is strong, then it is very unlikely
that the null hypothesis is true.

As the concept of a null hypothesis can be confusing, we provide an ex-
ample. The research question ”Are the grades of Computing Science un-
dergraduates influenced by a country’s wealth?” has the corresponding null
hypothesis: ”The average grade of Computing Science students is the same
across countries with different GDPs.”4 This implies there is no correlation
between a country’s wealth and students’ grades. However, if the data shows
that the average grades are sufficiently different, we can conclude that there
is a correlation and thus grades are affected by wealth.

2.4.2      Pearson Correlation Coefficient
Since the likelihood of the null
hypothesis being true is weighed
against the strength of a correla-
tion, mathematical tools are used
to quantify that strength. In this
study we use the Pearson correla-              Negative correlation   No correlation   Positive correlation

tion coefficient r [20]. The formula           Figure 4: Pearson Correlation Coefficient.
can be found in Appendix A.4.

  3
      The null hypothesis is often denoted as H0 .
  4
      A country’s GDP (Gross Domestic Product) is used to measure a country’s wealth.

                                           7
Pearson is based on the method of co-variance, where an increase in magni-
tude of one variable causes an increase in the other. The Pearson coefficient
gives information about the magnitude of the correlation, as well as the di-
rection of the relationship (negative or positive).

Each statistical analysis method makes a few assumptions about the data.
That is because not every method can be used for every kind of data. In
the case of Pearson, it is assumed that cases are independent of each other,
linearly related and the residuals scatter plot should be roughly rectangular-
shaped. If these assumptions are met, then Pearson can accurately deter-
mine a correlation between two variables. The closer r is to 1 or −1, the
stronger the connection. The closer to 0, the weaker. If r is exactly 1 or
−1, then the correlation is said to be perfect. If it is equal to 0, then there
is no correlation. These situations are depicted in Figure 4.

2.4.3    Statistical Significance
A strong correlation between two variables is unlikely to occur under the
null hypothesis. Exactly how unlikely is determined by a test of significance.
The significance is decided by a p–value. This value is computed from r and
compared to a predefined boundary α.5 If the found p–value is less than
α, then the observed results are so unlikely under the null hypothesis that
it can be rejected. In this study we use the online calculator from Social
Science Statistics to obtain the p–value from Pearson’s r [21].

   5
     Usually α has the value 0.05, but values 0.01 and 0.1 are also common. The lower α
is, the stronger the correlation needs to be in order to be statistically significant.

                                          8
Chapter 3
Methodology
Before moving on to the results of the study, we provide an in-depth de-
scription of our survey. In Section 3.1 we discuss the technical details of the
survey. In Section 3.2 we describe the usability pre-study we performed on
our survey. Then, in Section 3.3 we provide the details of the post-study
we performed on our survey in order to determine its validity. Lastly, in
Section 3.4 we explain how we reached participants.
3.1 Online Survey
The survey was done via a cus-
tom online platform. It was con- 1
ducted ex situ6 with 49 Dutch par-
ticipants over a period of two weeks.
The website is built using HTML, 2
CSS and JavaScript and hosted via
GitHub Pages.7 It is designed to
resemble the visual style of What-
sApp. Figure 5 shows what it looks 3 4
like. The website source code and
images used can be found in Ap-
pendix A.1 and A.2 respectively. Figure 5: Screenshot of the website.
3.1.1 Overview
When participants visit the website, they first see an introductory page
(index.html). On this page we welcome the participant and thank them
for their cooperation. Following that, the participants are given a short
6
Ex situ means off site in Latin, referring to the fact that there was no supervision
during the survey. The opposite is in situ, Latin for on site (i.e. with supervision).
7
The website is still online and can be found at https://reiniersanders.github.io/, even
though data is no longer being sent to us as the survey is concluded.
9overview of the two parts of the survey: the phishing messages and open
questions. We also provide an estimate of the duration of the survey, namely
10 minutes. Next we explain some important details about the website.
Since it is built with JavaScript, the participant’s browser must be able
to execute the code. Besides that, the website does not use cookies. This
means that progress is not saved between sessions. Once a participant closes
the browser, all data is lost. We then recommend the participant to execute
the survey on a laptop or PC, even though it also works on mobile devices.
Finally, we ensure the participant that all data is sent anonymously.
After the participant has read the introduction, they can click a button
that takes them to the survey (experiment.html). They will be shown the
phishing messages and open questions on this page. A first message instructs
the participant on the actions they can take during the survey. They are in-
structed to only click on a message if they trust it. Otherwise they can click
a button to skip it. We also describe where information is presented on the
screen. At the top of the screen we give a description of the person sending
the message (Step 1 Figure 5). In the middle of the screen the clickable
message containing the link preview and URL is shown (Step 2 Figure 5).
In the bottom-left corner of the screen is a button that takes the participant
to the next message (Step 3 Figure 5). Lastly, in the bottom-right corner of
the screen the participant can view their progress (Step 4 Figure 5).
3.1.2 Phishing Messages
Now that the participant is familiar with the layout and functionality of the
website, they click the button to properly start the user study. First off
participants are presented 40 different clickable messages one by one.
The 40 messages are split into 4 categories, corresponding to the different
variables we measure:
• 10 messages are completely neutral: the sender is described as ”well
known”, the link preview image corresponds to the URL and the URL
has a normal format. These act as a baseline.
• 10 messages have a link preview image that does not correspond to
the rest of the message, the sender is described as ”well known” and
the URL has a normal format.
• 10 messages have a deviating URL format. This is split further into
two groups of 5. The first subgroup has URLs beginning with http://
instead of https://, the second group’s URLs are long and contain
lots of unusual characters. Both groups’ sender is described as ”well
known” and the link preview image corresponds to the URL.
10• The final 10 messages have a different description of the sender. This
group is also split into two subgroups of 5 messages each. The first
subgroup has sender description ”an acquaintance”. The second sub-
group has sender description ”unknown”. Both groups’ link preview
image corresponds to the URL and the URL has a normal format.
The order of the 40 messages is shuffled, although it is shuffled the same
for each participant. If a participant clicks on a message they trust, the
index of that message is stored in an array for now and the next message is
displayed.
3.1.3 Open Questions
Following the 40 messages, the participants are given 6 open questions one
by one. These questions provide the data to which we compare the amount
of clicked messages. We ask the following:
• The participant’s age.
• How many hours the participant uses the Internet daily.
• How many hours the participant uses instant messaging applications
like WhatsApp daily.
• What the participant themselves perceive as the most important factor
when deciding to click on a message.
• Whether the participant has been the victim of a phishing attack in
the past.
• On a scale of 1 to 5, how well the participant thinks they are at
recognizing phishing messages.
Like the clicked messages, the answers to the questions are also stored in an
array for now.
3.1.4 Data Collection
When the participant is done with the open questions, the survey is con-
cluded. The participant is instructed to click a button which sends their
data to us. When successful, the website displays a popup that the data has
been sent and the participant is again thanked for their involvement. The
participant can now close the website.
When the participant ends the survey, the website prepares the data to
be sent via e-mail. Firstly, the website loops through the array containing
the indices of clicked messages and concatenates them into a single string.
11Each index is preceded by the character m and separated by a whitespace.
This is to increase the readability for us when organizing the data. Similarly,
the array of answers to the open questions is looped through and they are all
concatenated into a single string. Each answer is preceded by the number
of the corresponding question and the answers are separated by a newline,
again to increase readability. Finally, a unique 5-character ID is generated
that helps us keep track of the data during analysis.
The website uses smtpjs8 to cre-
ate and send an e-mail containing
the data. The subject line contains
the unique ID and the body con-
tains the two strings with data. Fig-
ure 6 shows an example of an e-
mail containing the data. The e-
mail is sent via Google’s mail server
(smtp.gmail.com). Using a Google Figure 6: An e-mail containing survey results.
App Password,9 the website is al-
lowed to log in to our Gmail account
and sends the e-mail to ourselves.
3.2 Usability Pre-study
In order to test the usability of the online platform, we conducted a small
pre-study with 5 people. They are instructed to perform the survey once
and afterwards we ask them the following:
• On which device they performed the survey.
• Whether the website is displayed correctly on that device and if not,
what the issue is.
• If it is clear how the website functions and if not, how it can be im-
proved.
• How long it takes to complete the entire survey.
• Whether that feels too long and if so, how it can be improved.
The pre-study participants were chosen because they had prior knowledge
of the subject of the study. For that reason, their results are not included
in the final data set.
8
This is a script that allows sending e-mails using only JavaScript.
9
This service creates a unique 16-digit password which is linked to a specific Google ac-
count. This allows the application exclusive access to the account, using the app password
instead of the actual password of that account.
123.3 Method Validity Post-study
Since the online survey is in essence a simulation of WhatsApp conversa-
tions, we performed a post-study to test the validity of this method. More
specifically, we measured whether a simulation of WhatsApp on the online
platform garners different results than the actual application itself.
To test this, we sent each of the 5 ’unknown sender’ messages to 5 peo-
ple on WhatsApp. We sent the messages from a phone number we were
certain of they would not know.10 We chose these people randomly from a
group of participants who confirmed they did the survey and who we could
contact afterwards. After we sent the message and got the confirmation that
they read it, we used a known number to ask them if they felt the message
was more, less or as trustworthy as when they saw it in the online survey.
3.4 Recruiting Participants
In order to reach participants for the online user study, we used two non-
probabilistic sampling techniques:11 contact via convenience and the snow-
ball method.
3.4.1 Convenience
Initially participants were reached through convenience. We sent invitations
to family members and friends via WhatsApp, reaching 57 people. We also
posted the invitation on Facebook [22], potentially reaching an additional
880 people.12 Only 4 people that were not yet contacted through other
means interacted with the Facebook post in the form of a like or comment.
Therefore we are certain that at least 61 people received our invitation
through this method.
3.4.2 Snowball
To reach a wider group and getting a more diverse distribution of age groups,
we utilized the snowball method as well. In the invitation we urged partic-
ipants to forward it to their family, friends and colleagues. It is unknown
exactly how many people were reached this way.
10
We used the work phone from one of our partners and made sure that nobody could
see their account information (profile picture, name and status).
11
Non-probabilistic sampling results in a non-equal sample group. Probabilistic sam-
pling results in equal, more random sample groups.
12
As Facebook does not provide metrics for the reach of a post for non-commercial
pages, it is uncertain how many people actually saw it on their timeline.
13Chapter 4
Results
In this chapter we present the results of the study. In Section 4.1 we present
the results of the usability pre-study. Then, in Section 4.2 we show the
results of the validity post-study. Finally, in Section 4.3 we present the
results of the user study itself.
4.1 Usability Pre-study
All of the participants replied that the site displayed properly on the device
they used, as well as the fact that all participants reported that it is clear
how the website functions. Lastly, none of the participants reported that
the survey took too long to complete. The specific results of the pre-study
can be found in Appendix A.3.1.
4.2 Method Validity Post-study
4 of the 5 post-study participants reported that the message they received
on WhatsApp feels equally trustworthy (or rather, a lack thereof) as the
same message during the online survey. The other remaining participant
reported it feels less trustworthy to receive the message directly on their
own phone via WhatsApp.
4.3 User Study
Finally we present the results of the survey itself. The tables containing the
data can be found in Appendix A.3.2.
4.3.1 Outliers
Unfortunately some of the data generated during the survey is not usable.
We choose to omit the data of 7 participants. For some this is based on the
14fact that they did not click on any message, greatly influencing averages. For
others this is based on their answers to the open questions. It was clear that
in their case we were not successful in instructing them to focus on trust
during the survey. The last participant’s data is omitted for both of the
previous reasons. The omitted data can still be found in Appendix A.3.3.
4.3.2 General Results
Now that we excluded the data that influences the averages too greatly, we
can properly present the results of our user study. First we look at the gath-
ered data across the remaining 42 participants, starting off with the clicked
messages.
We measure that an average of 74.52% (median = 80%, mode = 90%, stan-
dard deviation = 24.32%) of the neutral baseline messages were clicked,
giving us a reference to compare the other data with.
Next, when we look at the link preview image, we can see that only an aver-
age of 29.52% (median = 20%, mode = 0%, standard deviation = 30.76%)
of these messages were clicked. With a difference of about 45% less clicks
on average compared to the baseline, this is a steep drop-off.
Links that start with http:// instead of https:// have a much smaller
difference. 65.24% (median = 80%, mode = 100%, standard deviation
= 39.28%) of these messages were clicked, only about 10% less than the
baseline.
38.10% (median = 30%, mode = 0%, standard deviation = 34.73%) of links
that contain a lot of characters were clicked on average. Like the preview
images, this is a lot less than the baseline.
Then we proceed to the messages sent by ’an acquaintance’. With 53.33%
(median = 60%, mode = 80%, standard deviation = 32.06%) clicks on av-
erage, the difference with the baseline is noticeable.
Finally we look at the messages from an ’unknown’ sender. The results
here are comparable to those of the long link messages: 36.67% (median
= 20%, mode = 0%, standard deviation = 43.26%) were clicked, almost
40% less than the baseline messages.
Next we take a look at the results provided by the open questions.
We measure that the average participant is 32.93 years old (median = 26
years, mode = 24 years, standard deviation = 15.93 years).
15On average, they spend 6.13 hours on the Internet (median = 5 hours, mode
= 8 hours, standard deviation = 3.33 hours) and 2.24 hours on instant mes-
saging apps (median = 1.5 hours, mode = 1 hour, standard deviation = 2.55
hours) every day.
21.43% of participants report to have been the victim of a phishing at-
tack in the past and on average, a participant grades themselves with a 3.86
out of 5 when it comes to detecting phishing messages (median = 4, mode
= 4, standard deviation = 0.75).
4.3.3 Data Grouped by Age
Now that we have an overview of all the results, we can focus on specific
areas and spot some interesting trends. Starting off, we order the data by
age and group it together such that we end up with 6 different age groups.
We take a look at the clicked messages first, detailed in Table 1.
Table 1: Average % of message clicks, grouped by age.
Age group Group size Baseline Preview image http Long link Acquaintance Unknown
18 - 24 16 75.63 40.63 62.5 53.75 52.5 16.25
25 - 34 16 73.13 20.63 77.5 36.25 48.75 43.75
35 - 44 2 50 25 50 40 50 40
45 - 54 0 - - - - - -
55 - 64 3 83.33 36.67 26.67 6.67 73.33 73.33
65+ 5 80 20 64 12 60 56
There are two noteworthy trends here that we present in more detail. Firstly,
when comparing the age groups to the average amount of long links clicked
per group, we can see a significant negative correlation (r = −0.94, p = 0.04,
statistically significant under α = 0.1), displayed in Figure 7.
Figure 7: Significant correlation between age Figure 8: Significant correlation between age
group and long link clicks. group and unknown sender message clicks.
Secondly, there is a significant positive correlation when we compare age
group to the amount of clicks on messages by an ’unknown’ sender (r = 0.84,
16p = 0.09, significant under α = 0.1). Comparisons with the other messages
do not yield any significant correlations.
We now take a look at the average results of the open questions grouped by
age. The results are displayed in Table 2.
Table 2: Average open question results, grouped by age.
Age group Group size Internet use (hrs / day) IM app use (hrs / day) Phishing victims (%) Detection rating
18 - 24 16 8.2 2.66 6.25 3.88
25 - 34 16 5.53 2.75 31.25 3.88
35 - 44 2 5 0.75 0 4
45 - 54 0 - - - -
55 - 64 3 5 1 66.67 4.33
65+ 5 2.8 0.65 20 3.4
Again, there are two noteworthy correlations. We find significant negative
correlations by comparing the age groups to the average amount of daily
Internet use (r = −0.88, p = 0.02, statistically significant under α = 0.1)
and daily instant messaging app use (r = −0.83, p = 0.06, statistically
significant under α = 0.1). These correlations are depicted in Figures 9 &
10 respectively.
Figure 9: Significant correlation between age Figure 10: Significant correlation between age
group and daily Internet use. group and daily IM app use.
4.3.4 Data Grouped by Internet Use
If instead of ordering the data by age, we order it by the amount of daily
Internet usage and group by that, we also find some interesting results. We
look at the clicked messages first, as shown in Table 3. We have to omit the
data of 2 participants, as they did not report on their Internet use.
Table 3: Average % of message clicks, grouped by daily Internet use.
Internet use (hrs / day) Group size Baseline Preview image http Long link Acquaintance Unknown
1-3 9 70.00 30 44.44 13.33 53.33 48.89
4-6 15 79.33 29.33 72 32 57.33 37.33
7-9 7 77.14 15.71 82.86 40 51.43 42.86
10 - 12 9 76.67 43.33 57.78 71.11 55.56 22.22
17There is one clear trend here to
note. There is a significant pos-
itive correlation between the daily
use of Internet and amount of clicks
on messages containing a long link
(r = 0.97, p = 0.03, significant un-
der α = 0.1). This correlation is dis-
played in Figure 11. There is also a
strong negative correlation between
Internet use and unknown sender Figure 11: Significant correlation between Inter-
net use and long link message clicks.
message clicks, but it is not statisti-
cally significant.
Table 4: Average open question results, grouped by daily Internet use.
Internet use (hrs / day) Group size Age IM app use (hrs / day) Phishing victims (%) Detection rating
1-3 9 48.89 0.97 37.5 4.11
4-6 15 30.13 1.57 13.33 3.4
7-9 7 27.57 2.21 13.33 4
10 - 12 9 27.44 4.5 11.11 4.22
From the results in Table 4, it
follows that there is a single sig-
nificant correlation between Inter-
net use and IM app use (r =
0.94, p = 0.06, significant un-
der α = 0.1), as shown in Fig-
ure 12. There are also strong
negative correlations between In-
ternet use and age, and Internet
use and phishing victim, but these
are both not statistically signifi- Figure 12: Significant correlation between Inter-
net use and IM app use.
cant.
4.3.5 Data Grouped by IM App Use
If instead of grouping the data by Interent use, we group it by instant
messaging app use, there are three interesting observations to be made.
First we take a look at the clicked message results in Table 5.
Table 5: Average % of message clicks, grouped by daily IM app use.
IM app use (hrs / day) Group size Baseline Preview Image http Long link Acquaintance Unknown
0-2 22 75.45 25 53.64 26.36 54.55 41.82
2-4 17 76.47 35.88 80 50.59 60 35.29
4-6 2 40 0 50 40 0 10
6+ 1 90 80 100 80 20 0
18There is a single significant neg-
ative correlation between IM app
use and the amount of clicks on
messages by an ’unknown’ sender
(r = −0.97, p = 0.03, significant
under α = 0.1), shown in Figure
13. There is also a strong posi-
tive correlation between IM app use
and clicks on messages with long
links, but it is not statistically sig- Figure 13: Significant correlation between IM
app use and unknown sender messages.
nificant.
Table 6: Average open question results, grouped by daily IM app use.
IM app use (hrs / day) Group size Age Internet use (hrs / day) Phishing victims (%) Detection rating
0-2 22 40.36 4.55 31.82 3.77
2-4 17 24.88 7.4 11.76 3.88
4-6 2 24 11 0 4.5
6+ 1 26 12 0 4
When we look at the open question results in Table 6, it follows that there is a
significant positive correlation between IM app and Internet usage (r = 0.98,
p = 0.02, significant under α = 0.1), displayed in Figure 14. Shown in Figure
15 is the last interesting finding: a significant negative correlation between
IM app use and % of phishing victims (r = −0.92, p = 0.08, significant
under α = 0.1).
Figure 14: Significant correlation between IM Figure 15: Significant correlation between IM
app and Internet use. app use and phishing victims.
4.3.6 Data Grouped by Phishing Victim
Next we group the data by whether the participant has been the victim of
phishing in the past. We have to omit the data of 1 participant, as they did
not report on whether they are a phishing victim. In Table 7 we can see the
results of the clicked messages.
19Table 7: Average % of message clicks, grouped by phishing victim.
Phishing victim Group size Baseline Preview image http Long link Acquaintance Unknown
Yes 9 86.67 22.22 82.22 31.11 60 55.56
No 32 70.63 31.25 60 41.25 52.5 32.5
From the data it follows that people who are not phishing victims click on
about 16% less of the neutral messages, compared to those who are. There is
only a small difference in clicks on messages with a deviating preview image.
When looking at the messages containing links that start with http://, we
can see a large difference of about 22% more clicks by phishing victims.
For both the clicks on messages with long links and those sent by an ’ac-
quaintance’, we only measure small differences between both groups. For
messages sent by ’unknown’ senders however, we measure a large difference
of about 23%.
Table 8: Average open question results, grouped by phishing victim.
Phishing victim Group size Age Internet use (hrs / day) IM app use (hrs / day) Detection rating
Yes 9 37.33 4.67 1.28 3.44
No 32 32.00 6.6 2.94 4
From the open question results in Table 8 it follows that both groups are
roughly the same age. There is a clear difference in the use of Internet and
IM apps however. We measure that on average, phishing victims use the
Internet almost 2 hours less each day than non-victims. The same goes
for the use of IM apps, although the difference is slightly less, at almost a
100 minutes. We also measure that phishing victims grade themselves a bit
lower when it comes to phishing detection.
4.3.7 Data Grouped by Detection Rating
Finally, we group the data by the participants’ self-reported detection rating
and make two noteworthy observations. Again, we first look at the clicked
messages, displayed in Table 9.
Table 9: Average % of message clicks, grouped by detection rating.
Detection rating Group size Baseline Preview image http Long link Acquaintance Unknown
2 2 70 5 70 20 60 50
3 9 83.33 30 82.22 40 55.56 37.78
4 24 72.08 31.25 63.33 39.17 51.67 33.33
5 7 72.86 30 48.57 37.14 54.29 42.86
Comparisons between detection rating and the different kinds of messages
do not yield any statistically significant results. On the contrary, when we
look at the results of the open questions grouped by detection rating in
Table 10, there are two remarkable trends.
20Table 10: Average open question results, grouped by detection rating.
Detection rating Group size Age Internet use (hrs / day) IM app use (hrs / day) Phishing victims (%)
2 2 46 5 0.75 50
3 9 29.78 5.22 1.72 33.33
4 24 33.04 6.5 2.57 20.83
5 7 32.86 6.43 2.21 0
There is a significant positive correlation between detection rating and use
of the Internet (r = 0.91, p = 0.09, significant under α = 0.1), as shown in
Figure 16. In Figure 17, the other finding is depicted. In this figure we see
the significant negative correlation between detection rating and phishing
victims (r = −0.99, p = 0.005, statistically significant under α = 0.1).
Figure 16: Significant correlation between de- Figure 17: Significant correlation between de-
tection rating and Internet use. tection rating and phishing victims.
21Chapter 5
Discussion
In this chapter we reflect on various aspects of the study. We discuss the
results, implications of those results and give recommendations to future
researchers on how to improve on our method. In Section 5.1 we start by
discussing the pre-study. In Section 5.2 we discuss the post-study. In Section
5.3 we discuss the results of the user study. Lastly, in Section 5.4 we discuss
our methodology.
5.1 Usability Pre-study
The main goal of the pre-study was finding out how usable the website is and
whether all information is conveyed correctly. To that end we are happy that
the results reflect a well performing online platform. Although the sample
size of 5 is really small, we get the impression that the platform we built
is usable, clearly conveys information and the survey does not eat up too
much time from the participant. A pre-study with more participants could
reinforce this belief.
5.2 Method Validity Post-study
The goal of the post-study was to find out if our novel method of generating
data is accurate. Given the fact that 4 of the 5 participants reported the
same level of weariness during the survey as on WhatsApp on their own
phones, we are confident that data generated through the website is valid
and accurate. Still it should be noted that, like in the pre-study, our sample
size of 5 people is very small and more confidence in the validity of the
method can be obtained with a larger sample group.
225.3 User Study Results
Continuing with the results of the user study itself, there are some interesting
findings we discuss in more detail.
5.3.1 General Results
First off we discuss the general results. We see that on average about 75%
of the baseline messages are clicked. This gives us an indication that the
average user ignores about a quarter of all messages. This could imply that
the actual click-through rate of any message should be about 133% higher
than we measured, assuming that in a real-life scenario a user clicks on all
links they deem trustworthy.
Starting with the link preview images, we discuss each factor in general.
We see that they have the most impact on click-through rates. This is a
strong indication that the accompanying image contributes the most to the
trustworthiness of a message. If a different system to generate link previews
is implemented, specifically one where an attacker does not control the im-
age, then according to our data a lot of people would be able to immediately
spot that something is wrong when the website is malicious.
Messages starting with http:// are far more devious. Normally, a browser
indicates whether a URL begins with http://, but in an instant messaging
application the receiver is only presented with the plain link. According to
our data, very few people are actually able to spot this. Since data sent via
http:// is not encrypted, this poses a large threat. Therefore, instant mes-
saging applications should indicate that a message containing a link starting
with http:// is potentially unsafe, thereby warning the user. Links that
contain a lot of characters had a big effect, although a bit smaller than the
preview images. This indicates that the average user is already distrustful
of long links.
Then if we look at the different levels of sender familiarity we spot a clear
trend. Messages sent from an ’unknown’ sender were clicked roughly 20%
less than those from ’an acquaintance’. In turn, those were also clicked
roughly 20% less than the baseline messages. Thus we clearly see this has
an effect on click-through rates. Since the average user is already distrustful
of messages sent by ’unknown’ senders, more emphasis should be given by
instant messaging applications on the potential danger of messages sent by
’an acquaintance’, or someone posing as one.
235.3.2 Significant Correlations
Next we discuss the significant correlations that emerge from our data, start-
ing with the data that is grouped by age. The significant relationship be-
tween age group and the amount of clicks on long links could be the result of
younger people having more experience with the Internet and are therefore
more comfortable with oddly formatted URLs. This is supported by the
fact that there is a significant difference in the daily use of the Internet and
instant messaging apps between age groups, as well as a significant correla-
tion between daily Internet use and the amount of long link messages clicked.
Younger people use the Internet and IM services more and are therefore more
experienced with it, resulting in more lenience towards ’weird’ URL formats.
Even though on average people ignore most messages from ’unknown’ senders,
there is a significant correlation between age group and clicks on these mes-
sages. We see that younger people click these messages much less than older
age groups. Since from this we derive that older people are less observant of
the sender, a warning should be given when a message from an ’unknown’
sender is received.
The reverse is true for the relation between instant messaging app use and
clicks on ’unknown sender’ messages. The more someone uses messaging
services, the less likely they are to click on these. Like with the long links,
we attribute this to experience. The more a person uses instant messaging
services, the better they are at identifying possible malicious senders. This
is supported by the relation between daily IM app use and phishing victims.
The more someone uses instant messaging services, the more experienced
they are at detecting malicious messages. This results in less people falling
victim to them. Therefore warnings should be given to people that are not
experienced with instant messaging applications, when they receive mes-
sages from ’unknown’ senders.
The fact that people get better at detecting phishing the more they use
the Internet and its services, is supported by the correlation between daily
Internet use and the phishing detection grades participants gave themselves.
Since there is a significant relation between Internet use and detection rat-
ing, as well as between detection rating and phishing victims, we derive that
people more accurately spot potential dangers on the Internet when they
are more experienced with it. It should be noted that due to the Dunning-
Kruger Effect, more participants should be on the lower end of this rating.
Considering that, the results would still show a downward trend when com-
paring the adjusted rating scores to the amount of phishing victims within
each grade.
245.3.3 Other Results
In this study, the messages were also accompanied by a small piece of text.
We did not treat this as a changing variable as it was simply a small flavor
text describing the URL. It might be interesting and give more insights if
the influence of this text is also researched.
Since it falls outside the scope of this study, we unfortunately do not evalu-
ate the factors that participants reported as being the most important. We
see that most of them reported that the person sending the message is most
influential, but we do not analyze it in greater detail.
5.4 Future Research
In this section we discuss our method and provide recommendations for
future researchers.
5.4.1 Online Platform
The advantages of a user study and survey-based research in general, are
that it provides a lot of data in a short time and without a lot of (financial)
effort. It provides a wide and inclusive coverage of samples, such that gen-
eralized conclusions can be drawn. It lends itself well to quantitative data
analysis and is easily reproducible [23].
The downsides of user studies and surveys are that they lack depth. They
do not provide much detail, but instead focus on a wide coverage. Further-
more, aspects of the research topic that cannot be counted and measured
tend to be overlooked, as they cannot be subjected to statistical analysis.
A user study only provides a snapshot of a particular point in time, cannot
establish cause and effect and it may be difficult to determine the accuracy
or honesty of people’s responses [24].
Besides the up- and downsides of the user study, we also provide a few
technical recommendations. Although the pre-study results show us that
the website conveys its information clearly, there was still some confusion
between a few participants. Perhaps if more emphasis is given to what a par-
ticipant can do and is required of them, the survey results can be improved
and less outliers will have to be set aside. Furthermore, the messages are
currently shuffled the same for all participants. In order to eliminate order
bias, the messages should be shuffled differently for each participant. Lastly,
the website could make use of cookies to save a participant’s progress be-
tween sessions. This allows participants to continue where they left off,
should the website be closed before completion.
255.4.2 Participants
On the part of recruiting and managing participants we give a few recom-
mendations as well. The main recommendation is that a different strategy
should be used to reach participants. In this study we used convenience and
the snowball method, the main advantage of which is that it is very easy
to reach a lot of people without a lot of effort. The big downside however,
is that there is an over-representation of people close to us and within our
age group. All our participants are Dutch and most of them are in the age
groups 18 − 24 and 25 − 34. None of the participants are in the age group
45 − 54. For that reason it is important to think about how to reach other
age groups and people outside personal circles. In a large-scale field study
a more diverse range of age groups, cultural and educational backgrounds
should be reached to gain more accurate results. Thus a probabilistic sam-
pling technique should be used instead of our strategy.
Whichever strategy is used, it might be useful to keep track through which
method people ended up at the survey. For instance, in our case we have
no data to inform us how effective the snowball method was. We only have
partial metrics on the participants reached through convenience.
Lastly, since we measure unconscious behaviour, the actual variables we
measure should be kept secret to the participant. For instance, if a par-
ticipant knows we measure how often they look at the person sending a
message, they might put conscious effort into that, which skews results.
5.4.3 Statistical Analysis
Finally we provide recommendations for our statistical analysis method. As
with a lot of other statistical analysis methods, caution should be exercised
as statistics can sometimes produce spurious correlations. For example when
comparing the total revenue of arcades with the amount of computer sci-
ence doctorates awarded in the U.S.13 , they might both increase over time
but obviously there cannot be any causal relationship. The caveat is that
correlation between two variables does not imply causation.
Furthermore, in this study we used the Pearson correlation coefficient, which
is most often used for jointly normally distributed data (data that follows
a bivariate normal distribution). For non-normally distributed continuous
data, ordinal data or data with relevant outliers, a Spearman rank correla-
tion should be used instead [25]. In our case these two methods produce the
same results as our data can also be ranked.
13
The humorous book Spurious Correlations by Tyler Vigen contains a plethora of
ridiculous correlations like this one.
26Lastly, in this study we compare the generated p values to a predetermined
value α. The value of α may be chosen freely and is most often set to 0.05.
In our case however, we decided to choose α = 0.1. This results in a bit
more lenience for the value of p in order for a relation to be statistically
significant. We chose this value because our sample size of 49 (of which
42 are usable) participants is quite small. If the sample size is larger, the
boundary of α can be more strict, as a significant result is more impactful
when α is lower. Still, a value of 0.1 is not uncommon in scientific research.
27Chapter 6
Related Work
Combating phishing often involves technical solutions like Artificial Intel-
ligence [8], in order to produce more accurate spam and phishing filters.
However, it might pay off to also study the human aspects of phishing at-
tacks [26].
Since people are generally unable to accurately recognize phishing messages
[4, 5] and current security warning methods do not suffice [6], measuring
what a user looks for in terms of trustworthiness when presented with a
message can be of great value. Especially since people generally perceive
privacy and security as unimportant [3], it falls into the hands of developers
to increase security and security awareness. Providing relevant recommen-
dations on how to improve those aspects effectively, is vital to that goal.
In that way our study distinguishes itself by using a novel method to mea-
sure a user’s perception of trust within IM applications. We have provided a
solid foundation on which larger-scale field studies can build, as well as rel-
evant information that IM app developers can already use to improve their
security.
28Chapter 7
Conclusions
From the results of our user study with 49 Dutch participants, we can con-
clude that each of the hypothesized factors exerts at least some influence
over click-through rates. On average the link preview image contributes the
most as these messages were clicked the least. URLs that contain a lot of
characters and messages sent by unknown senders also negatively influence
click-through rate greatly, although less than the preview images. Users that
are younger, or more experienced with the Internet and IM applications are
more lenient towards messages with long links that contain lots of charac-
ters than older, or less experienced users. Messages sent by acquaintances
are clicked more than messages sent by unknown senders, although older
or less experienced Internet and IM app users click more on messages from
unknown senders than younger, or more experienced users. Messages con-
taining links that start with http:// influence click-through rate the least.
A different system to generate link previews should be implemented, as
users are perceptive of any deviating link preview images. Specifically a sys-
tem where an attacker can not control the link preview information. Users
should be warned especially against messages containing URLs that start
with http://, as few people notice this. Warnings for messages from un-
known senders should be given to older or less experienced Internet and IM
users, as unknown senders seem more trustworthy for that group.
29References
[1] Gabriel Bassett et al. Verizon 2020 Data Breach Investigation Report.
2020.
[2] APWG. Phishing Activity Trends Report 4th Quarter 2020. 2020.
[3] Alexander De Luca et al. “Expert and Non-expert Attitudes Towards
(Secure) Instant Messaging”. In: Twelfth Symposium on Usable Pri-
vacy and Security ({SOUPS} 2016). 2016, pp. 147–157.
[4] Rachna Dhamija, J Doug Tygar, and Marti Hearst. “Why Phishing
Works”. In: Proceedings of the SIGCHI Conference on Human Factors
in Computing Systems. 2006, pp. 581–590.
[5] Ahmed Abbasi et al. “The Phishing Funnel Model: A Design Artifact
to Predict User Susceptibility to Phishing Websites”. In: Information
Systems Research (2021).
[6] Devdatta Akhawe and Adrienne Porter Felt. “Alice In Warningland: A
Large-scale Field Study of Browser Security Warning Effectiveness”.
In: 22nd {USENIX} Security Symposium ({USENIX} Security 13).
2013, pp. 257–272.
[7] Min Wu, Robert C. Miller, and Simson L. Garfinkel. “Do Security
Toolbars Actually Prevent Phishing Attacks?” In: Proceedings of the
SIGCHI Conference on Human Factors in Computing Systems. 2006,
pp. 601–610.
[8] Ian Fette, Norman Sadeh, and Anthony Tomasic. “Learning To Detect
Phishing Emails”. In: Proceedings of the 16th International Conference
on World Wide Web. 2007, pp. 649–656.
[9] Phishing.org. What Is Phishing? url: https://www.phishing.org/
what-is-phishing/.
[10] Phishing.org. History Of Phishing. url: https : / / www . phishing .
org/history-of-phishing/.
[11] Consumentenbond. Belastingdienst waarschuwt voor phishing-berichten.
Mar. 2020. url: https://www.consumentenbond.nl/belastingaangifte/
belastingdienst-waarschuwt-voor-phishing-berichten/.
30[12] WhatsApp. WhatsApp. 2021. url: https://www.whatsapp.com/.
[13] Giancarlo Pellegrino et al. “Uses and Abuses of Server-side Requests”.
In: International Symposium on Research in Attacks, Intrusions, and
Defenses. Springer. 2016, pp. 393–414.
[14] Mysk. Link Previews: How a Simple Feature Can Have Privacy and
Security Risks. Oct. 2020. url: https://www.mysk.blog/2020/10/
25/link-previews/.
[15] Giada Stivala and Giancarlo Pellegrino. “Deceptive Previews: A Study
of the Link Preview Trustworthiness in Social Platforms”. In: 27th
Annual Network and Distributed System Security Symposium (Feb.
2020).
[16] Briony J. Oates. Researching Information Systems and Computing.
SAGE Publications, 2006. Chap. 7, p. 93. isbn: 1-4129-0223-1.
[17] David Dunning. “The Dunning-Kruger Effect: On Being Ignorant of
One’s Own Ignorance”. In: Advances in Experimental Social Psychol-
ogy. Vol. 44. Elsevier, 2011, pp. 247–296.
[18] Gordon Pennycook et al. “Dunning-Kruger Effects in Reasoning: The-
oretical Implications of the Failure to Recognize Incompetence”. In:
Psychonomic Bulletin & Review 24.6 (2017), pp. 1774–1784.
[19] Khalid Mahmood. “Do People Overestimate Their Information Liter-
acy Skills? A Systematic Review of Empirical Evidence on the Dunning-
Kruger Effect”. In: Communications in Information Literacy 10.2 (2016),
p. 3.
[20] Statistics Solutions. Pearson’s Correlation Coefficient. 2021. url: https:
//www.statisticssolutions.com/pearsons-correlation-coefficient/.
[21] Social Science Statistics. Quick P Value from Pearson (R) Score Cal-
culator. 2021. url: https://www.socscistatistics.com/pvalues/
pearsondistribution.aspx.
[22] Facebook. Facebook. 2021. url: https://www.facebook.com/.
[23] Briony J. Oates. Researching Information Systems and Computing.
SAGE Publications, 2006. Chap. 7, p. 104. isbn: 1-4129-0223-1.
[24] Briony J. Oates. Researching Information Systems and Computing.
SAGE Publications, 2006. Chap. 7, p. 105. isbn: 1-4129-0223-1.
[25] Patrick Schober, Christa Boer, and Lothar A. Schwarte. “Correlation
Coefficients: Appropriate Use and Interpretation”. In: Anesthesia &
Analgesia 126.5 (2018), pp. 1763–1768.
[26] Tanusree Sharma. Evolving Phishing Email Prevention Techniques: A
Survey to Pin Down Effective Phishing Study Design Concepts. 2021.
31You can also read