UCSF UC San Francisco Previously Published Works

Page created by Mary Hale
 
CONTINUE READING
UCSF UC San Francisco Previously Published Works
UCSF
UC San Francisco Previously Published Works

Title
Knee osteoarthritis and time-to all-cause mortality in six community-based cohorts: an
international meta-analysis of individual participant-level data.

Permalink
https://escholarship.org/uc/item/4x0982kn

Journal
Aging clinical and experimental research, 33(3)

ISSN
1594-0667

Authors
Leyland, Kirsten M
Gates, Lucy S
Sanchez-Santos, Maria T
et al.

Publication Date
2021-03-01

DOI
10.1007/s40520-020-01762-2

Peer reviewed

 eScholarship.org                                 Powered by the California Digital Library
                                                                  University of California
UCSF UC San Francisco Previously Published Works
Aging Clinical and Experimental Research (2021) 33:529–545
https://doi.org/10.1007/s40520-020-01762-2

 ORIGINAL ARTICLE

Knee osteoarthritis and time‑to all‑cause mortality in six
community‑based cohorts: an international meta‑analysis
of individual participant‑level data
Kirsten M. Leyland1,2 · Lucy S. Gates2,3 · Maria T. Sanchez‑Santos4 · Michael C. Nevitt5 · David Felson6 ·
Graeme Jones7 · Joanne M. Jordan8 · Andrew Judge2,9 · Dani Prieto‑Alhambra4 · Noriko Yoshimura10 ·
Julia L. Newton2 · Leigh F. Callahan8 · Cyrus Cooper2,11 · Mark E. Batt12 · Jianhao Lin13 · Qiang Liu13 ·
Rebecca J. Cleveland8 · Gary S. Collins4 · Nigel K. Arden2,11 · The PCCOA Steering Committee

Received: 2 November 2020 / Accepted: 21 November 2020 / Published online: 15 February 2021
© The Author(s) 2021

Abstract
Background Osteoarthritis (OA) is a chronic joint disease, with increasing global burden of disability and healthcare utilisa-
tion. Recent meta-analyses have shown a range of effects of OA on mortality, reflecting different OA definitions and study
methods. We seek to overcome limitations introduced when using aggregate results by gathering individual participant-level
data (IPD) from international observational studies and standardising methods to determine the association of knee OA with
mortality in the general population.
Methods Seven community-based cohorts were identified containing knee OA-related pain, radiographs, and time-to-mor-
tality, six of which were available for analysis. A two-stage IPD meta-analysis framework was applied: (1) Cox proportional
hazard models assessed time-to-mortality of participants with radiographic OA (ROA), OA-related pain (POA), and a com-
bination of pain and ROA (PROA) against pain and ROA-free participants; (2) hazard ratios (HR) were then pooled using
the Hartung–Knapp modification for random-effects meta-analysis.
Findings 10,723 participants in six cohorts from four countries were included in the analyses. Multivariable models (adjust-
ing for age, sex, race, BMI, smoking, alcohol consumption, cardiovascular disease, and diabetes) showed a pooled HR,
compared to pain and ROA-free participants, of 1.03 (0.83, 1.28) for ROA, 1.35 (1.12, 1.63) for POA, and 1.37 (1.22, 1.54)
for PROA.
Discussion Participants with POA or PROA had a 35–37% increased association with reduced time-to-mortality, independ-
ent of confounders. ROA showed no association with mortality, suggesting that OA-related knee pain may be driving the
association with time-to-mortality.
Funding Versus Arthritis Centre for Sport, Exercise and Osteoarthritis and Osteoarthritis Research Society International.

Keywords Osteoarthritis · Knee · Mortality · Meta-analysis

Introduction                                                              up 20% of this musculoskeletal burden. In terms of living
                                                                          with disability, musculoskeletal disorders ranked 10th and
The prevalence of musculoskeletal disorders (not including                11th for men and women, respectively [1]. The lifetime risk
back pain) was ranked 19th for men and 20th for women in                  of knee osteoarthritis is estimated to be 45% [2], and the
the 2017 Global Burden of Disease study. Knee OA made                     prevalence of knee OA is expected to rise in accordance with
                                                                          the increase in the ageing population and obesity epidemic
                                                                          in many parts of the world.
The members of The PCCOA Steering Committee are listed in
                                                                             OA is a common debilitating joint disease, frequently
“Acknowledgements” section.
                                                                          associated with joint pain, functional limitation, and
* Nigel K. Arden                                                          decreased quality of life [3]. It most commonly affects the
  nigel.arden@ndorms.ox.ac.uk                                             knees, hips, hands, facet joints, and feet [4], with knee and
Extended author information available on the last page of the article     hip OA causing the greatest burden to the population, as

                                                                                                                            13
                                                                                                                       Vol.:(0123456789)
530                                                                         Aging Clinical and Experimental Research (2021) 33:529–545

pain and stiffness in these large weight-bearing joints often    time-to-mortality was compared between groups. Pooled
lead to significant physical dysfunction such as knee muscle     estimates were produced using a two-stage individual par-
weakness and limited flexion [5].                                ticipant-level meta-analysis framework consisting of two
   Since 2008, ten studies and three meta-analyses have          discrete steps: (1) analysing the individual cohorts sepa-
reported the association between knee OA and mortality,          rately; and (2) applying traditional meta-analysis methods
with only a handful of studies before this time [6–9]. Var-      to produce a pooled effect size [21].
ied findings of both positive and negative associations have        A two-stage analysis can more easily handle cohort-spe-
made it difficult to draw conclusions regarding the effects of   cific characteristics such as heterogeneous populations, dif-
OA on mortality [8, 10–16].                                      ferent risk relationships (such as direction and shape), and
   This variation in findings reflects differences in popula-    the effect of confounders, and can more overtly handle both
tions studied (clinical or general), the diagnostic methods      sporadic and systematic missing data, unlike a one-stage
used to define OA, statistical methodology used, and the         analysis (i.e., pooling all data) [23]. A two-stage analysis
use or inclusion of important confounders in each study.         allows for consistently defining the primary risk factors,
Traditional meta-analyses are valuable and efficient in terms    outcome variables, adjusting for the same confounders, and
of time and resources required, but do have several limita-      using consistent statistical methods before producing a sin-
tions, which have been widely recognised [17–19] includ-         gle pooled effect size. Unlike a traditional meta-analysis, it
ing reliance by necessity on published data increasing the       also allows for the inclusion of previously unpublished data.
potential for publication bias as negative studies difficult
to publish. Aggregate data are often not available, poorly       Cohort and participant inclusion/exclusion criteria
reported, derived, and presented differently across studies
(for example, odds ratio versus relative risk), and most stud-   Due to the type of data required (detailed pain and radio-
ies vary in their definitions of exposures, confounders and      graphic data), and the desire to use cohorts, including those
outcomes [20].                                                   which had not been previously published on the OA/mortal-
   Individual patient-level (IPD) meta-analysis utilises orig-   ity relationship, we identified cohorts using two sources: (1)
inal raw data from cohorts and uses standardised statisti-       published literature of cohort studies on knee osteoarthritis
cal methods to analyse and produce pooled estimates [21].        and mortality; and (2) contacting principal investigators of
IPD meta-analysis, although time-consuming and resource          longitudinal osteoarthritis cohorts to see whether mortality
intensive, does not depend on previously published data,         data had been collected. We did not conduct a traditional
allows for a standardised definition of important variables      systematic review, and as evidenced by the three recent sys-
and can be analysed using the same statistical approach.         tematic reviews and meta-analyses, several of the cohorts we
Within the current study, key measures of OA and relevant        have included in our study would not have been identified
confounders are harmonised (based on expert consensus)           [7–9].
[22], and consistent methods of analyses are used between           The inclusion criteria for cohorts were: (1) OA-related
cohorts to provide a more generalizable estimate of the asso-    knee pain and knee radiographic data available at baseline
ciation between OA and premature mortality in the general        for both OA and non-OA subjects; (2) time-to-mortality
population.                                                      follow-up data for all participants; and (3) recruitment from
   This study seeks to overcome the limitations introduced       the community (i.e., not identified through clinics, hospi-
when using aggregated results by gathering and analysing         tals, or healthcare professionals). Exclusion criteria were: (1)
individual participant-level data from multiple interna-         cohorts where raw data could not be released for analysis;
tional observational osteoarthritis cohort studies to describe   and (2) data not available for both OA and non-OA subjects.
the association between knee osteoarthritis and time-to          Cohorts were not selected with regard to previously pub-
all-cause-mortality.                                             lished data on the relationship between OA and mortality.
                                                                    We identified 40 cohorts via the two previously described
                                                                 sources as potentially having knee osteoarthritis data from
Methods                                                          the general population. Eighteen were excluded due to being
                                                                 a non-observational cohort or non-community-based or a
Study design                                                     case–control study. Thirteen lacked the appropriate knee
                                                                 X-ray or pain data at baseline after more detailed investi-
This study was designed to assess the relationship between       gation, and two lacked available mortality or time-to-death
knee osteoarthritis and time-to all-cause-mortality in mul-      data. Seven potentially eligible cohorts were identified, one
tiple, prospective, longitudinal, community-based cohort         of which had data access limitations, leaving six cohort
studies from around the world. Subjects were stratified by       studies available for analysis (see flow chart, Appendix 1).
the presence or absence of osteoarthritis at baseline, and       The six cohorts included were: three US community-based

13
Aging Clinical and Experimental Research (2021) 33:529–545                                                                    531

cohorts (Framingham and Johnston County Osteoarthritis            was defined using the Kellgren and Lawrence (K/L) scor-
Project) [24, 25], one of which was enhanced for OA risk          ing method, grade 2, or above, and alternatively, an equiva-
factors [Multicentre Osteoarthritis Study (MOST)] [26]; one       lent combination of radiographic features (osteophytes and
community-based cohort from the United Kingdom (Ching-            joint space narrowing) from other validated scoring methods
ford) [27]; one Chinese community-based cohort (Wuchuan)          (such as the OARSI atlas) [32, 33].
[28]; and one Australian community-based cohort [The Tas-            Subjects were divided into four categories: (1) no knee
manian Older Adult Cohort (TasOAC)] [29]. All cohorts             pain or radiographic OA (Pain-/ROA-); (2) radiographic OA
provided data for all participants except Framingham which        with no pain (ROA); (3) knee pain with no radiographic OA
provided a random sample of 80%.                                  (POA); (4) pain and radiographic OA (PROA). Person-level
   Key differences between cohorts (Appendix 2) are the           OA was calculated by assessing the OA status for each joint
year of baseline visit, length of follow-up, the baseline age     and using the ‘highest’ level of OA based on this system. For
of participants, and the lack of side-specific pain in a single   example, if a subject had no knee pain or radiographic OA
cohort. Participants were included in the analysis if they        (cat 1) in their right knee and radiographic OA with no pain
were over 45 years of age, did not have evidence of rheuma-       (cat 2) in their left knee, their person-level knee OA status
toid arthritis, and had mortality data available. After initial   would be radiographic OA with no pain (cat 2).
data checks, subjects above the age of 80 were also excluded
due to the extremely small numbers available (Appendix 2).        Primary outcome: time‑to‑mortality

Data collection process                                           Each cohort contained a status variable (dead/alive) and
                                                                  a time-to-censoring variable for each participant. Three
IPD was requested from the principle investigators of any         cohorts (Chingford, Johnston County, TasOAC) determined
identified cohort after submitting an analysis plan for their     the date of death using nationally linked records, while the
team to review. Principle investigators were also contacted       remaining cohorts used other methods to determine the
directly in cases where data had never been previously            date of death such as updates from Primary Care systems,
released to outside research teams.                               death registries or municipal administration, family, medical
   A subset of the full data containing only the pre-specified    records, and periodic examinations or contacts.
exposures, outcomes, and confounders was requested, trans-           In cohorts where subjects were lost to follow-up at an
ferred via encrypted online servers, and stored and managed       unknown date, the previous visit when subjects had data
centrally by the Oxford research team. A open email dia-          was used as the last date where mortality status was known.
logue was maintained with principle investigators and key         Time-to-status was calculated from the baseline visit, deter-
researchers from each cohort throughout the process of data       mined by when knee X-rays and pain were assessed, to the
acquisition, harmonisation, and analysis to ensure consist-       last date that the subject’s status was known. Survival was
ency between cohorts.                                             calculated using person-years attributing to the analysis.

Primary risk factor: knee osteoarthritis                          Potential confounders

Due to the importance of using a consistent definition of         The potential confounders accounted for in this analysis
osteoarthritis to avoid misclassification, we gained expert       were: age; sex; race; BMI; smoking; drinking; cardiovas-
opinion on methods to harmonise knee osteoarthritis vari-         cular disease (CVD); and diabetes. These were based on
ables in prospective OA cohort studies, and all OA criteria       clinical applicability and consistent availability across each
used in this analysis were defined following a process of         cohort. To be modelled consistently between cohorts, vari-
expert consultation, analysis, and agreement [22]. The key        ables were categorised into the broadest level of informa-
output of this meeting supported the use of both a binary         tion available in any single cohort. For example, one cohort
self-reported pain question and the presence of radiographic      contained detailed data on the lifetime use of all tobacco
OA to define knee OA in the general population. Thus, knee        products enabling the generation of a ‘dose’, while another
pain was defined using either an NHANES-type question             cohort simply asked whether they were current, former, or
(i.e., ‘have you had pain for at least a month in the last        never smokers. This second option was then generated for
month in your joint’), or a similar alternative pain question     each cohort. Pain medication, such as NSAIDs, was not con-
if an NHANES-type question had not been used to assess            sidered a potential confounder in this analysis, as it is on the
pain [30, 31]. In cases where only WOMAC was available            causal pathway between painful OA and mortality, and a
a threshold of 3 was used on the WOMAC pain subscale,             mediation analysis on this scale would not have been feasible
this threshold was determined by the previous expert con-         due to both limitations in the data and in the methodology.
sensus and external validity study [22]. Radiographic OA

                                                                                                                       13
532                                                                         Aging Clinical and Experimental Research (2021) 33:529–545

   Age was defined as age at the time of baseline clinic visit    Participants with missing mortality data were excluded
when OA variables were assessed. Race was included as a           from all analysis (cohorts had no more than three percent
potential confounder for any cohort which had more than one       missing mortality data). The Nelsen–Aalen estimator was
race category. Chingford, TasOAC, and Framingham have             used to approximate the baseline hazards in the imputa-
predominantly Caucasian participants; Johnston County and         tion models [36]. Variables used for the imputation models
MOST have both Caucasian and African American subjects;           were congruent with the analysis model described in the
and Wuchuan has predominantly Chinese subjects. BMI was           next section. Missing PROA and race were modelled using
calculated for each cohort using height and weight variables      multinomial logistic regression; BMI by linear regression;
(weight/height in metres [2]). Extreme values were identified     sex, smoking, alcohol, CVD, and diabetes by logistic
in several cohorts; however, due to the wide variety of sub-      regression. Age was modelled by predictive mean match-
jects found in our dataset, we only excluded impossible (i.e.     ing due to non-normality from being restricted between
outside any known values) rather than improbable values.          ages 45 and 80 [37].
Smoking, Alcohol, Diabetes, and CVD were all generated
as binary variables. Smoking was calculated with current/
former smokers and never smokers. Alcohol was grouped by          Statistical methods: survival analysis
more than one drink per week versus none or one drink per
week. Diabetes was based on the presence of self-reported         Cox proportional hazard regression models were used to
clinically diagnosed diabetes, and CVD was calculated using       estimate hazard ratios (HRs) and 95% confidence intervals
self-reported responses to previous ischaemic heart disease,      (95% CIs) between three OA categories (POA, ROA, PROA)
and general heart problems.                                       and the time-to all-cause-mortality using no pain/no ROA as
                                                                  the comparator group for each analysis. Three models were
Statistical methods: descriptive statistics                       run: (1) univariable models assessed OA alone; (2) adjusted
                                                                  for age, sex and race; (3) adjusted for age, sex, race, BMI,
Descriptive statistics [percentages, means (standard devia-       smoking, alcohol, CVD, and diabetes. Models run in the
tions), and medians (inter-quartile ranges)] were calculated      Johnston County cohort also included a variable for recruit-
for baseline characteristics of all cohorts using all available   ment wave. Several cohorts were systematically missing
data. The difference between baseline characteristics in sub-     key potential confounders (primarily smoking and alcohol)
jects with and without complete data (OA and confounders)         (Appendix 2).
was calculated using t tests (or Wilcoxon–Mann–Whitney)              To satisfy the assumptions of the Cox proportional hazard
for continuous variables and Chi-square tests (or Fisher’s        model linearity was assessed between continuous variables
exact) for binary and categorical variables. Descriptive sta-     (age and BMI) and time to death using fractional polynomi-
tistics for baseline characteristics and time-to-mortality data   als and kernel. The proportional hazard assumption of the
were stratified by the categories, no pain/no ROA, POA,           primary risk factor (OA) was tested using Schoenfeld residu-
ROA and PROA.                                                     als. Due to the violation of this proportionality assumption,
                                                                  Johnston County was truncated to the 13-year follow-up post
Statistical methods: missing data                                 hoc, which was the maximum follow-up time of one of the
                                                                  recruitment waves. This corrected the violation of propor-
There were three potential types of missing data to consider      tionality for the PROA variable, although reduced the power
within our analyses. To identify data that was missing at         of this cohort. A priori interactions of OA and age, and OA
random (MAR) and missing completely at random (MCAR),             and BMI were tested in all cohorts.
we tested patterns and predictors of missingness for all expo-
sures and potential confounders. We identified several MAR
variables and ensured to include any required predictors in       Statistical methods: individual participant data
the imputation model. All other variables were assumed to         analysis
be MCAR, a non-testable assumption. There were also sys-
tematically missing variables, which were missing in their        Individual participant-level meta-analysis methods were
entirety in a single cohort. Appendix 2 shows the systemati-      utilised, using a two-staged approach [21, 38]. In the first
cally missing and MAR/MCAR variables for each cohort.             stage, hazard ratios (HR) and 95% confidence intervals (CI)
   Multiple imputation with chained equations (MICE)              were first produced for each individual cohort. Data were
was used to impute any missing data for both the primary          pooled in the second stage using random-effects analysis,
risk factor and for confounders [34, 35]. Systematically          using the Hartung–Knapp estimation to account for uncer-
missing variables (i.e., variables which were missing in          tainty around the tau statistic [39, 40].
their entirety) were excluded from all models and analyses.

13
Aging Clinical and Experimental Research (2021) 33:529–545                                                                      533

   The Stata admetan command was used to produce the                  Results
pooled estimates in addition to forest plots which graphically
demonstrate the results [41]. All analyses were conducted             10,723 participants in six cohorts from four countries were
using Stata version 13·0 statistical software (StataCorp, Col-        included in the analyses. All cohorts had less than 3% miss-
lege Station, Texas, USA).                                            ing mortality data and less than 12% missing risk factor or
                                                                      confounder data. Participants with missing mortality data
Role of funding source                                                were excluded, whilst those missing risk and confounder
                                                                      data were included in imputed analyses. In several cohorts,
Versus Arthritis UK (formally Arthritis Research) had no              there was a statistically significant difference in OA, age,
role in study design, data collection, data analysis, data inter-     BMI, diabetes, and CVD in subjects with and without miss-
pretation, or writing of the report. Members of the PCCOA             ing data (Appendix 3).
steering committee from Osteoarthritis Research Society                  Table 1 shows the baseline demographics for all cohorts
International (a non-profit scientific organisation) had roles        stratified by baseline OA. Median follow-up for this analy-
in study development and interpretation as outlined in the            sis ranged from 5·6 to 20·0 years after baseline. There was
author contribution section with all contributors named in            substantial variability in the baseline age (54.3–62.7 years),
the writing group. The corresponding author had full access           BMI (22.5–30.7 kg/m2), prevalence of PROA (6.7–33.3%),
to all the data in the study and had final responsibility for the     and the duration of follow-up in each cohort, such that the
decision to submit for publication (Fig. 1).                          percentage of subjects that died in each cohort ranged from
                                                                      2.9 to 22.3% (Table 2).
                                                                         The univariable meta-analysis (Fig. 2) shows a non-
                                                                      significant pooled hazard ratio (HR and 95% confidence

Fig. 1  a–c Forest plots of univariable models: a ROA; b POA; c PROA compared to Pain-/ROA-

                                                                                                                         13
Table 1  Cohort (1–3) baseline demographics for all subjects and stratified by baseline knee OA status
                                                                                                                                                                                                                  534

     Baseline    Chingford                                                      Johnston County                                                  Framingham
     demo-

13
     graphics    None        ROA         POA          PROA         All          None         ROA          POA          PROA         All          None         ROA          POA          PROA         All

     N          588        75 (7.8%)     232        64 (6.7%)        992 1707        378        1023       654            3918 594          63 (7.1%) 181         48 (5.4%)      905
                   (61.3%)                (24.2%)                          (45.4%)    (10.1%)    (27.2%)    (17.4%)               (67.0%)               (20.4%)
     Age        53.8 (5.9) 57.2 (5.8)    53.9 (5.9) 57.1 (5.4) 54.3 (6.0) 58.3 (9.1) 62.8 (9.4) 58.8 (9.1) 63.5 (9.3) 60.0 (9.5) 55.6 (7.5) 57.1 (7.5) 56.0 (7.7) 59.8 (7.2) 56.0 (7.6)
     Sex        588        75            232        64         992        1018       228        662        440        2457       297        30         108        26         474
       (female)    (100%)     (100%)      (100%)     (100%)     (100%)     (59.6%)    (60.3%)    (64.7%)    (67.3%)    (62.7%)    (50.0%)    (47.6%)    (59.7%)    (54.2%)    (52.5%)
     Race
      Cauca- ..            ..            ..           ..           ..           1168     251      648      399      2568     594                              63           181          48           905 (100%)
         sian                                                                    (68.4%)  (66.4%)  (63.3%)  (61.0%)  (65.5%)    (100%)                           (100%)       (100%)       (100%)
      African ..           ..            ..           ..           ..           539      127      375      255      1352     ..                               ..           ..           ..           ..
         Amer-                                                                   (31.6%)  (33.6%)  (36.7%)  (39.0%)  (34.5%)
         ican
      Chinese ..           ..            ..           ..           ..           ..           ..           ..           ..           ..           ..           ..           ..           ..           ..
      Other     ..         ..            ..           ..           ..           ..           ..           ..           ..           ..           ..           ..           ..           ..           ..
     BMI        24.9 (3.9) 27.3 (4.8)    25.9 (4.3)   28.8 (5.2)   25.6 (4.3)   27.9 (5.0)   30.2 (6.7)   30.0 (6.1)   33.6 (8.0)   29.7 (6.4)   26.7 (4.2)   28.6 (5.5)   27.9 (4.9)   30.6 (5.9)   27.3 (4.6)
     Alcohol    237        21            81           21           375          ..           ..           ..           ..           ..           417          43           116          36           623
       (one or     (40.3%)    (28.0%)       (34.9%)      (32.8%)      (37.8%)                                                                       (70.4%)      (68.3%)      (64.1%)      (75.0%)      (69.1%)
       more)
     Smoking 267           39            107      29       458      870      162      566      287      1933     388      35       121      24       580
       (ex/cur-    (45.4%)    (52.0%)     (46.1%)  (45.3%)  (46.2%)  (52.0%)  (43.3%)  (56.8%)  (44.7%)  (50.9%)  (65.4%)  (55.6%)  (66.9%)  (50.0%)  (64.2%)
       rent)
     CVD        19 (3.2%) 3 (4.1%)       6 (2.6%)     2 (3.1%) 31 (3.1%) 413                 90           356        198            1098       19 (3.3%) 0 (0.0%)          10 (5.5%) 1 (2.1%)        30 (3.4%)
       (yes)                                                               (24.2%)            (23.8%)      (34.8%)    (30.3%)        (28.0%)
     Diabetes 5 (0.9%) 0 (0.0%)          4 (1.7%) 0 (0.0%) 9 (0.9%) 162                      45           152        128            509        21 (3.6%) 1 (1.6%)          13 (7.2%) 4 (8.5%)        40 (4.4%)
       (yes)                                                               (9.5%)             (11.9%)      (14.9%)    (19.6%)        (13.0%)
     N          827        503           608        968             2936 206                 372          83 (9.4%) 219                   955 469         42 (4.1%)        398        107           1017
                   (28.5%)    (17.3%)      (20.9%)   (33.3%)               (23.4%)            (42.3%)                 (24.9%)                   (46.2%)                     (39.2%)    (10.5%)
     Age        61.2 (8.0) 64.5 (8.0)    60.4 (8.0) 63.7 (7.9) 62.5 (8.1) 62.0 (7.3)         63.2 (7.5)   60.5 (6.3) 63.3 (7.4)     62.7 (7.4) 55.8 (7.3) 62.2 (8.9)       55.1 (7.1) 61.4 (8.5) 56.4 (7.7)
     Sex        448        289           390        632        1775       96                 189          34         119            477        203        26               212        74         516
       (female)    (54.2%)    (57.5%)      (64.1%)   (65.3%)    (60.5%)    (46.6%)            (50.8%)      (41.0%)    (54.3%)        (50.0%)    (43.3%)    (61.9%)          (53.3%)    (69.2%)    (50.7%)
     Race
      Cauca- 734           436           498      781      2470     ..                       ..           ..           ..           ..           ..           ..           ..           ..           ..
         sian      (88.8%)    (86.7%)     (81.9%)  (80.1%)  (84.1%)
      African 82 (9.9%) 61               96       179      426      ..                       ..           ..           ..           ..           ..           ..           ..           ..           ..
         Amer-                (12.1%)     (15.8%)  (18.5%)  (14.5%)
         ican
      Chinese ..           ..            ..           ..           ..           ..           ..           ..           ..           ..           469          42           398          107          1017
                                                                                                                                                  (100%)       (100%)       (100%)       (100%)       (100%)
                                                                                                                                                                                                                  Aging Clinical and Experimental Research (2021) 33:529–545
Aging Clinical and Experimental Research (2021) 33:529–545                                                                                                                                                                                                                                                                                                                                                                                                                                                       535

                                                                                                                                                                                                                                                                                                                                                                                                                                                      interval) of 1.41 (0.98, 2.01) for ROA. Both POA and PROA

                                                                                                                                                                                                                                                                                                                                                                        2 (0.5%) 1 (0.9%) 5 (0.45%)
                                                29.0 (4.6) 30.6 (5.4) 29.5 (5.4) 32.8 (6.8) 30.7 (5.9) 26.9 (4.3) 27.3 (4.3) 28.1 (4.8) 29.5 (5.5) 27.8 (4.7) 21.9 (3.1) 23.3 (3.4) 22.6 (3.1) 24.0 (4.0) 22.5 (3.3)

                                                                                                                                                                                                                                                                                                                                                                                            (11.8%)
                                                                                                                                                                                                                                                                                                                                                                                                                                                      were significantly associated with reduced time-to-mortality
                                                                                                                                                                                                                                                                                                                                                                                                                                                      (1.42 [1.13, 1.79], and 1.94 [1.58, 2.39], respectively) when

                                                                                                                                                                                                                                                                                                                                                                                           120
                                         All
                                                                                                                                                                                                                                                                                                                                                                                                                                                      compared with participants with no pain or ROA. In the

                                                                                                                                                                                                                                                                         ..
                                                                                                                                                                                                                       ..
                                                                                                                                                                                                          ..                                                                                                                                                                                                                                          model adjusted for age, sex, and race only, the effect size

                                                                                                                                                                                                                                                                                                                                                                                   (17.8%)
                                                                                                                                                                                                                                                                                                                                                                                                                                                      was attenuated and remained non-significant for ROA (1.0
                                         PROA

                                                                                                                                                                                                                                                                                                                                                                                                                                                      [0.70, 1.44]); increased slightly and remained significant for

                                                                                                                                                                                                                                                                                                                                                                                  19
                                                                                                                                                                                                                                                                         ..
                                                                                                                                                                                                                       ..
                                                                                                                                                                                               ..

                                                                                                                                                                                                                                                                                                                                                                                                                                                      POA (1·44 [1.11, 1.85]); and was attenuated for PROA (1.36

                                                                                                                                                                                                                                                                                                                                                                          (12.8%)
                                                                                                                                                                                                                                                                                                                                                                                                                                                      [1.18, 1.56]) compared with the univariable models.
                                         POA

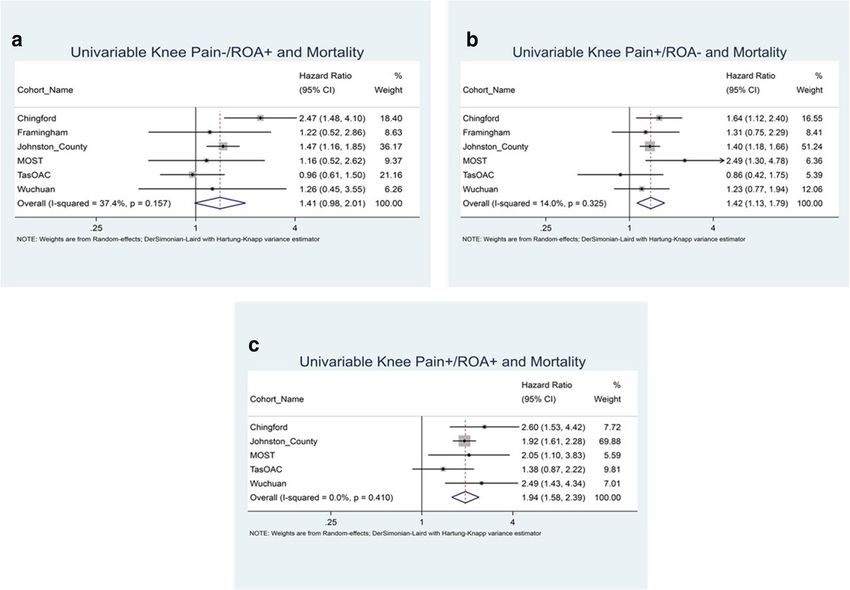
                                                                                                                                                                                                                                                                                                                                                                                                                                                         In the fully adjusted model (age, sex, race, BMI, smoking,

                                                                                                                                                                                                                                                                                                                                                                        51
                                                                                                                                                                                                                                                                         ..
                                                                                                                                                                                                                       ..
                                                                                                                                                                                    ..

                                                                                                                                                                                                                                                                                                                                                                                                                                                      alcohol consumption, CVD, and diabetes), ROA remained
                                                                                                                                                                                                                                                                                                                                                                                                                                                      non-significant, and participants with POA or PROA had

                                                                                                                                                                                                                                                                                                                                                                                            2 (0.4%) 0 (0.0%)
                                                                                                                                                                                                                                                                                                                                                                                                      2 (4.8%)
                                         ROA

                                                                                                                                                                                                                                                                                                                                                                                                                                                      a 35% (HR 1·35 [1.13, 1.63]) and 37% (HR 1·37 [1.22,
                                                                                                                                                                                                                                                                                                                                                                                                                                                      1.54]) increased association with reduced time-to-mortality,
                                                                                                                                                                                                                                                                         ..
                                                                                                                                                                                                                       ..
                                                                                                                                                                         ..
                       Framingham

                                                                                                                                                                                                                                                                                                                                                                                                                                                      respectively (Fig. 2).
                                                                                                                                                                                                                                                                                                                                                                                              (10.0%)
                                         None

                                                                                                                                                                                                                                                                                                                                                                        18 (8.5%) 74 (8.1%) 47
                                                                                                                                                                                                                                                                                                                                                                   ..
                                                                                                                                                                                                                                                                    ..
                                                                                                                                                              ..

                                                                                                                                                                                                                                                                                                                                                                                                                                                      Discussion
                                                                                                                                                                                                                                                                                                                                                                                   (5.59%)
                                                                                                                                                                                                                                                                                                                                                           (50.5%)
                                                                                                                                                                                                                                                            (49.8%)

                                                                                                                                                                                                                                                                                                                                                          480
                                                                                                                                                                                                                                                           476

                                                                                                                                                                                                                                                                                                                                                                                                                                                      Key results
                                         All

                                                                                                                                                                                                                                                                                                                                                                        15 (7.1%) 54
                                                                                                                                                   ..

                                                                                                                                                                                                                                                                                                                                                  (49.8%)
                                                                                                                                                                                                                                                   (46.1%)

                                                                                                                                                                                                                                                                                                                                                                                                                                                      This individual participant-level meta-analysis of over
                                         PROA

                                                                                                                                                                                                                                                                                                                                                                                                                                                      100,000 people from four countries revealed that partici-
                                                                                                                                                                                                                                                                                                                                                 109
                                                                                                                                                                                                                                                  101
                                                                                                                                        ..

                                                                                                                                                                                                                                                                                                                                                                                                                                                      pants with knee pain only, or a combination of knee pain and
                                                                                                                                                                                                                                                                                                                                         (61.5%)
                                                                                                                                                                                                                                          (53.0%)

                                                                                                                                                                                                                                                                                                                                                                                                                                                      radiographic OA, had an increased association with reduced
                                                                                                                                                                                                                                                                                                                                                                                                                       13 (6.6%) 15 (4.2%) 6 (7.5%)
                                                                                                                                                                                                                                                                                                                                                                                                                       14 (7.1%) 30 (8.5%) 5 (6.3%)

                                                                                                                                                                                                                                                                                                                                                                                                                                                      time-to-mortality, independent of age, sex, and race (HRs
                                         POA

                                                                                                                                                                                                                                                                                                                                        51
                                                                                                                                                                                                                                         44

                                                                                                                                                                                                                                                                                                                                                                                                                                                      of 1.36–1.44). To explore whether the association could be
                                                                                                                             ..

                                                                                                                                                                                                                                                                                                                                                                                                                                                      explained by co-morbid conditions, the models were further
                                                                                                                                                                                                                                                                                                                                (49.9%)
                                                                                                                                                                                                                                 (50.8%)

                                                                                                                                                                                                                                                                                                                                                                                                                                                      adjusted for BMI, smoking, alcohol, CVD, and diabetes. The
                                         ROA
                       Johnston County

                                                                                                                                                                                                                                                                                                                               185
                                                                                                                                                                                                                                189

                                                                                                                                                                                                                                                                                                                                                                                                                                                      results remained consistent with HRs of 1.35 for those with
                                                                                                                  ..

                                                                                                                                                                                                                                                                                                                                                                                                                                                      POA and 1.37 for those with PROA, compared to partici-
                                                                                                                                                                                                                                                                                                                       (50.5%)
                                                                                                                                                                                                                        (52.9%)

                                                                                                                                                                                                                                                                                                                                                                                                                                                      pants without knee pain and ROA (pain-/ROA-). Interest-
                                         None

                                                                                                                                                                                                                                                                                                                                                                                                                                                      ingly, we did not observe an association with time-to-mortal-
                                                                                                                                                                                                                                                                                                                      104
                                                                                                                                                                                                                       109
                                                11 (1.3%) 6 (1.2%) 14 (2.3%) 8 (0.8%) 40 (1.3%) ..

                                                                                                                                                                                                                                                                                                                                                                                                                                                      ity in participants with radiographic changes alone (ROA),
                                                                                                                                                                                                                                                                                                                                                                                                               (10.7%)
                                                                                                                                                                                                                                                                                                                                                                                                               (11.9%)
                                                                                                                                                                                                                                                                                                              (44.5%)

                                                                                                                                                                                                                                                                                                                                                                                                                                                      suggesting that it is pain or some functional consequence of
                                                                                                                                                                                                                                                                                                                                                                                                                                                      pain such as walking disability or reduced physical activity,
                                                                                                                                                                                                                                                                                                             1305

                                                                                                                                                                                                                                                                                                                                                                                                              307
                                                                                                                                                                                                                                                                                                                                                                                                              339
                                         All

                                                                                                                                                                                                                                                                                                                                                                                                                                                      rather than the structural aspect of knee OA, that may be
                                                                                                                                                                                                                       ..

                                                                                                                                                                                                                                                                                                                                                                                                                                                      driving the increased association with premature mortal-
                                                                                                                                                                                                                                                                                                                                                                                                      (14.4%)
                                                                                                                                                                                                                                                                                                                                                                                                      (13.8%)
                                                                                                                                                                                                                                                                                                     (45.3%)
                                         PROA

                                                                                                                                                                                                                                                                                                                                                                                                                                                      ity [42, 43]. While many studies have found an association
                                                                                                                                                                                                                                                                                                                                                                                                     134
                                                                                                                                                                                                                                                                                                                                                                                                     129
                                                                                                                                                                                                                                                                                                    438

                                                                                                                                                                                                                                                                                                                                                                                                                                                      between OA-related pain and premature mortality, the poten-
                                                                                                                                                                                                                       ..

                                                                                                                                                                                                                                                                                                                                                                                                                                                      tial pathways that explain this association is still unclear. A
                                                                                                                                                                                                                                                                                                                                                                                             (11.4%)
                                                                                                                                                                                                                                                                                                                                                                                             (11.5%)
                                                                                                                                                                                                                                                                                            (42.9%)

                                                                                                                                                                                                                                                                                                                                                                                                                                                      study using large population-based data sets to investigate
                                         POA

                                                                                                                                                                                                                                                                                           261

                                                                                                                                                                                                                                                                                                                                                                                                                                                      the effect of pain phenotype on the association between pain
                                                                                                                                                                                                                                                                                                                                                                        59 (7.3%) 43 (8.6%) 68
                                                                                                                                                                                                                                                                                                                                                                                            68
                                                                                                                                                                                                                       ..

                                                                                                                                                                                                                                                                                                                                                                                                                                                      and mortality found that the impact of pain in daily life was
                                                                                                                                                                                                                                                                                                                                                                                   (12.6%)
                                                                                                                                                                                                                                                                                   (42.4%)

                                                                                                                                                                                                                                                                                                                                                                                                                                                      more important than the presence or extent of pain in the
                                         ROA

                                                                                                                                                                                                                                                                                                                                                                                                                                                      relationship between pain and mortality [44]. Findings from
                                                                                                                                                                                                                                                                                  213

                                                                                                                                                                                                                                                                                                                                                                        76 (9.4%) 62
                                                                                                                                                                                                                       ..

                                                                                                                                                                                                                                                                                                                                                                                                                                                      one of the same cohorts examining the potential mechanisms
                       Chingford

                                                                                                                                                                                                                                                                          (46.0%)

                                                                                                                                                                                                                                                                                                                                                                                                                                                      between OA and all-cause mortality highlighted frequent
Table 1  (continued)

                                                                                                                                                                                                                                                                                                                                                                                                                                                      walking as a potential target to reduce all-cause mortality.
                                         None

                                                                                                                                                                                                                                                                         380

                                                                                                                                                                                                                                                                                                                                                                                                                                                      While anxiety, depression, and unrefreshed sleep had statis-
                                                                                                                                                                                                                       ..

                                                                                                                                                                                                                                                                                                                                                                                                                                                      tically significant effects, the extent of their mediation effect
                                                                                                                                                                                                                        (ex/cur-
                                                                                                                                                                                                                       Smoking
                                                                                                                                                                                                                        (one or

                                                                                                                                                                                                                       Diabetes
                       Baseline

                       graphics

                                                                                                                                                                                                                       Alcohol

                                                                                                                                                                                                                        more)
                                                 Other

                                                                                                                                                                                                                                                                                                                                                                                                                                                      had low clinical significance [45].
                                                                                                                                                                                                                        (yes)
                                                                                                                                                                                                                        (yes)
                                                                                                                                                                                                                        rent)
                       demo-

                                                                                                                                                                                                                       CVD
                                                BMI

                                                                                                                                                                                                                                                                                                                                                                                                                                                                                                           13
536                                                                             Aging Clinical and Experimental Research (2021) 33:529–545

Table 2  Mortality information    Mortality information     Osteoarthritis
by baseline knee osteoarthritis
status                                                      None                ROA                  POA                 PROA

                                  Chingford
                                   Total N                  588                 75                   232                 64
                                   No of deaths             67                  19                   42                  17
                                   Median follow-up         20.0 (20.0, 20.0)   20.0 (19.4, 20.0)    20.0 (20.0, 20.0)   20.0 (18.6, 20.0)
                                   Median time-to-death     14.2 (8.4, 17.1)    13.5 (8.0, 16.2)     14.1 (10.6, 17.9)   12.1 (6.7, 16.2)
                                  Johnston County
                                   Total N                  1707                378                  1023                654
                                   No of deaths             300                 96                   250                 208
                                   Median follow-up         12.5 (9.4, 13.0)    12.0 (7.5, 13.0)     11.5 (9.3, 13.0)    10.8 (8.3, 13.0)
                                   Median time-to-death     7.3 (4.2, 10.6)     7.4 (4.3, 10.6)      7.1 (4.3, 9.9)      6.7 (3.7, 9.8)
                                  Framingham
                                   Total N                  594                 63                   181                 48
                                   No of deaths             44                  6                    17                  1
                                   Median follow-up         11.8 (10.8, 12.5)   12.3 (11.53, 12.7)   11.6 (10.8, 12.5)   12.2 (11.8, 12.7)
                                   Median time-to-death     8.3 (4.9, 10.7)     6.0 (3.7, 8.3)       9.0 (7.2, 10.6)     13.2 (13.2, 13.2)
                                  MOST
                                   Total N                  827                 503                  608                 968
                                   No of deaths             14                  10                   26                  34
                                   Median follow-up         5.6 (5.5. 5.8)      5.6 (5.5. 5.8)       5.6 (5.5. 5.8)      5.6 (5.5. 5.8)
                                   Median time-to-death     2.7 (1.9, 4.8)      4.8 (4.2, 5.3)       4.0 (2.7, 4.9)      3.2 (1.8, 5.0)
                                  TasOAC
                                   Total N                  206                 372                  83                  219
                                   No of deaths             31                  53                   10                  39
                                   Median follow-up         12.0 (8.8, 13.1)    11.9 (8.2, 12.9)     11.6 (9.7, 13.0)    10.4 (5.0, 12.6)
                                   Median time-to-death     9.1 (6.4, 10.9)     7.9 (6.1, 10.5)      9.8 (6.4, 10.8)     6.4 (3.7, 9.5)
                                  Wuchuan
                                   Total N                  469                 42                   698                 107
                                   No of deaths             36                  4                    37                  19
                                   Median follow-up         8.3 (8.3, 8.3)      8.3 (8.3, 8.3)       8.3 (8.3, 8.3)      8.3 (8.3, 8.3)
                                     Median time-to-death   5.9 (4.0, 7.5)      5.4 (3.3, 6.4)       5.7 (3.8, 6.8)      4.8 (3.9, 5.9)

Results in the context of other studies                              risk of all-cause mortality in participants with knee pain
                                                                     alone (HR of 1.19 [1.04–1.35]) and those with symptomatic
Three recent meta-analyses found no association between              knee OA (HR of 1.17 [1.03–1.34]) [46]. Castano Betancourt
OA and mortality, with pooled effect sizes of 0.91 (0.68,            et al. and Neusch et al. combined hip and knee pain/ROA,
1.23), 1.06 (0.88, 1.28), and 1.21 (0.82, 1.78) in a knee only       and both found a significant association with premature
analysis [7–9]. All three articles combined results of studies       mortality (1.23 and 1.55, respectively) [11, 47], supporting
which used multiple forms of OA diagnosis, including clini-          the concept that the association of knee OA with reduced
cian diagnosed OA, self-reported clinical diagnosis, pain,           time-to-mortality may be driven by pain rather than by struc-
and radiographic OA, increasing the measurement error                tural changes identified by radiographs. In this analysis, we
of the OA variable. Two of the meta-analyses combined                treated a number of comorbidities as potential confound-
studies with knee, hip, and hand data into a single effect           ers; however, the relationship between these comorbidities
size [7, 9]. Individual studies, which assessed knee pain            and OA is poorly understood and may ultimately be part
and radiographic OA with mortality, tend to report higher            of the causal pathway; therefore, the associations we found
effect sizes more consistent without our results. For instance,      here may not represent a causal association between OA and
Liu et al. [15] reported a borderline significant HR of 1.90         mortality. We could be underestimating this association if
(1.00, 3.50), while Tsuboi et al. [12] reported a significant        some of the potential confounders are actually mediators
HR of 2.32 (1.41, 3.80), as did Kluzek et al. [14], HR of            on the causal pathway, and we may be overestimating the
1·47 (1.08, 2.01). Cleveland et al. observed an increased

13
Aging Clinical and Experimental Research (2021) 33:529–545                                                                    537

Fig. 2  a–c Forest plots of fully adjusted models: a ROA; b POA; c PROA compared to Pain-/ROA-

association depending on how well our adjusted models are             confounders such as physical activity and occupation. An
accounting for confounding.                                           additional potential source of unmeasured confounding
   Patients with OA have on average 2·6 moderate-to-                  is the pain sensitization, which may effect the relation of
severe co-morbidities [48] and 31% of patients have five              painful knee OA and mortality, and should be pursued in
or more other chronic conditions [49]. Our fully adjusted             future research. The current study focuses on the knee;
models, which included lifestyle factors and cardiovascu-             however, it is known that limitations in activities of daily
lar conditions, did not change substantially from the mod-            living and mobility vary according to hip or knee site
els adjusted for age, sex, and race. This may indicate that           [50]; previous studies have also found an increased risk
the additional potential confounders we have adjusted for             of mortality in individuals with hip symptoms [51].
do not have a substantial confounding effect on the asso-
ciation between OA and reduced time-to-mortality. This                Strengths and limitations
suggests that either the association is driven by OA or is
due to residual confounding caused by measurement error               A limitation of this study is that the included cohorts were
in self-reported variables and/or by the lack of potential            designed as independent studies and were not originally

                                                                                                                       13
538                                                                          Aging Clinical and Experimental Research (2021) 33:529–545

designed to be directly compared to one another. Therefore,       harmonised using the least detailed information available
osteoarthritis was assessed differently between cohorts. It is    in any single cohort at the baseline visit only, which likely
known that even small variations in the way a pain question       increased our risk of residual confounding in our models.
is worded, or X-rays are graded, can result in differences        However, by harmonising the individual confounders and
in OA prevalence [22, 52]. To minimise this variation, we         adjusting for them consistently between studies, we have
made every effort to harmonise pain and ROA variables             reduced unnecessary heterogeneity between studies. There-
between cohorts by conducting an international expert con-        fore, remaining differences between cohorts are more likely
sensus study [22].                                                to reflect racial, country, and/or cultural variations rather
   One of the strengths of our study, unlike traditional meta-    than how variables were defined, or which statistical models
analyses, is that we actively sought cohorts that had not         were used.
previously published on the association between OA and                Previous individual cohort or meta-analysis studies have
mortality, to avoid publication bias. To also capture people      suggested that a large proportion of the increased risk of mor-
without the symptomatic aspects of OA, we restricted our          tality is due to cardiovascular mortality [9, 14]. Cause-specific
studies to those that included the general population and         mortality was not available in the majority of our cohorts and
one enhanced risk factor cohort. These people would not           justifies further investigation. Likewise, medical detail was
be included in clinical OA cohorts, which is a known issue        not available across all cohorts to consider the effect of pain-
in the accurate reporting of the true burden of OA [53, 54].      relieving medications. Pain medication is on the casual path-
   The MOST cohort included additional focussed recruit-          way between painful OA and mortality, and by not including it
ment to include a larger proportion of participants that were     in our model, our associations are ultimately combining both
older, female, overweight, or had knee surgery/injury, all        the direct effect of OA on mortality and the indirect effect of
factors associated with an increased risk of OA. Therefore,       OA through pain medication on mortality. Future research
the reference group (without pain or ROA) is likely to have       using mediation analysis will help to clarify this pathway.
a higher prevalence of OA risk factors than the pain and              IPD meta-analyses are time-consuming and resource
ROA-free group in other cohorts, which may have biased            intensive compared with traditional meta-analyses; however,
our results toward the null in this cohort.                       they allow for standardising exposures, outcomes, and statis-
   The follow-up of the included studies ranged from 5.6 to       tical methods, and, more importantly, avoid publication bias
20.0 years; however, only baseline knee OA and confound-          by not being limited to the inclusion of previously published
ers were included in the analysis, meaning that participants      studies, which is rarely done in the traditional meta-analysis.
may have changed OA categories after the baseline visit,
resulting in possible misclassification bias. A further poten-
tial limitation is that the age of our participants at baseline
                                                                  Conclusion
ranged between 45 and 80; however, the mean age between
cohorts was relatively similar with lowest having a mean age
                                                                  This study is the first individual participant-level data meta-
of 56.0 and the highest with a mean age of 64.4 (Table 1).
                                                                  analysis of knee osteoarthritis and premature mortality. It dem-
   Both a strength and limitation of the current study is that
                                                                  onstrates that participants with knee pain only or a combina-
we included cohorts from different countries, with different
                                                                  tion of knee pain and radiographic OA had a 35–37% increased
races, cultures and health care systems. Confounders were
                                                                  association with reduced time-to all-cause-mortality independ-
                                                                  ent of age, sex, race, BMI, smoking, alcohol, CVD, or diabetes.

13
Aging Clinical and Experimental Research (2021) 33:529–545                                                                                           539

With the increasing prevalence of knee OA, it is essential that                          highlights that osteoarthritis is a serious disease and supports
clinicians and public health bodies are aware of the potential                           the need for further research to identify whether OA-related
that people with OA may have an increased burden of prema-                               mechanisms are causally associated with premature mortality.
ture mortality compared to people without OA. This finding

Appendix 1: Cohort inclusion flow chart

                                                   40 cohorts identified using search terms “knee
                     Identification

                                                  osteoarthritis” and “cohort” AND non-traditional
                                                   methods (conferences, OA research networks)

                                                                                     18 cohorts excluded based on being non-observational or
                                                                                          non-community based or a case- control study

                                                 22 cohorts screened for knee pain/radiographic data
                      Screening

                                                                                       13 cohorts excluded based on missing or non-targeted
                                                                                          information for knee pain/radiographic OA data

                                                        9 Cohorts screened for mortality data

                                                                                     2 cohorts excluded based on lack of mortality or detailed
                                                                                                     mortality (time to death)

                                                        7 Cohorts identified for IPD analysis
                     Obtaining data

                                                                                        1 eligible but IPD not sought as data not accessible

                                                           6 cohorts for which IPD sought

                                       Cohorts for which IPD were provided         Cohorts for which aggregate data
                                                      (N=6)                                 were provided
                                       N= 11,522 participants for whom data                     (N=0)
                                                  were provided
                                        N= 291 participants for whom data
                                                 weren’t provided
                      Available data

                                           Cohorts included in analysis
                                                      (n=6)
                                        N= 10,723 participants included in
                                                     analysis
                                       N= 799 participants excluded (due to
                                        presence of Rheumatoid Arthritis,
                                       aged Age under 45 or over 80 years
                                          old or missing mortality data)

                                                                                                                                                 13
540                                                                     Aging Clinical and Experimental Research (2021) 33:529–545

Appendix 2: Cohort inclusion/exclusion                       Appendix 3: Complete case vs subjects
criteria and missing data                                    with missing values for each cohort

                                                             See Tables 3, 4, 5, 6, 7, 8.
                  Ching- John- Framing- MOST Tas- Wuchuan
                  ford   ston   ham          OAC
                         County                              Table 3  Johnston County complete case vs subjects with any missing
                                                             values for risk factor and confounders
Original          1003     4197   1166   3026   1100 1030
 cohort N                                                    Baseline variable           Complete case Missing values p value
 Subjects
   meeting                                                   N = 3918                    3762            156
   inclusion                                                 Osteoarthritis
   criteria                                                   None                       1707 (45.4%)    0
   Without        996      ..     1154   2938   983   ..      ROA                        378 (10.1%)     0
     Rheu-
                                                              POA                        1023 (27.2%)    0
     matoid
     Arthritis                                                PROA                       654 (17.4%)     0
   Age (45–       992      3968   905    2938   980   1017   Age                         59.8 (9.4)      63.3 (10.4)      0.000
     80 years)                                               Sex (% female)              2348 (62.4%)    109 (69.9%)      0.059
   Mortality      992      3918   905    2936   955   1017   Race
     data                                                     Caucasian                  2466 (65.6%)    102 (65.4%)      0.966
Total             992      3918   905    2936   955   1017    African American           1296 (34.5%)    54 (34.6%)
 Subjects
                                                             BMI (continuous)            29.7 (6.4)      29.3 (6.1)       0.4253
 meeting
 Inclusion                                                   Ex/current smoking          1885 (51.1%)    48 (44.0%)       0.145
 Criteria*                                                    (binary)
 Subjects                                                    CVD2 (heart/stroke)         1057 (28.1%)    41 (26.3%)       0.621
   without                                                   Diabetes                    487 (13.0%)     22 (14.5%)       0.588
   missing
   data                                                      t tests (or Wilcoxon–Mann–Whitney test) for continuous variables
                                                             and ­Chi2-tests (or Fishers exact) for categorical variable
   PROA           959      3762   905    2906   880   1016
   Sex            992      3762   886    2906   880   1016
   Race           992      3762   886    2906   ..    1016
   BMI            959      3756   886    2905   880   1016   Table 4  Framingham complete case vs subjects with any missing val-
                                                             ues for risk factor and confounders
   Alcohol        959      ..     884    ..     880   ..
   Smoking        959      3681   883    2905   879   ..     Baseline variable           Complete case Missing values p value
   CVD            956      3681   869    2824   843   1016
                                                             N = 905                     886             19
   Diabetes       956      3676   865    2762   843   1016
                                                             Osteoarthritis
Total subjects    956      3676   865    2762   843   1016    None                       594 (67.0%)     0
 without
 missing                                                      ROA                        63 (7.1%)       0
 data                                                         POA                        181 (20.4%)     0
                                                              PROA                       48 (5.4%)       0
a
    Total N after imputation                                 Age                         56.0 (7.6)      57.2 (7.6)       0.466
                                                             Sex (% female)              461 (52.0%)     13 (68.4%)       0.157
                                                             Race
                                                              Caucasian                  886 (100%)      19 (100%)
                                                             BMI (continuous)            27.3 (4.6)      26.8 (3.1)       0.809
                                                             Ex/current Smoking          568 (64.2%)     12 (63.2%)       0.927
                                                              (binary)
                                                             CVD2 (heart/stroke)         30 (3.4%)       0
                                                             Diabetes                    39 (4.4%)       1 (5.3%)         0.860

                                                             t tests (or Wilcoxon–Mann–Whitney test) for continuous variables
                                                             and ­Chi2 tests (or Fishers exact) for categorical variables

13
Aging Clinical and Experimental Research (2021) 33:529–545                                                                         541

Table 5  Chingford complete case vs subjects with any missing values for risk factor and confounders
Baseline variable                                     Complete case                             Missing values                  p value

N = 857                                               683                                       174
Osteoarthritis
 None                                                 483 (70.7%)                               0
 ROA                                                  129 (18.9%)                               0
 POA                                                  41 (6.0%)                                 0
 PROA                                                 30 (4.4%)                                 0
Age                                                   57.9 (6.0)                                58.1 (5.9)                      0.697
BMI (continuous)                                      26.3 (4.4)                                26.4 (4.3)                      0.735
Ex/current smoking (binary)                           317 (46.4%)                               70 (40.2)                       0.143
CVD2 (heart/stroke)                                   25 (4.3%)                                 10 (7.4%)                       0.134
Diabetes                                              6 (0.9%)                                  3 (1.7%)                        0.329

                                                                     ­ hi2-tests (or Fishers exact) for categorical variables
t tests (or Wilcoxon–Mann–Whitney test) for continuous variables and C

Table 6  MOST complete case vs subjects with any missing values for risk factor and confounders
Baseline variable                                     Complete case                             Missing values                  p value

N = 2936                                              2906                                      30
Osteoarthritis
 None                                                 827 (28.5%)                               0
 ROA                                                  503 (17.3%)                               0
 POA                                                  608 (20.9%)                               0
 PROA                                                 968 (33.3%)                               0
Age                                                   62.5 (8.1)                                64.3 (6.9)                      0.215
Sex (% female)                                        1759 (60.5%)                              16 (53.3%)                      0.423
Race
 Caucasian                                            2449 (84.3%)                              21 (70.0%)                      0.058
 African American                                     418 (14.4%)                               8 (26.7%)
 Other                                                39 (1.3%)                                 1 (3.3%)
BMI (continuous)                                      30.7 (5.9)                                30.4 (6.7)                      0.805
Ex/current Smoking (binary)                           1292 (44.5%)                              13 (43.3%)                      0.902
CVD2 (heart/stroke)                                   335 (11.9%)                               4 (13.8%)                       0.749
Diabetes                                              304 (10.7%)                               3 (10.0%)                       0.901

                                                                     ­ hi2-tests (or Fishers exact) for categorical variables
t tests (or Wilcoxon–Mann–Whitney test) for continuous variables and C

                                                                                                                                13
542                                                                                      Aging Clinical and Experimental Research (2021) 33:529–545

Table 7  TaSOAC complete case       Baseline variable                                  Complete case              Missing values             p value
vs subjects with any missing
values for risk factor and          N = 445                                            410                        35
confounders
                                    Osteoarthritis (no-side specific pain)
                                      None                                             96 (23.4%)                 0
                                      ROA                                              157 (38.3%)                0
                                      POA                                              42 (10.2%)                 0
                                      PROA                                             115 (28.1%)                0
                                    Age                                                64.4 (7.9)                 65.1 (8.7)                 0.6464
                                    Sex (% female)                                     209 (51.0%)                18 (51.4%)                 0.959
                                    Race
                                    Caucasian white                                    263 (98.1%)                19 (100%)                  0.835
                                    Asian                                              2 (0.8%)
                                    Indigenous Australian                              3 (1.1%)
                                    BMI (continuous)                                   28.2 (5.2)                 27.6 (4.0)                 0.4707
                                    Ex/current Smoking (binary)                        224 (54.6%)                20 (58.8%)                 0.637
                                    CVD2 (heart/stroke)                                44 (11.7%)                 5 (17.2%)                  0.378
                                    Diabetes                                           36 (9.6%)                  4 (13.8%)                  0.463

                                                                                                         ­ hi2-tests (or Fishers exact) for cat-
                                    t tests (or Wilcoxon–Mann–Whitney test) for continuous variables and C
                                    egorical variables

Table 8  Wuchuan complete case vs subjects with any missing values           (marita.cross@sydney.edu.au); Lauren King (laurenkarinaking@
for risk factor and confounders                                              gmail.com).

Baseline variable         Complete case    Missing values     p value        Author contributions KML, LSG, NKA, CC, GJ, JMJ, MN, and
                                                                             PCCOA were involved in the study conception. KML, LSG, DA, NKA,
N = 1017                  1016             1                                 GC, CC, AJ, MN, JN, and NY contributed to study design. NKA, DF,
Osteoarthritis                                                               JG, JMJ, JL, LFC, RC, MEB, QL, and MN contributed data. KML,
 None                     469 (46.2%)                                        LSG, and MTSS analysed the data. KML, LSG, DA, NKA, GC, CC,
                                                                             DH, AJ, MN, and MTSS interpreted the data. LSG and KML undertook
 ROA                      42 (4.1%)
                                                                             the literature search and drafted the manuscript. All authors critically
 POA                      398 (39.2%)                                        reviewed the manuscript. KML, LSG, NKA, GC, CC, DF, DH, GJ,
 PRO                      107 (10.5%)                                        JMJ, LFC, RC, MEB, AJ, JL, QL, MN, JN, MTSS, NY, and PCCOA
Age                       56.4 (7.7)                                         approved the final version. KML had full access to all data in the study
                                                                             and had final responsibility for the decision to submit for publication.
Sex (% female)            515 (50.7%)
BMI [mean (SD)]           22.5 (3.3)
                                                                             Funding This study was funded by the Centre for Sport Exercise and
CVD (heart/stroke) (%)    119 (11.7%)                                        Osteoarthritis Research Versus Arthritis (grant 21595).
Diabetes                  5 (0.5%)

Data is not presented for missing values, and no tests were done com-        Compliance with ethical standards
paring groups due to small number of participants with missing data
                                                                             Conflict of interest Dr Leyland reports grants from the Centre for Sport,
                                                                             Exercise and Osteoarthritis Research Versus Arthritis, during the con-
                                                                             duct of the study. Dr Gates is funded by the Centre for Sport, Exercise
Acknowledgements This study was funded by the Sport, Exercise                and Osteoarthritis Research Versus Arthritis. Professor Arden reports
and Osteoarthritis Centre: Versus Arthritis and the PCCOA, Osteo-            grants from the Centre for Sport, Exercise and Osteoarthritis Research
arthritis Research Society International. This study would not have          Versus Arthritis, grants from Merck, and personal fees from Merck, Pfiz-
been possible without the late Professor Doug Altman, who was instru-        er/Lilly. Professor Cooper reports personal fees from Alliance for Better
mental in the study conception, design, and analysis. We are grateful        Bone Health, Amgen, Eli Lilly, GSK, Medtronic, Merck, Novartis, Pfiz-
to Sally Sheard for her help in acquiring and harmonising the data           er, Roche, Servier, Takeda, and UCB. Professor Hunter reports personal
used in this manuscript. PCCOA (Pre-Competitive Consortium for               fees from Merck Serono, Pfizer, Lilly, and TLCBio. Professor Jordan re-
Osteoarthritis) OARSI steering committee: Lyn March (lyn.march@              ports grants from National Institutes of Health, Centers for Disease Con-
sydney.edu.au); Gillian Hawker (g.hawker@utoronto.ca); Philip Cona-          trol and Prevention, American College of Rheumatology, personal fees
ghan (P.Conaghan@leeds.ac.uk); Virginia Byers Kraus (kraus004@               from Samumed, Flexion, Osteoarthritis Research Society International,
duke.edu); Ali Guermazi (guermazi@bu.edu); David Hunter (David.              and National Institutes of Health. Professor Judge reports personal fees
Hunter@sydney.edu.au); Jeffrey N. Katz (jnkatz@bwh.harvard.edu);             from Anthera Pharmaceuticals Ltd, Freshfields, Bruckhaus, and Derrin-
Tim McAlindon (tmcalindon@tuftsmedicalcenter.org); Tuhina Neogi              ger. Professor Jones reports personal fees from BMS, Roche, Abbvie,
(tneogi@bu.edu); Lee Simon (lssconsult@aol.com); Marita Cross

13
Aging Clinical and Experimental Research (2021) 33:529–545                                                                                         543

Amgen, Lilly, Novartis, Jannsen, and grants from Covance. Professor            14. Kluzek S, Sanchez-Santos MT, Leyland KM et al (2016) Painful
Felson has nothing to disclose.                                                    knee but not hand osteoarthritis is an independent predictor of
                                                                                   mortality over 23 years follow-up of a population-based cohort
Statement of human and animal rights All procedures performed in                   of middle-aged women. Ann Rheum Dis 75:1749–1756
each original cohort study were in accordance with the ethical stand-          15. Liu Q, Niu J, Huang J et al (2015) Knee osteoarthritis and all-
ards of the institution and the associated national research committee.            cause mortality: the Wuchuan Osteoarthritis Study. Osteoarthritis
                                                                                   Cartil 23:1154–1157
Informed consent All participants provided written informed consent            16. Turkiewicz A, Neogi T, Bjork J et al (2016) All-cause mortality in
to participate in each original cohort study.                                      knee and hip osteoarthritis and rheumatoid arthritis. Epidemiol-
                                                                                   ogy 27:479–485
                                                                               17. Sterne JAC, Egger M, Smith GD (2001) Investigating and deal-
Open Access This article is licensed under a Creative Commons Attri-               ing with publication and other biases in meta-analysis. BMJ
bution 4.0 International License, which permits use, sharing, adapta-              323:101–105
tion, distribution and reproduction in any medium or format, as long           18. Altman DG (2001) Systematic reviews of evaluations of prognos-
as you give appropriate credit to the original author(s) and the source,           tic variables. BMJ 323:224–228
provide a link to the Creative Commons licence, and indicate if changes        19. Riley RD, Simmonds MC, Look MP (2007) Evidence synthesis
were made. The images or other third party material in this article are            combining individual patient data and aggregate data: a systematic
included in the article’s Creative Commons licence, unless indicated               review identified current practice and possible methods. J Clin
otherwise in a credit line to the material. If material is not included in         Epidemiol 60:431–439
the article’s Creative Commons licence and your intended use is not            20. Altman DG, Trivella M, Pezzella F et al (2007) Systematic review
permitted by statutory regulation or exceeds the permitted use, you will           of multiple studies of prognosis: the feasibility of obtaining indi-
need to obtain permission directly from the copyright holder. To view a            vidual patient data. In: Auget J-L, Balakrishnan N, Mesbah M,
copy of this licence, visit http://creat​iveco​mmons​.org/licen​ses/by/4.0/.       Molenberghs G (eds) Advances in statistical methods for the
                                                                                   health sciences: applications to cancer and AIDS studies, genome
                                                                                   sequence analysis, and survival analysis. Birkhäuser, Boston, pp
                                                                                   3–18
References                                                                     21. Riley RD, Lambert PC, Abo-Zaid G (2010) Meta-analysis of indi-
                                                                                   vidual participant data: rationale, conduct, and reporting. BMJ
 1. James SL, Abate D, Abate KH et al (2018) Global, regional, and                 340:c221
    national incidence, prevalence, and years lived with disability            22. Leyland KM, Gates LS, Nevitt M et al (2018) Harmonising meas-
    for 354 diseases and injuries for 195 countries and territories,               ures of knee and hip osteoarthritis in population-based cohort
    1990–2017: a systematic analysis for the Global Burden of Dis-                 studies: an international study. Osteoarthritis Cartil 26:872–879
    ease Study 2017. Lancet 392:1789–1858                                      23. Burke DL, Ensor J, Riley RD (2017) Meta-analysis using indi-
 2. Murphy L, Schwartz TA, Helmick CG et al (2008) Lifetime risk of                vidual participant data: one-stage and two-stage approaches, and
    symptomatic knee osteoarthritis. Arthritis Rheum 59:1207–1213                  why they may differ. Stat Med 36:855–875
 3. Losina E, Walensky RP, Reichmann WM et al (2011) Impact of                 24. Jordan JM, Linder GF, Renner JB et al (1995) The impact of
    obesity and knee osteoarthritis on morbidity and mortality in older            arthritis in rural populations. Arthritis Care Res 8:242–250
    Americans. Ann Intern Med 154:217–226                                      25. Feinleib M, Kannel WB, Garrison RJ et al (1975) The Framing-
 4. Litwic A, Edwards MH, Dennison EM et al (2013) Epidemiology                    ham offspring study. Design and preliminary data. Prev Med
    and burden of osteoarthritis. Br Med Bull 105:185–199                          4:518–525
 5. Steultjens MP, Dekker J, van Baar ME et al (2000) Range of joint           26. Felson DT, Naimark A, Anderson J et al (1987) The prevalence
    motion and disability in patients with osteoarthritis of the knee or           of knee osteoarthritis in the elderly the Framingham osteoar-
    hip. Rheumatology (Oxford) 39:955–961                                          thritis study. Arthritis Rheum 30:914–918
 6. Hochberg MC (2008) Mortality in osteoarthritis. Clin Exp Rheu-             27. Hart DJ, Mootoosamy I, Doyle DV et al (1994) The relationship
    matol 26(Suppl 51):S120–S124                                                   between osteoarthritis and osteoporosis in the general popula-
 7. Xing D, Xu Y, Liu Q et al (2016) Osteoarthritis and all-cause                  tion: the Chingford Study. Ann Rheum Dis 53:158–162
    mortality in worldwide populations: grading the evidence from a            28. Kang X, Fransen M, Zhang Y et al (2009) The high preva-
    meta-analysis. Sci Rep 6:24393                                                 lence of knee osteoarthritis in a rural Chinese population: the
 8. Veronese N, Cereda E, Maggi S et al (2016) Osteoarthritis and                  Wuchuan osteoarthritis study. Arthritis Rheum 61:641–647
    mortality: a prospective cohort study and systematic review with           29. Ding C, Parameswaran V, Cicuttini F et al (2008) Associa-
    meta-analysis. Semin Arthritis Rheum 46:160–167                                tion between leptin, body composition, sex and knee cartilage
 9. Han X, Liu Z, Kong L et al (2017) Association between osteoar-                 morphology in older adults: the Tasmanian older adult cohort
    thritis and mortality: a meta-analysis. Int J Clin Exp Med 10:1094             (TASOAC) study. Ann Rheum Dis 67:1256–1261
10. Holbrook TL, Wingard DL, Barrett-Connor E (1990) Self-                     30. Anderson JJ, Felson DT (1988) Factors associated with osteo-
    reported arthritis among men and women in an adult community.                  arthritis of the knee in the first national Health and Nutrition
    J Community Health 15:195–208                                                  Examination Survey (HANES I). Evidence for an association
11. Nuesch E, Dieppe P, Reichenbach S et al (2011) All cause and dis-              with overweight, race, and physical demands of work. Am J
    ease specific mortality in patients with knee or hip osteoarthritis:           Epidemiol 128:179–189
    population based cohort study. BMJ 342:d1165                               31. Bellamy N, Buchanan WW, Goldsmith CH et al (1988) Valida-
12. Tsuboi M, Hasegawa Y, Matsuyama Y et al (2011) Do musculo-                     tion study of WOMAC: a health status instrument for measuring
    skeletal degenerative diseases affect mortality and cause of death             clinically important patient relevant outcomes to antirheumatic
    after 10 years in Japan? J Bone Miner Metab 29:217–223                         drug therapy in patients with osteoarthritis of the hip or knee. J
13. Cacciatore F, Della-Morte D, Basile C et al (2014) Long-term                   Rheumatol 15:1833–1840
    mortality in frail elderly subjects with osteoarthritis. Rheumatol-        32. Kellgren JH, Lawrence JS (1957) Radiological assessment of
    ogy (Oxford) 53:293–299                                                        osteo-arthrosis. Ann Rheum Dis 16:494–502

                                                                                                                                          13
544                                                                                  Aging Clinical and Experimental Research (2021) 33:529–545

33. Altman RD, Gold GE (2007) Atlas of individual radio-                 45. Wilkie R, Parmar SS, Blagojevic-Bucknall M et al (2019) Reasons
    graphic features in osteoarthritis, revised. Osteoarthritis Cartil       why osteoarthritis predicts mortality: path analysis within a Cox
    15:A1–A56                                                                proportional hazards model. RMD Open 5:e001048
34. Royston P (2007) Multiple imputation of missing values: further      46. Cleveland RJ, Alvarez C, Schwartz TA et al (2019) The impact
    update of ice, with an emphasis on interval censoring. Stata J           of painful knee osteoarthritis on mortality: a community-based
    7:445–464                                                                cohort study with over 24 years of follow-up. Osteoarthritis Cartil
35. van Buuren S (2007) Multiple imputation of discrete and continu-         27:593–602
    ous data by fully conditional specification. Stat Methods Med Res    47. Castano Betancourt MC, Dehghan A, Campos N et al (2013)
    16:219–242                                                               Osteoarthritis and mortality: meta-analysis of two prospective
36. White IR, Royston P (2009) Imputing missing covariate values             cohorts. Osteoarthritis Cartil 21:S151
    for the Cox model. Stat Med 28:1982–1998                             48. van Dijk GM, Veenhof C, Schellevis F et al (2008) Comorbidity,
37. Vink G, Frank LE, Pannekoek J et al (2014) Predictive mean               limitations in activities and pain in patients with osteoarthritis of
    matching imputation of semicontinuous variables. Stat Neerl              the hip or knee. BMC Musculoskelet Disord 9:95
    68:61–90                                                             49. Kadam UT, Jordan K, Croft PR (2004) Clinical comorbidity in
38. Thomas D, Radji S, Benedetti A (2014) Systematic review of               patients with osteoarthritis: a case-control study of general prac-
    methods for individual patient data meta-analysis with binary            tice consulters in England and Wales. Ann Rheum Dis 63:408–414
    outcomes. BMC Med Res Methodol 14:79                                 50. Clynes MA, Jameson KA, Edwards MH et al (2019) Impact of
39. Hartung J, Knapp G (2001) A refined method for the meta-anal-            osteoarthritis on activities of daily living: does joint site matter?
    ysis of controlled clinical trials with binary outcome. Stat Med         Aging Clin Exp Res 31:1049–1056
    20:3875–3889                                                         51. Cleveland RJ, Alvarez C, Nelson AE et al (2020) Hip symptoms
40. IntHout J, Ioannidis JPA, Borm GF (2014) The Hartung–Knapp–              are associated with premature mortality: the Johnston County
    Sidik–Jonkman method for random effects meta-analysis is                 Osteoarthritis Project. Osteoarthritis Cartil 28:1330–1340
    straightforward and considerably outperforms the standard Der-       52. Schiphof D, Boers M, Bierma-Zeinstra SM (2008) Differences in
    Simonian–Laird method. BMC Med Res Methodol 14:25                        descriptions of Kellgren and Lawrence grades of knee osteoar-
41. Harris R, Bradburn M, Deeks J et al (2008) metan: fixed- and             thritis. Ann Rheum Dis 67:1034–1036
    random-effects meta-analysis. Stata J 8:3–28                         53. Pereira D, Peleteiro B, Araujo J et al (2011) The effect of osteo-
42. Hawker GA, Croxford R, Bierman AS et al (2014) All-cause mor-            arthritis definition on prevalence and incidence estimates: a sys-
    tality and serious cardiovascular events in people with hip and          tematic review. Osteoarthritis Cartil 19:1270–1285
    knee osteoarthritis: a population based cohort study. PloS one       54. Lapane KL, Liu S-H (2016) Commentary: osteoarthritis and mor-
    9:e91286-e                                                               tality: answering questions or questioning answers? Epidemiology
43. Liu Q, Niu J, Li H et al (2017) Knee symptomatic osteoarthritis,         (Cambridge, Mass) 27:477–478
    walking disability, NSAIDs use and all-cause mortality: popula-
    tion-based Wuchuan osteoarthritis study. Sci Rep 7:3309              Publisher’s Note Springer Nature remains neutral with regard to
44. Smith D, Wilkie R, Croft P et al (2018) Pain and mortality in        jurisdictional claims in published maps and institutional affiliations.
    older adults: the influence of pain phenotype. Arthritis Care Res
    70:236–243

13
You can also read