AMAZON SAGEMAKER DEBUGGER: A SYSTEM FOR REAL-TIME INSIGHTS - MLSys Proceedings
←
→
Page content transcription
If your browser does not render page correctly, please read the page content below
A MAZON S AGE M AKER D EBUGGER : A S YSTEM FOR R EAL -T IME I NSIGHTS
             INTO M ACHINE L EARNING M ODEL T RAINING

       Nathalie Rauschmayr 1 Vikas Kumar 1 Rahul Huilgol 1 Andrea Olgiati 1 Satadal Bhattacharjee 1
 Nihal Harish 1 Vandana Kannan 1 Amol Lele 1 Anirudh Acharya 1 Jared Nielsen 1 Lakshmi Ramakrishnan 1
  Ishaaq Chandy 1 Ishan Bhatt 1 Zhihan Li 1 Kohen Chia 1 Neelesh Dodda 1 Jiacheng Gu 1 Miyoung Choi 1
Balajee Nagarajan 1 Jeffrey Geevarghese 1 Denis Davydenko 1 Sifei Li 1 Lu Huang 1 Edward Kim 1 Tyler Hill 1
                                          Krishnaram Kenthapadi 1

                                                            A BSTRACT
        Manual debugging is a common productivity drain in the machine learning (ML) lifecycle. Identifying under-
        performing training jobs requires constant developer attention and deep domain expertise. As state-of-the-art
        models grow in size and complexity, debugging becomes increasingly difficult. Just as unit tests boost traditional
        software development, an automated ML debugging library can save time and money. We present Amazon
        SageMaker Debugger, a machine learning feature that automatically identifies and stops underperforming training
        jobs. Debugger is a new feature of Amazon SageMaker that automatically captures relevant data during training
        and evaluation and presents it for online and offline inspection. Debugger helps users define a set of conditions, in
        the form of built-in or custom rules, that are applied to this data, thereby enabling users to catch training issues
        as well as monitor and debug ML model training in real-time. These rules save time and money by alerting the
        developer and terminating a problematic training job early.

1       I NTRODUCTION                                               the needs of inexperienced ML practitioners who may not
                                                                    have the expertise to detect and analyze such issues and also
Prototyping and training machine learning (ML) models is            of experienced ML scientists who want to directly inspect
an iterative process that typically consists of much trial and      and analyze tensors. It can be used either as a stand-alone
error (Cadamuro & Gilad-Bachrach, 2016; Xin et al., 2018).          open source library or as a fully managed service, integrated
The ML lifecycle consists of several steps including data           with Amazon SageMaker2 (Liberty et al., 2020), the ML
preprocessing, data augmentation, model creation and con-           platform offered by Amazon Web Services (AWS).
figuration, hyperparameter tuning, and model deployment.
A mistake in any of these may lead to an underperforming            Our key contributions are as follows:
model, or simply the training not converging at all without
any immediate feedback to the model developer. Training                • Design and implementation of Debugger, including (1)
deep learning models requires substantial computational re-              A concise framework-agnostic API to store, read, and
sources (Strubell et al., 2020), so it is imperative to discover         analyze tensors during model training; (2) Automatic
issues early to shorten the model production cycle and to                recording of all model parameters from XGBoost, Py-
avoid expensive training runs that lead to sub-par results.              Torch, TensorFlow, and MXNet models; (3) Integra-
                                                                         tion with Amazon SageMaker as a scalable, secure,
We present Amazon SageMaker Debugger1 , a framework-
                                                                         and fully managed service (§3).
agnostic system that allows ML developers to capture im-
portant data during ML model training. Debugger automat-               • Description of Debugger built-in rules to identify com-
ically identifies problems such as vanishing or exploding                mon issues & terminate failing training jobs early (§4).
gradients, neuron saturation, and overfitting. It addresses
                                                                       • Deployment results & insights (§5) and case study (§6).
    1
    Amazon AWS AI. Correspondence to: Nathalie Rauschmayr
, Lu Huang , Kr-                Amazon SageMaker Debugger (hereafter referred to as De-
ishnaram Kenthapadi .
                                                                    bugger) enables users to gain insights into model train-
Proceedings of the 4 th MLSys Conference, San Jose, CA, USA,        ing without requiring them to write their own framework-
2021. Copyright 2021 by the author(s).                              specific probes. These insights help to guide model design
    1
        https://aws.amazon.com/sagemaker/debugger
                                                                       2
                                                                           https://aws.amazon.com/sagemaker
Amazon SageMaker Debugger

decisions: in one customer use case, Debugger helped re-                                           Feature engineering
                                                                             1. Data preparation   Detect data issues
duce model size by 45% and the number of GPU operations
by 33% while improving accuracy (§6). Early termination of
training jobs via built-in rules saves time and costs. While
the amount saved depends on the given model and train-                                             Detect training issues
ing configuration, we have observed savings of up to 30%.                   2. ML model training   Auto-terminate training jobs
                                                                                                   Get model insights
Debugger has been used by AWS customers from many
different industry segments and has often been helpful to
improve model performance. We note that the core com-
ponent of Debugger is the open source library, smdebug3 ,
which allows users to benefit from many of Debugger’s                        3. Hyperparameter     Detect issues in tuning jobs
features even if they do not use Amazon SageMaker.                                tuning           Auto-terminate tuning jobs

The rest of the paper is organized as follows. We first present
a high level overview of debugging in the ML lifecycle in §2.
We describe the design and architecture of Debugger in §3                      4. Deployment       Understand predictions
and the built-in rules in §4. We present deployment results
and insights in §5, followed by a case study of how Debug-
ger helps in the ML development journey in §6. Finally, we                     Figure 1. Debugging in the ML lifecycle
discuss related work in §7 and conclude in §8.

2        D EBUGGING IN THE ML LIFECYCLE                                  across layers in real-time can reveal if the model is
                                                                         over-parameterized or whether optimizer settings were
Debugging an ML training script is quite different from                  incorrectly set. Similarly, activation outputs can show
debugging traditional software. While a software bug some-               how many neurons suffer from saturation. Monitoring
times causes a compilation error, a poor hyperparameter                  training and validation losses help to detect overfitting.
initialization will converge to poor accuracy rather than fail           Overall it is crucial to detect issues early on and stop
explicitly. So how do we approach ML debugging? The key                  training runs destined to produce a low-quality model.
is to isolate root causes for low model performance, such                Another key aspect of debugging is to get a high-level
as bad hyperparameter settings, low model capacity, biased               understanding of what the model learns, e.g., which
training data, and numerically unstable operations. Fig. 1               features in the input data are most relevant.
shows a high level overview of the ML lifecycle and how
debugging can be done at each stage.                                  3. Hyperparameter tuning will further refine a good model
                                                                         configuration. At this stage, ML practitioners often cre-
    1. Data preparation encompasses data cleaning, data pre-             ate different versions of a model with different hyper-
       processing, and feature engineering. It ensures that              parameter combinations, whereby sub-optimal models
       data contains representative samples and that training            may be produced. Debugging sub-optimal training
       and test sets are randomly sampled and do not overlap.            jobs ahead of time helps save time and costs.
       If the data contains too many correlated features the
                                                                      4. Deployment is the final step after model training and
       model may be more likely to overfit.
                                                                         hyperparameter tuning. At this stage, problems such
    2. Model training is an iterative process, where differ-             as data drift can occur, where the distribution of the
       ent configurations and model architectures are applied.           data during inference is significantly different from
       If the model has too few parameters it cannot learn               the distribution of data the model has been trained
       meaningful patterns; if it has too many parameters it             on. This can lead to unexpected model behavior and
       can likely overfit. For model training to converge it             debugging could help to understand such behavior and
       is important to choose the best possible training con-            find possible root causes.
       figuration that encompasses initialization schema, op-
       timizer settings, layer configurations, and other hy-
       perparameters. While most incorrect configurations         3     S AGE M AKER D EBUGGER D ESIGN AND
       lead to a non-decreasing loss, the root cause may not            A RCHITECTURE
       always be obvious. For deep learning models, moni-
       toring the distribution of gradients and weight updates    We next describe the design and architecture of Debugger.
                                                                  Before diving deep into its core functionalities we first give
     3
         https://pypi.org/project/smdebug                         a brief overview of Amazon SageMaker to set the context.
Amazon SageMaker Debugger

3.1        Amazon SageMaker                                          For instance, users can define forward hooks in PyTorch
                                                                     (Paszke et al., 2019) and MXNet (Chen et al., 2015) that
Amazon SageMaker is a fully managed service provided as
                                                                     allow one to overwrite the default behavior during a for-
part of Amazon Web Services (AWS) that enables data sci-
                                                                     ward pass. Keras (Chollet et al., 2015) provides functions
entists and developers to build, train, and deploy ML models
                                                                     such as on batch end and on batch begin. Debug-
in the cloud at any scale. It offers purpose-built tools for
                                                                     ger leverages those mechanisms under the hood to store
every step of ML development, including data labeling, data
                                                                     tensors during model training. Debugger provides users a
preparation, feature engineering, auto-ML, training, auto-
                                                                     concise API to enable and configure those hooks.
matic model tuning, debugging, deployment, hosting, model
monitoring, bias detection, explainability, and workflows.           The first step is to register the smdebug hook on the model.
SageMaker automatically spins up the training instance re-           For example, in the case of TensorFlow Keras this can be
quested by the user, pulls the training image from Amazon            done in the following way:
Elastic Container Registry (ECR)4 , and downloads data and
                                                                     1     import smdebug.tensorflow as smd
training scripts into the container.
                                                                     2     hook = smd.KerasHook("/opt/ml/tensors")
Once the training is initiated, model data is retrieved by           3     model.fit(x, y, epochs=10, callbacks=[hook])
Debugger at specific intervals. The SageMaker platform
asynchronously uploads the Debugger data to the customer’s           SageMaker’s default deep learning containers for XGBoost,
S3 bucket.                                                           TensorFlow, PyTorch, and MXNet are modified such that the
                                                                     hook registration and configuration is automatically done
                                                                     within the container, so users do not need to modify their
3.2        Debugger Components
                                                                     training script (i.e., zero code change).
Debugger consists of two major components:
                                                                     Users can specify collections of tensors to be emitted and
                                                                     they can choose any of the default ones such as weights,
  • smdebug: this is the core library used to record and             biases, gradients, and losses, or define their own custom
    load tensors. It provides basic functionalities to read,         collection. For example, the following custom collection
    query, and filter data by step, training phase, and tensor       captures ReLU activation outputs:
    names. smdebug’s design strives to satisfy two goals:
                                                                     1     custom_collection=CollectionConfig(
            1. ease of use by providing a framework agnostic,        2         name="relu_ouput",
               concise API for data collection and analysis          3         parameters={
                                                                     4             "include_regex": ".*relu_output",
            2. customization and extensibility                       5             "save_interval": "500"
                                                                     6         }
          With just two lines of code, users can enable data col-    7     )
          lection and use any of the default collections such as
          weights, biases, gradients, and losses. During analysis,   The regular expression .*relu output specifies tensor
          data is loaded as NumPy arrays independently of the        names to be included in the collection and tensors are saved
          underlying framework that generated the tensors. The       every 500 steps. A step consists of one forward pass and
          library has been open-sourced on PyPI5 and GitHub6 .       one backward pass. Users can also set a mode to distinguish
                                                                     between tensors saved during training and validation phases
  • Built-in rules: As part of SageMaker, users can run a            (if not specified, steps are recorded as global steps). Instead
    set of pre-defined rules that analyze a training job while       of a save interval one can also specify a list of specific
    in progress. Debugger uses the smdebug library to                step numbers.
    record tensors from the training job which are then up-
    loaded to Amazon Simple Storage Service (S3). Rules
                                                                     3.4    Data Analysis
    are executed in a dedicated Docker container where
    the data is fetched and checked for certain conditions           Once the training has started, tensors will be saved under the
    such as vanishing gradients or overfitting.                      path specified during hook construction. Tensors are written
                                                                     in the form of protobuf files and the SageMaker platform up-
3.3        Data Collection                                           loads these to Amazon S3. This is done asynchronously to
                                                                     reduce impact on the training job. Users can then fetch, ana-
All major deep learning frameworks provide mechanisms                lyze, and query the data using the smdebug library. This can
to insert hooks into a model in order to run custom code.            be done while the training is still in progress, thereby sup-
      4
          https://aws.amazon.com/ecr                                 porting advanced real-time analysis of the model training.
      5                                                              Debugger’s API allows retrieval of tensors given a regular
          https://pypi.org/project/smdebug
      6
          https://github.com/awslabs/sagemaker-debugger              expression, for a particular step, or given training/validation
Amazon SageMaker Debugger

mode. The data is loaded as framework-agnostic NumPy ar-                          SageMaker Training Container
rays, so an analysis routine written for data retrieved from a                              smdebug hook
PyTorch model will also work with data from a TensorFlow
                                                                               S3Agent
model.
To access tensors, users create a trial object that takes the                 S3 Bucket                           Stop
                                                                                                                  Training
location of tensors, which can either be an S3 path or a local
path:
                                                                           smdebug trial
                                                                                                                      Lambda
1     from smdebug.trials import create_trial                                    Rule Container                       Function
2     trial = create_trial("/opt/ml/tensors")                                       smdebug rule

The trial object allows one to access and query the tensors.
The following function returns the list of tensor names:

1     trial.tensor_names(regex=".*")                                                           Cloudwatch Alarm

                                                                                    Figure 2. Debugger workflow
Given the tensor name, we can retrieve the tensor for a
specific step:
                                                                  3.6   Technical Challenges
1     trial.tensor("conv0").value(step)
                                                                  This section summarizes the key technical challenges that
With just four lines of code, we can setup a custom mon-          Debugger addresses:
itoring routine that uses Debugger to automatically fetch
and visualize the latest data, for example, the distribution of
                                                                    1. Scale rule analysis by offloading into separate contain-
weights from a specific layer for the latest available valida-
                                                                       ers
tion step. Once the training job has finished, the parameter
trial.loaded all steps is set to True and the mon-
itoring loop is terminated:                                         2. Reduce overhead when recording and fetching tensors

1     while not trial.loaded_all_steps:            3. Separate compute and storage and minimize impact on
2       steps = trial.steps(mode=modes.EVAL)
3       t = trial.tensor("conv1").value(steps[-1])    training
4       plt.hist(t.flatten(), bins=100)
                                                                  1) Offloading analysis into separate containers on a different
3.5        Integration with Amazon SageMaker                      instance allows users to run an arbitrary number of rules
As shown in Fig. 2, a SageMaker training job runs in a train-     without impacting the training process itself. Users can
ing container and Debugger will emit tensors to Amazon            write their own custom rules and define the appropriate in-
S3. The built-in rules run on separate instances in a rule        stance, thereby enabling the execution of compute-intensive
container and as such they do not interfere with the training     analysis at scale.
job in terms of resource usage. The rules emit metrics to         2) Debugger incorporates several optimizations to reduce
Amazon CloudWatch7 , a monitoring and observability ser-          storage costs and improve I/O performance, for instance,
vice, to indicate whether an issue was found or not. Users        saving only a subset of tensors, computing aggregations,
can then set up a CloudWatch alarm and Lambda8 function           and supporting different save intervals. Further tensors are
to auto-terminate training jobs after a rule has triggered        stored in an efficient binary file format and data retrieval is
(Fig. 2). Furthermore users can specify their own custom          optimized with the help of index files that store metadata
rules, that run within SageMaker’s managed rule container.        such as name, shape, and step along with the location of
While the smdebug library provides all functionalities to         tensor objects in Amazon S3.
write and read tensors via a concise API, the key advantage       3) In the system design, data storage has been decoupled
of running Debugger in the SageMaker environment is that          from compute, and a storage component uploads data asyn-
ML models can be trained at large scale, be monitored, and        chronously to S3. Being a managed service, Debugger opti-
be auto-terminated when issues arise.                             mizes storage of large amounts of data (in GBs) across local
      7                                                           disk and S3 to be able to handle data emission at millisecond
          https://aws.amazon.com/cloudwatch/
      8
          https://aws.amazon.com/lambda/                          intervals.
Amazon SageMaker Debugger

4     S AGE M AKER D EBUGGER RULES                              problem, where the gradients become zero due to the acti-
                                                                vation output beingPzero (Lu et al., 2019). A dead ReLU
This section gives an overview of existing built-in rules                                n
                                                                can be defined as: i=0 ReLU (xi ) == 0 where n is the
(Tab. 1).                                                       number of batches. If too many neurons suffer from this
                                                                problem, then the model cannot effectively learn. Debugger
4.1   Training and test datasets                                has built-in rules that retrieve activation outputs across steps
Real world data-sets are typically imbalanced and noisy.        and determine how many neurons in a model output zero
If the model training does not account for these factors,       values based on the above formula. If a predefined threshold
the resulting model is likely to have poor predictive power     is exceeded, an issue is raised.
for the classes with very few samples (Buda et al., 2018)       The root causes of neuron saturation and dead ReLUs can
(Guo et al., 2008). There are multiple ways to address this     be mitigated by scaling the input data to have zero mean
problem: for example, during data-loading more samples          and unit variance. This symmetric initialization avoids a
can be drawn from the under-represented classes or the loss     dead ReLU problem. Additionally, it is desirable to pre-
function can be adjusted to assign a higher penalty to incor-   vent weights from growing too large which could push ac-
rect predictions using class weights (Japkowicz & Stephen,      tivation functions to their asymptotic bounds. ReLU is an
2002) (Buda et al., 2018). Debugger provides a built-in rule    unbounded function and adding a penalty term on large ac-
that analyzes the model inputs and predictions. The rule        tivation values helps to keep activations small and sparse
uses the imbalance ratio (Johnson & Khoshgoftaar, 2019)         (Glorot et al., 2011). Variants such as LeakyReLU, ELU,
                            maxi ζi
which is defined as: IR = min   j ζj
                                     where ζ is the number of   and SiLU circumvent the dying ReLU problem by allow-
class occurrences. Since Debugger has access to the inputs      ing small negative outputs. As shown in (Glorot & Bengio,
after data-loading, the rule can determine if preprocessed      2010), initialization also plays a crucial role in avoiding
data has been re-sampled or not. The rule triggers if the       neuron saturation which we discuss next.
imbalance ratio is above a predefined threshold.
                                                                      Problem class         Rules
Further Debugger provides a rule to verify if data has been           Datasets              Class imbalance
correctly normalized checking for zero mean and unit vari-                                  Not normalized data
ance. In case of NLP models Debugger can check the ratio                                    Ratio of tokens in sequence
                                                                      Loss and accuracy     Loss not decreasing
of specific tokens given the rest of the input sequence which
                                                                                            Overfitting
is useful for optimizing performance.                                                       Underfitting
                                                                                            Overtraining
4.2   Activation functions                                                                  Classifier confusion
                                                                      Weights               Poor initialization
Deep neural networks consist of activation functions that                                   Updates too small
determine the output of a node given a set of inputs. This            Gradients             Vanishing
allows the network to learn non-linear mappings and with-                                   Exploding
                                                                      Tensor                All values zero
out such non-linear transformations the network would not                                   Variance of values too small
be able to perform any complex tasks (Leshno et al., 1993).                                 Values not changing across steps
Depending on the type of activation, neurons may suffer               Activation function   Tanh saturation
from saturation which means that a neuron outputs values                                    Sigmoid saturation
close to the asymptotic bounds of the function (Rakitian-                                   Dying ReLU
                                                                      Decision trees        Depth of tree too large
skaia & Engelbrecht, 2015)(Lau & Lim, 2017). This results
                                                                                            Low feature importance
in vanishing gradients leading to insignificant parameter up-
dates and preventing the model from learning. This is a well
                                                                          Table 1. Overview of existing Debugger rules
known problem for tanh and sigmoid: activation functions
that have been commonly used in the early days of deep
learning and may prevent the training of complex models to      4.3    Parameter initialization
converge.
                                                                Initialization assigns random values to parameters. If all pa-
Commonly used activation functions such as sigmoid and          rameters have the same initial value, they receive the same
ReLU can saturate. For inputs outside of the range of [-5,5]    gradient and as a consequence the model would not be able
sigmoid produces vanishing gradients. Many state of the         to learn. If parameters are initialized with too small or large
art models use ReLU activation function, which is defined       values, it may lead to vanishing or exploding gradients and
as the positive part of the argument. As the activation func-   neuron saturation (Glorot & Bengio, 2010). The goal of
tion is set to zero for negative inputs, such inputs produce    initialization is to break the symmetry such that weights
zero gradients. A model can suffer from the dying ReLU          connected to the same neuron do not have the same values
Amazon SageMaker Debugger
and can learn independently. (Glorot & Bengio, 2010) show solution. Contrarily if gradients are small but parameter
that keeping weight gradients similar across layers helps updates are large, then the learning rate is too large which
to achieve quicker training convergence. They propose a can cause the training to oscillate.
normalized initialization requiring: V ar(a|l−1| ) = V ar(al )
where l is a layer in the model and a the layer output. Debug- 4.6 Loss and accuracy
ger has a built-in rule that runs at the start of model training
and verifies that layer outputs follow the above properties. Incorrect configuration of the model training often prevents
A large difference between the variance values may indicate the training from converging. One possible scenario is for
an incorrect initialization. As this prevents convergence, De- the training loss to decrease in contrast to the validation loss
bugger can automatically stop the training, thereby saving (Lval
Ltrain ). This is a clear indication of overfitting,
time and costs. since the model works well on the data seen during training
but is unable to generalize to unseen data. If neither training
loss nor validation loss decreases then the model underfits
4.4 Gradients
the data and misses relevant relations between features and
Vanishing gradients becomes a challenge with the increase outputs. On the other hand, if both training loss and valida-
in the number of layers in a deep neural network, and can tion loss decrease but at a certain point in time validation
prevent deeper layers from learning (Hanin, 2018). Residual loss rises, then early stopping needs to be applied to prevent
connections (He et al., 2016) or BatchNorm layers (Ioffe overfitting. This can easily be automated with Debugger. If
& Szegedy, 2015) can mitigate this problem. Vanishing training loss does not decrease throughout the training, then
gradients can also be caused by activation functions such as there can be multiple reasons such as too small learning
sigmoid and tanh that saturate more quickly. Choosing an al- rate, vanishing/exploding gradients, and incorrect hyperpa-
ternate activation function such as LeakyReLu can stabilize rameters. In such cases, auto-termination is recommended
the training. Vanishing gradients is especially a problem in since continuing to train a model that is overfitting or not
recurrent neural networks, where they can prevent the net- generalizing is wasteful. Debugger provides built-in rules to
work from developing a long-term memory (Ribeiro et al., detect all the aforementioned issues. We observed that these
2020). Contrarily gradients may also explode and gradient are the most frequently used built-in rules by customers.
clipping can help to stabilize the training (Tan & Lim, 2019).
In both cases, it is wasteful to continue training when the 4.7 Decision trees
model has too small or large gradients. Debugger provides
a built-in rule to raise an alarm when statistical properties Debugger can also capture data during XGBoost model
of the gradients such as min, max, and mean deviate from training. In gradient boosting a tree with very large depth
predefined thresholds. Further, if the majority of weights may be prone to overfitting while a too shallow tree might
remain small throughout the training, it may indicate that not capture enough details and hence underfit the data. De-
the model can be pruned, which we discuss in more detail bugger provides a built-in rule that checks the depth of the
in §5. tree in every step and raises an alarm if the tree grows be-
yond a certain limit. Debugger also provides a built-in rule
to record feature importance and shows how often a feature
4.5 Optimizer settings
was used in a split. Potentially a feature may not be used
Given the gradients, the optimizer decides by how much at all if it has low variance or if it is highly correlated with
the parameters are updated. In addition to the learning another feature. In several customer use-cases, Debugger
rate which is given as input to the optimizer, parameters was used to auto-terminate XGBoost training jobs if a small
such as momentum, learning rate decay, and weight decay subset of features held the majority of weights in the model.
could be provided to stabilize the model training. These
values need to be carefully chosen to avoid issues such as 5 D EPLOYMENT R ESULTS AND I NSIGHTS
vanishing or exploding gradients and the training simply
not converging. While Debugger does not currently store Debugger has helped numerous customers to find training
optimizer settings, one can capture gradients and weights issues, from which we highlight a few use cases. As dis-
of consecutive steps. The weight updates can be defined cussed in §1, Debugger can be used to analyze and visualize
as: Wi − Wi+1 where i is the step number. Comparing the tensors in real-time from within a notebook and the analysis
weight updates with the gradients δi for step i can reveal can easily be modified while the training is still in progress.
issues with optimizer settings. For instance, in the beginning
Optimizing visual search model - a customer story: In
of the training gradients are typically large, but if parameter
one customer project the real-time analysis gave signifi-
updates are small then it may indicate that either the learning
cant insights (Carlson et al., 2020). The customer had been
rate is too small or weight decay is too large. As a result, the
training an auto-encoder model consisting of several convo-
training may not converge or may get stuck in a non-optimalAmazon SageMaker Debugger
lutional and deconvolutional layers, and a bottleneck layer. is fine-tuned so that it can recover from pruning and re-gain
An auto-encoder learns a compressed representation of the accuracy. Fig. 3 shows that model parameters were reduced
input data and then attempts to reconstruct the original in- from 11 to 2.5 million. Accuracy drops after 8 iterations:
put as closely as possible. The customer observed that the the custom Debugger rule terminates the experiment and
loss itself was not a good indicator of whether the model prevents the execution of jobs that would otherwise produce
had learnt meaningful representations. They often noticed low quality models.
that the model produced blurry output images despite the
loss having converged. By monitoring the latent space and 1
t-SNE embeddings, they were able spot this issue much
Validation accuracy
0.8
earlier. By using Debugger they were able to monitor gradi-
ents and activation outputs in real-time and create their own 0.6
custom real-time visualization for the latent space. This
0.4 Custom rule detects
analysis revealed that the model suffered from vanishing drop in accuracy and
gradients and also that most neurons in the bottleneck layer 0.2 terminates pruning
experiment
were inactive. Based on these observations they decided
0
to change the model architecture. By using the Debugger
M
M
M
M
M
M
M
M
M
k
0
built-in rules and auto-terminating feature, they were able to
8
.1
5
2
0
8
2
5
1
26
9.
8.
7.
6.
4.
3.
2.
1.
11
perform a large parameter sweep to create different model Number of parameters
configurations and get a more optimal model in a shorter
amount of time and with reduced costs. Their final model Figure 3. Iterative model pruning of a ResNet18 model. Debug-
was 45% smaller in disk size and performed 33% less GPU ger is used to compute filter ranks and to terminate the pruning
operations. experiment via a custom rule that triggers when accuracy drops.
Using Debugger for iterative model pruning: Based on
these results numerous customers expressed interest in Model understanding with Debugger: As discussed in §2
achieving similar model size reductions. As state of the art debugging a model extends beyond just making the model
models are growing in size and the number of parameters, training converge. Quite commonly one wants to understand
model pruning is becoming increasingly more important. what the model has learned, for example, to determine if
Pruning aims to remove the non important weights without there is bias in the training data or to detect undesirable
reducing accuracy. Many types of pruning techniques are model behavior. Based on customer requests, we created
known, for example, structured versus unstructured prun- several end-to-end analysis workflows on top of Debugger
ing, randomly removing weights versus removing by size or specifically for debugging NLP or CV models. For instance,
rank, and iterative pruning versus one-shot pruning (Blalock monitoring attention scores in transformer models across
et al., 2018). In case of CNNs, iterative filter pruning is heads and layers helps to get a better understanding of the
known to achieve state of the art results (You et al., 2019) relationships between sentences (Vig, 2019) (Clark et al.,
(Li et al., 2017) (Molchanov et al., 2017). 2019). We have created a similar interface as (Clark et al.,
2019) on top of Debugger which provides the flexibility to
Pruning helps to avoid overfitting and results in smaller
visualize transformer models without having to modify the
models which tend to be more robust. While designing and
model. Users can just plug in their own custom transformer
developing Debugger, we had not anticipated that it could
model written in their framework of choice.
also be used as a core component within a model pruning
workflow. Considering the subsequent customer interest, we In the case of CV models, we created an end-to-end analysis
have developed an end-to-end workflow for iterative model workflow that generates saliency maps highlighting class
pruning of ResNet models (He et al., 2016) that leverages discriminative features of the input (Fig. 8) (Rauschmayr
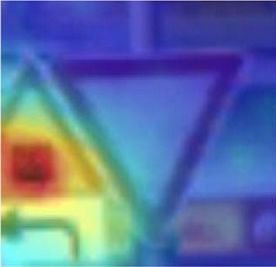
Debugger in two ways (Rauschmayr et al., 2020c): et al., 2020b). Saliency maps typically require the gradients
of the outputs with respect to the inputs or feature maps. In
1. capturing feature maps, to identify the weights to prune this workflow Debugger is used in combination with Sage-
Maker Model Monitor9 . Model Monitor captures inference
2. auto-terminating training jobs via a custom rule if the requests and predictions of the models hosted on SageMaker
desired minimum model size is reached or if the valida- and raises an alarm if data drift is detected. Once an alarm
tion accuracy drops below a predetermined threshold. is raised, our workflow automatically enables Debugger to
capture relevant tensors and compute saliency maps for in-
coming requests. We discuss saliency maps further in the
Fig. 3 shows the pruning experiment of a ResNet18 model
next section.
trained on Caltech101 dataset: in each of the 10 pruning
9
iterations the 100 smallest filters are removed and the model https://aws.amazon.com/sagemaker/model-monitorAmazon SageMaker Debugger
2 model trained for 10 epochs and reached a final test accuracy
Slowdown relative to baseline saving all tensors
1.8 saving all weights of 90.6%. We use Debugger to investigate what caused these
saving inputs/outputs two rules to trigger. With just a few lines of codes one can
1.6
retrieve and visualize the loss values while training is still
1.4 in progress.
1.2 1 loss = "CrossEntropyLoss_output"
2 losses = trial.tensor(loss).values()
1
10 100 200 300 400 500
Save interval - steps
4 without auto-termination
with auto-termination
Figure 4. Performance impact in a ResNet18 model training: sav-
Train Loss
ing all tensors versus saving only weights and model inputs/outputs
2
6 C ASE S TUDY
While we demonstrated the benefit of Debugger via dif- 0
ferent customer use case examples in §5, we next provide 0 500 1,000 1,500 2,000 2,500 3,000 3,500 4,000 4,500
a case study using a publicly available dataset and model Steps
(Rauschmayr et al., 2020a). Our goal is to examine how
Debugger can simplify and accelerate model development Figure 5. Training with and without Debugger auto-termination
and find critical model bugs throughout the ML lifecycle.
For this purpose, we use code from a GitHub repository that Fig. 5 (blue curve) demonstrates that the default training
fine-tunes a ResNet18 model on the German Traffic Sign configuration ran the training for too long. Instead of train-
dataset (Stallkamp et al., 2012) using PyTorch. ing for 4000 steps, early-stopping should have been applied
after 1000 iterations. As discussed in §3.5, we can enable
6.1 Performance Impact of Data Collection the auto-termination feature of Debugger and stop the train-
ing after a rule triggers. In this example, doing so reduces
First we study the performance impact of Debugger. As
compute time by more than half (red line).
described in §3.3, users can specify custom collections of
tensors to be emitted. For demonstration purposes, we de- To investigate the class imbalance issue, we retrieve the
fine a collection where all tensors are saved. The perfor- inputs into the loss function. The following line returns the
mance penalty is mainly a trade-off between the size of the labels for the last validation step.
tensors to store and the save interval. In the worst
case it can record each tensor of the model in every step. 1 steps = trial.steps(mode=modes.EVAL)
2
We fine-tune the ResNet18 model on a p3.2xlarge instance. 3 labels = "CrossEntropyLoss_input_0"
Fig. 4 shows that the slowdown remains under 1.2 with a 4 trial.tensor(labels).value(steps[-1])
save interval above 200 steps. Saving tensors every
10 steps slowed down the benchmark training job by a factor We can then inspect the number of class instances the model
1.9 when all tensors were saved and by a factor 1.1 when was trained on. As shown in Fig. 6, there is a high imbalance
only weights were saved. For the remaining experiments, and several classes have less than a hundred instances. To fix
we mainly analyze the model inputs and outputs. The perfor- this, we change the default configuration of the dataloaders
mance impact for collecting these data is minimal (Fig. 4). to take the class weights into account and to draw more
Debugger provides different options to tune the data collec- samples from classes with smaller weights.
tion, for instance users can create custom collections and
specify different save intervals for each of them or compute
Number of samples
aggregates before data is saved. Further benchmark num- 600
bers for different frameworks and different state of the art 400
CV and NLP models can be found in the appendix.
200
6.2 Training with Built-in Rules 0
After the collections are defined, we run the training with 0 5 10 15 20 25 30 35 40
Classes
several Debugger built-in rules enabled. Out of those loss-
not-decreasing and class-imbalance rules triggered. The
Figure 6. Number of class samples during trainingAmazon SageMaker Debugger
To find out how to further increase test accuracy, we in- follows:
vestigate the examples upon which the model made false
predictions. We iterate over the predictions and model in- 1 g = trial.tensor_names(regex=".*gradient")
2 b = trial.tensor_names(regex=".*bias")
puts saved by Debugger and simply select those where the 3
label and prediction do not match: 4 for gradient, bias in zip(g, b):
5 trial.tensor(gradient).value(0)
1 labels = "CrossEntropyLoss_input_0" 6 trial.tensor(bias).value(0)
2 predictions = "CrossEntropyLoss_input_1"
3 inputs = "ResNet_input_0" Fig. 8 shows the saliency maps for our model for two
4
5 for step in trial.steps(): example inputs that were incorrectly predicted: red pixels
6 indicate where the model is paying attention to and we infer
7 l = trial.tensor(labels).value(step) that the model does not take all features of the inputs into
8 p = trial.tensor(predictions).value(step) account.
9 i = trial.tensor(inputs).value(step)
10 While this section just showcases one example application,
11 for prediction, label, img in zip(p,l,i): it demonstrates the power of Debugger. With the existing
12 if prediction != label: built-in rules users can automatically identify issues while
13 plt.imshow(img)
the training is in progress and with just a few lines of code
users can inspect the model and find critical bugs. Further,
Fig. 7 shows the result of above code segment. The analysis
users running on Amazon SageMaker run built-in rules free
reveals that the model is often confused about traffic signs
of charge so there is no additional cost for using Debugger.
that involve a direction. Clearly this is a severe model bug
despite the model achieving a reasonable test accuracy of
90.6%. We then identified the root cause to be the data
augmentation pipeline that performs a random rotation on
the training data.
Predicted: “Stop” Predicted: “Stop”
Figure 8. Using Debugger to compute saliency maps
Predicted: “Danger- Predicted: “Keep Predicted: “Turn 7 R ELATED W ORK
ous curve to the right” left ahead”
left” Groundtruth: Groundtruth: “Turn We give an overview of existing debugging and visualiza-
Groundtruth: “Dan- “Keep left” right ahead” tion tools for ML. As discussed in (Sculley et al., 2015)
gerous curve to the
right” maintaining real-world ML systems is difficult and expen-
sive because such systems may have traditional code but
Figure 7. Inspecting incorrect predictions with Debugger also ML-specific issues. In the past years, researchers pro-
posed various methods to address the debugging problem in
the ML lifecycle (Cadamuro & Gilad-Bachrach, 2016) (Ma
6.3 Debugger for Explainability
et al., 2018) (Chakarov et al., 2016) (Zhang et al., 2018)
After fixing the training script, we create the final model, (Koh & Liang, 2017) (Kang et al., 2018) (Li et al., 2019)
that is going to be deployed for production. As discussed (Wexler et al., 2020). (Cadamuro & Gilad-Bachrach, 2016)
in §2, debugging at this stage should help to understand develop a framework that given an incorrect model predic-
unexpected model behavior, if, for instance, data drift oc- tion scans the training data and finds a set of items that needs
curs. As described in §5, we developed an end-to-end anal- to be altered to mitigate the test errors. Similarly (Ma et al.,
ysis analysis workflow that computes saliency maps based 2018) propose a technique for conducting state differential
on the FullGrad method (Srinivas & Fleuret, 2019). This analysis to identify neurons that are responsible for mis-
method requires bias and gradients of the outputs with re- classification and then perform training input selection to
spect to the intermediate activations. The product of both, mitigate the issues. (Koh & Liang, 2017) tackle the problem
the bias·gradients, is accumulated for each layer. With De- of debugging and understanding incorrect predictions with
bugger these tensors can automatically be retrieved. For our influence functions that indicate how the model parameters
example application we retrieve all bias and gradients as change as a certain training point is up-weighted by an in-Amazon SageMaker Debugger
finitesimal amount. (Zhang et al., 2018) propose a novel and retrieve tensors. For example, if the user wants to get
algorithm to detect both outliers and incorrect items in the data from the second layer instead of the first layer, then
training data. While the aforementioned techniques are very this usually requires to the training to be interrupted and
relevant to detect problems and to improve model accuracy, the configuration to be manually updated. In Debugger,
they are limited to a part of the problem: detecting data with just one line of code, users can enable data collection
related issues such as mislabeled training data. (Kang et al., of tensors from all layers without modifying the training
2018) adapt program assertions for machine learning models script itself. Users can visualize and analyze the data in
to ensure that model outputs are consistent. These assertions any form and change it while the training is still in progress.
are implemented as user-defined callbacks, and are similar Users can also easily analyze and compare Debugger data
to Debugger rules. However, in contrast to Debugger, these across different training jobs. 2) Automatic error detection
assertions only run on model inputs and outputs. is needed in many use cases, for instance, when performing
a parameter sweep with hundreds of training jobs. Debugger
As part of the debugging process, one may make use of
introduces the concept of rules that allows users to automat-
visualization and monitoring tools to get visual insights
ically capture issues and to auto-terminate training jobs,
into the model training. TensorBoard is a very popular
therefore saving compute cost and time. The rule analysis
tool used to track and visualize metrics and model graphs
is offloaded to separate instances, thereby not impacting the
during training (Abadi et al., 2016). Furthermore it can
training and enabling the execution of compute-intensive
display histograms of weights, biases, and model inputs
analysis at scale. Further smdebug and SageMaker De-
such as images and text. Prior to training one must specify
bugger are designed to be extensible, so that existing and
which data should be saved and the training script needs to
future advances in tensor analysis and visualizations can be
be adjusted accordingly. Since TensorBoard 2.3 users can
supported. This flexible design allows users to customize
also access logs via DataFrames, which is however limited
Debugger for their specific needs.
to scalar values. TensorBoard itself is tied to TensorFlow,
however other frameworks such as MXNet and PyTorch
have adopted it and provide custom extensions on top of 8 C ONCLUSION
TensorBoard.
We presented Amazon SageMaker Debugger, a framework-
Weights & Biases is a flexible and lightweight toolset agnostic system to collect, query, and analyze data from
(Biewald, 2020) that requires only a few lines of code to ML model training and to automatically capture issues in
enable data collection. A background process uploads the real-time using a rich set of built-in rules. We described the
data to the cloud where users can create dashboards and design and architecture of Debugger, including its use either
other types of visualizations. It supports frameworks such as a stand-alone open source library or as a scalable and
as TensorFlow, Keras, PyTorch, scikit-learn, and XGBoost. fully managed service, integrated with Amazon SageMaker.
Weights & Biases supports experiment tracking, logging By presenting deployment results, customer use cases, and a
hyperparameters, and other metrics which can be exported case study on a publicly available dataset, we demonstrated
via CSV files. that the real-time insights provided by Debugger can help to
significantly reduce both development time and cost by find-
TensorWatch is an opensource tool for real-time interactive
ing issues early and auto-terminating problematic training
analysis of deep learning training (Shah et al., 2019). It lever-
jobs. Debugging and monitoring of ML model training is a
ages Jupyter notebooks to visualize data in different forms
ripe area for further research. Instead of limiting ourselves
and supports data streaming and map-reduce style queries.
to identification of issues during training, we could proac-
TensorWatch allows users to create arbitrary streams dynam-
tively anticipate issues during training and apply corrective
ically wherein the training does not have to be stopped and
measures to recover from them. We could also provide
restarted in order to change the data collection.
semantic insights such as global explanation, consistency,
Debugger has a lot in common with the aforementioned robustness, failure modes, and other characteristics of the
tools, such as supporting multiple frameworks and enabling model being trained, and their evolution over time.
data collections with just a few lines of code. In contrast to
TensorBoard and Weights & Biases, smdebug reads tensors R EFERENCES
as NumPy arrays allowing users to quickly analyze and
visualize the data. Since the data is stored in Amazon S3 Abadi, M., Agarwal, A., Barham, P., Brevdo, E., Chen, Z.,
in real-time, the risk of running out of disk space during Citro, C., Corrado, G. S., Davis, A., Dean, J., Devin, M.,
training is minimal. Ghemawat, S., Goodfellow, I. J., Harp, A., Irving, G.,
Isard, M., Jia, Y., Józefowicz, R., Kaiser, L., Kudlur, M.,
Compared to existing tools, two key novel aspects of De- Levenberg, J., Mané, D., Monga, R., Moore, S., Mur-
bugger are as follows: 1) a more flexible API to record ray, D. G., Olah, C., Schuster, M., Shlens, J., Steiner,Amazon SageMaker Debugger
B., Sutskever, I., Talwar, K., Tucker, P. A., Vanhoucke, International Conference on Artificial Intelligence and
V., Vasudevan, V., Viégas, F. B., Vinyals, O., Warden, P., Statistics (AISTATS), pp. 315–323, 2011.
Wattenberg, M., Wicke, M., Yu, Y., and Zheng, X. Ten-
sorFlow: A system for large-scale machine learning. In Guo, X., Yin, Y., Dong, C., Yang, G., and Zhou, G. On the
12th USENIX Symposium on Operating Systems Design class imbalance problem. In 2008 Fourth International
and Implementation (OSDI), pp. 265–283, 2016. Conference on Natural Computation, volume 4, pp. 192–
201, 2008.
Biewald, L. Experiment tracking with weights and biases,
2020. URL https://www.wandb.com/. Software Hanin, B. Which neural net architectures give rise to ex-
available from wandb.com. ploding and vanishing gradients? In Advances in Neural
Information Processing Systems, pp. 582—591. 2018.
Blalock, D. W., Ortiz, J. J. G., Frankle, J., and Guttag,
J. What is the state of neural network pruning? In He, K., Zhang, X., Ren, S., and Sun, J. Deep residual
Proceedings of Machine Learning and Systems (MLSys), learning for image recognition. In IEEE Conference on
2018. Computer Vision and Pattern Recognition (CVPR), pp.
770–778, 2016.
Buda, M., Maki, A., and Mazurowski, M. A. A systematic
study of the class imbalance problem in convolutional Ioffe, S. and Szegedy, C. Batch normalization: Accelerating
neural networks. Neural Networks, 106:249 – 259, 2018. deep network training by reducing internal covariate shift.
ISSN 0893-6080. doi: https://doi.org/10.1016/j.neunet. In International Conference on Machine Learning, pp.
2018.07.011. 448–456, 2015.
Cadamuro, G. and Gilad-Bachrach, R. Debugging machine Japkowicz, N. and Stephen, S. The class imbalance prob-
learning models. 2016. CHI Workshop on Human Cen- lem: A systematic study. Intelligent Data Analysis, pp.
tred Machine Learning. 429—449, 2002.
Carlson, A., Rauschmayr, N., Jetly, N., and Bhat- Johnson, M. J. and Khoshgoftaar, M. T. Survey on deep
tacharjee, S. Autodesk optimizes visual similarity learning with class imbalance. In Journal of Big Data,
search model in Fusion 360 with Amazon SageMaker pp. 2196–1115, 2019.
Debugger. https://aws.amazon.com/blogs/machine-
Kang, D., Raghavan, D., Bailis, P., and Zaharia, M. Model
learning/autodesk-optimizes-visual-similarity-search-
assertions for monitoring and improving ML models. In
model-in-fusion-360-with-amazon-sagemaker-
Proceedings of Machine Learning and Systems 2 (MLSys
debugger, 2020. AWS Machine Learning Blog.
2018), 2018.
Chakarov, A., Nori, A., Rajamani, S., Sen, S., and Vijay-
Koh, P. W. and Liang, P. Understanding black-box predic-
keerthy, D. Debugging machine learning tasks. arXiv
tions via influence functions. In International Conference
preprint arXiv:1603.07292, 2016.
on Machine Learning, pp. 1885–1894, 2017.
Chen, T., Li, M., Li, Y., Lin, M., Wang, N., Wang, M., Xiao,
T., Xu, B., Zhang, C., and Zhang, Z. MXNet: A flexible Lau, M. M. and Lim, K. H. Investigation of activation
and efficient machine learning library for heterogeneous functions in deep belief network. In 2017 2nd Interna-
distributed systems. In Neural Information Processing tional Conference on Control and Robotics Engineering
Systems, Workshop on Machine Learning Systems, 2015. (ICCRE), pp. 201–206, 2017.
Chollet, F. et al. Keras, 2015. URL https://github. Leshno, M., Lin, V. Y., Pinkus, A., and Schocken, S. Mul-
com/fchollet/keras. tilayer feedforward networks with a nonpolynomial ac-
tivation function can approximate any function. Neural
Clark, K., Khandelwal, U., Levy, O., and Manning, C. D. Networks, 6(6):861 – 867, 1993. ISSN 0893-6080. doi:
What does BERT look at? An analysis of BERT’s atten- https://doi.org/10.1016/S0893-6080(05)80131-5.
tion. In BlackBoxNLP@ACL, 2019.
Li, H., Kadav, A., Durdanovic, I., Samet, H., and Graf, H. P.
Glorot, X. and Bengio, Y. Understanding the difficulty Pruning filters for efficient ConvNets. In 5th International
of training deep feedforward neural networks. In Pro- Conference on Learning Representations (ICLR), 2017.
ceedings of the International Conference on Artificial
Intelligence and Statistics (AISTATS), 2010. Li, L., Bai, Y., and Wang, Y. Manifold: A model-agnostic
visual debugging tool for machine learning at Uber. In
Glorot, X., Bordes, A., and Bengio, Y. Deep sparse recti- USENIX Conference on Operational Machine Learning
fier neural networks. In Proceedings of the Fourteenth (OpML), 2019.Amazon SageMaker Debugger
Liberty, E., Karnin, Z., Xiang, B., Rouesnel, L., Coskun, B., SageMaker Debugger and Amazon SageMaker
Nallapati, R., Delgado, J., Sadoughi, A., Astashonok, Y., Experiments. https://aws.amazon.com/blogs/machine-
Das, P., Balioglu, C., Chakravarty, S., Jha, M., Gautier, learning/pruning-machine-learning-models-with-
P., Arpin, D., Januschowski, T., Flunkert, V., Wang, Y., amazon-sagemaker-debugger-and-amazon-sagemaker-
Gasthaus, J., Stella, L., Rangapuram, S., Salinas, D., experiments, 2020c. AWS Machine Learning Blog.
Schelter, S., and Smola, A. Elastic machine learning
algorithms in Amazon SageMaker. In Proceedings of the Ribeiro, A. H., Tiels, K., Aguirre, L. A., and Schön, T. Be-
ACM SIGMOD International Conference on Management yond exploding and vanishing gradients: Analysing RNN
of Data, pp. 731–737, 2020. training using attractors and smoothness. In Proceedings
of the Twenty Third International Conference on Artificial
Lu, L., Shin, Y., Su, Y., and Karniadakis, G. E. Dying Intelligence and Statistics (AISTATS), pp. 2370—2380,
ReLU and initialization: Theory and numerical examples. 2020.
CoRR, abs/1903.06733, 2019.
Sculley, D., Holt, G., Golovin, D., Davydov, E., Phillips, T.,
Ma, S., Liu, Y., Lee, W., Zhang, X., and Grama, A. MODE: Ebner, D., Chaudhary, V., Young, M., Crespo, J.-F., and
Automated neural network model debugging via state Dennison, D. Hidden technical debt in machine learning
differential analysis and input selection. Proceedings of systems. In Advances in Neural Information Processing
the 26th ACM Joint Meeting on European Software Engi- Systems, pp. 2503–2511, 2015.
neering Conference and Symposium on the Foundations
Shah, S., Fernandez, R., and Drucker, S. M. A system for
of Software Engineering, 2018.
real-time interactive analysis of deep learning training.
Molchanov, P., Tyree, S., Karras, T., Aila, T., and Kautz, In Proceedings of the ACM SIGCHI Symposium on Engi-
J. Pruning convolutional neural networks for resource neering Interactive Computing Systems (EICS), 2019.
efficient inference. In 5th International Conference on
Srinivas, S. and Fleuret, F. Full-gradient representation
Learning Representations (ICLR), 2017.
for neural network visualization. In Advances in Neural
Paszke, A., Gross, S., Massa, F., Lerer, A., Bradbury, J., Information Processing Systems, pp. 4124–4133. 2019.
Chanan, G., Killeen, T., Lin, Z., Gimelshein, N., Antiga,
Stallkamp, J., Schlipsing, M., Salmen, J., and Igel, C. Man
L., Desmaison, A., Kopf, A., Yang, E., DeVito, Z., Raison,
vs. computer: Benchmarking machine learning algo-
M., Tejani, A., Chilamkurthy, S., Steiner, B., Fang, L.,
rithms for traffic sign recognition. Neural networks, 32:
Bai, J., and Chintala, S. PyTorch: An imperative style,
323–332, 2012.
high-performance deep learning library. In Advances in
Neural Information Processing Systems, 2019. Strubell, E., Ganesh, A., and McCallum, A. Energy and
policy considerations for modern deep learning research.
Rakitianskaia, A. and Engelbrecht, A. Measuring saturation
In Proceedings of the AAAI Conference on Artificial In-
in neural networks. In 2015 IEEE Symposium Series on
telligence, pp. 13693–13696, 2020.
Computational Intelligence, pp. 1423–1430, 2015.
Tan, H. H. and Lim, K. H. Vanishing gradient mitigation
Rauschmayr, N., Huang, L., and Bhattacharjee, S.
with deep learning neural network optimization. In 7th
Detecting hidden but non-trivial problems in trans-
International Conference on Smart Computing Communi-
fer learning models using Amazon SageMaker
cations (ICSCC), pp. 1–4, 2019.
Debugger. https://aws.amazon.com/blogs/machine-
learning/detecting-hidden-but-non-trivial-problems- Vig, J. Visualizing attention in transformer-based language
in-transfer-learning-models-using-amazon-sagemaker- representation models. arXiv preprint arXiv:1904.02679,
debugger, 2020a. AWS Machine Learning Blog. 2019.
Rauschmayr, N., Kumar, V., and Bhattacharjee, S. Wexler, J., Pushkarna, M., Bolukbasi, T., Wattenberg, M.,
Detecting and analyzing incorrect model predic- Viégas, F., and Wilson, J. The What-If tool: Interactive
tions with Amazon SageMaker Model Monitor and probing of machine learning models. IEEE Transactions
Debugger. https://aws.amazon.com/blogs/machine- on Visualization and Computer Graphics, 26(1):56–65,
learning/detecting-and-analyzing-incorrect-model- 2020.
predictions-with-amazon-sagemaker-model-monitor-
and-debugger, 2020b. AWS Machine Learning Xin, D., Ma, L., Song, S., and Parameswaran, A. G. How
Blog. developers iterate on machine learning workflows - A
survey of the applied machine learning literature. In
Rauschmayr, N., Simon, J., and Bhattacharjee, S. KDD Interactive Data Exploration and Analytics (IDEA)
Pruning machine learning models with Amazon Workshop, 2018.Amazon SageMaker Debugger
You, Z., Yan, K., Ye, J., Ma, M., and Wang, P. Gate deco- the weights at different intervals. With a save interval
rator: Global filter pruning method for accelerating deep of 10 steps slowdown is below 1.5 and much lower com-
convolutional neural networks. In Advances in Neural pared to the TensorFlow benchmark. The difference can be
Information Processing Systems, pp. 2133–2144. 2019. explained with single versus multi-GPU training. In case of
TensorFlow benchmark more data was saved from multiple
Zhang, X., Zhu, X., and Wright, S. J. Training set debugging GPUs.
using trusted items. In McIlraith, S. A. and Weinberger,
K. Q. (eds.), Proceedings of the Thirty-Second AAAI Con- 3
saving all weights
Relative increase in runtime
ference on Artificial Intelligence, pp. 4482–4489, 2018.
2.5
A A DDITIONAL B ENCHMARK FOR CV 2
AND NLP M ODELS
This section studies the performance impact of smdebug 1.5
on the model training using example state of the art model
for CV and NLP. The first benchmark is training a Ten- 1
10 100 200 300 400 500
sorflow ResNet50 model on 4 GPUs (p3.16xlarge) using
Save interval - steps
Tensorflow’s MirroredStrategy. As discussed in section 3.3
a collection specifies a list of tensors that are saved at a
Figure 10. Performance impact in a BERT model training: saving
specific interval or step. For demonstration purposes, we
weights
define the following custom collection:
1 CollectionConfig(
2 name="all",
3 parameters={
4 "include_regex": ".*",
5 "save_interval": 100
6 })
This configuration stores tensors including gradients,
weights, biases, outputs and inputs. Fig. 9 shows that
the slowdown remains under 1.2 with a save interval
above 200 steps. Saving tensors every 10 steps slowed down
the benchmark training job by a factor 2.5 when all tensors
were saved and by a factor 1.6 when only weights were
saved.
3
Slowdown relative to baseline
saving all tensors
saving all weights
2.5
2
1.5
1
10 100 200 300 400 500
Save interval - steps
Figure 9. Performance impact in a ResNet50 model training: sav-
ing all tensors versus saving only weights
Fig. 10 shows the slowdown in training an MXNet BERT
large model on the Stanford Question Answering dataset on
1 GPU (p3.2xlarge instance). The benchmark stores onlyYou can also read


