E-book Pricing and Vertical Restraints - Babur De los Santos Matthijs R. Wildenbeest December 2014
←
→
Page content transcription
If your browser does not render page correctly, please read the page content below
E-book Pricing and Vertical Restraints∗
                                          Babur De los Santos†
                                         Matthijs R. Wildenbeest‡

                                               December 2014

                                                   Abstract
          This paper empirically analyzes how the use of vertical price restraints has impacted retail
      prices in the market for e-books. In 2010 five of the six largest publishers simultaneously
      adopted the agency model of book sales, allowing them to directly set retail prices. This led
      the Department of Justice to file suit against the publishers in 2012, the settlement of which
      prevents the publishers from interfering with retailers’ ability to set e-book prices. Using a
      unique dataset of daily e-book prices for a large sample of books across major online retailers,
      we exploit cross-publisher variation in the timing of the return to the wholesale model to estimate
      its effect on retail prices. We find that e-book prices for titles that were previously sold using
      the agency model decreased by 18 percent at Amazon and 8 percent at Barnes & Noble. Our
      results are robust to different specifications, placebo tests, and synthetic control groups. Our
      findings illustrate a case where upstream firms prefer to set higher retail prices than retailers
      and help to clarify conflicting theoretical predictions on agency versus wholesale models.
      Keywords: e-books, agency, vertical restraints, most favored nation, media economics, resale
      price maintenance, Amazon

      JEL Classification: D43, L41, L42

   ∗
     We thank Tobias Klein, Daniel O’Brien, and Arun Sundararajan for their useful comments and suggestions. This
paper has also benefited from presentations at the CPB Workshop on Internet Economics and Privacy in The Hague,
the 2014 NBER Summer Institute, and DePaul University. We gratefully acknowledge financial support by the NET
Institute, http://www.NETinst.org.
   †
     Kelley School of Business, Indiana University, E-mail: babur@indiana.edu.
   ‡
     Kelley School of Business, Indiana University, E-mail: mwildenb@indiana.edu.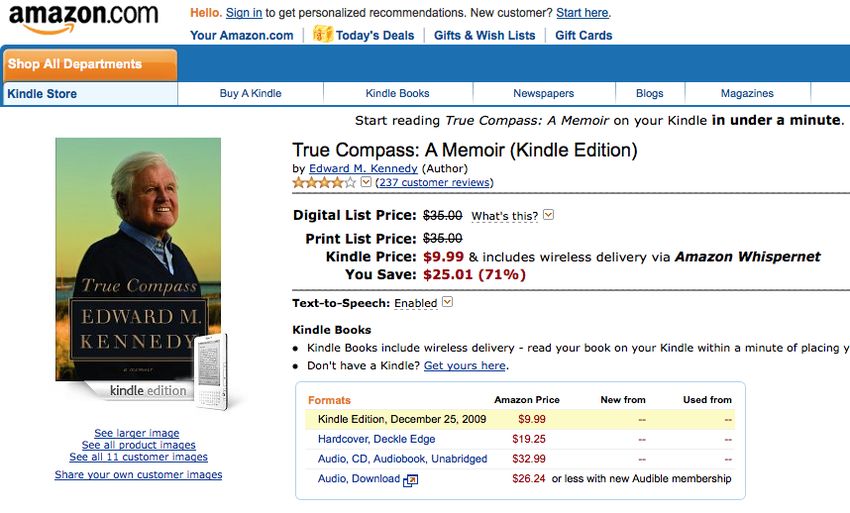
1        Introduction

In April 2012 the Department of Justice (DOJ) sued Apple and five of the six largest U.S. book
publishers for conspiring to raise e-book prices. The lawsuit was prompted by the publishers’
switch from the wholesale model of selling e-books to the agency model two years prior. Under the
wholesale model publishers sell e-books to retailers at a wholesale price and retailers set the retail
price at which they sell e-books to the consumer. In contrast, the agency model gives publishers
the ability to directly set retail prices. The retailer merely acts as an agent for the publisher and
receives a commission for every e-book sold.
        The adoption of the agency model reflects the tension between upstream firms and downstream
firms with regard to who is in control of retail prices. In the textbook example of the double
marginalization problem, which arises because upstream firms prefer lower retail prices than down-
stream firms, vertical price restraints can be used to force downstream firms to set lower retail
prices than they otherwise would (Spengler, 1950; Mathewson and Winter, 1984). In this particu-
lar case the publishers adopted the agency model to do exactly the opposite: to set higher e-book
retail prices. Publishers believed that the low e-book prices set by retailers before the adoption of
the agency model, particularly Amazon’s $9.99 pricing for new releases, were eroding consumers’
perception of the value of books, cannibalized hardcover sales, and would eventually lead to a
downward pressure on wholesale prices. The agency model seems to have succeeded in at least
some of these regards. In the year after its adoption, prices for New York Times best sellers rose
by more than 40 percent, which led in part to the DOJ lawsuit.1 Three of the publishers settled
shortly after the antitrust case was filed, while the other two followed later the same year.2 As part
of the settlements, the five publishers cannot restrict a retailer’s ability to set e-book prices for a
period of two years, which effectively meant a return to the wholesale model, although with some
modifications.3
        In this paper we estimate differences in retail prices under the agency and wholesale model, by
exploiting the switch from the agency model around the time each of the publishers settled with
    1
     DOJ Complaint, U.S. v. Apple, Inc., et al., April 11, 2012. According to this complaint, “defendants’ conspiracy
and agreement to raise and stabilize retail e-book prices by collectively adopting the agency model [. . . ] led to an
increase in the retail prices of newly released and bestselling e-books.”
   2
     Apple did go to court and lost, although it is appealing the decision at the time of writing.
   3
     Although this new model is dubbed modified or revised agency model by the industry, we refer to it as a modified
wholesale model, since the defining element of the agency model—resale price maintenance—is no longer present.
The settlements still refer to this pricing agreement as an agency model as publishers are allowed to set a list price
for a title and retailers are permitted to set retail prices. The only allowed restriction was that a retailer’s aggregate
discounts—retail prices below list price—for a given publisher’s titles could not exceed the aggregate commission
received from the publisher.

                                                            2
the DOJ. In the next section we discuss recent developments in the book industry that led to the
adoption of the agency model, its effects on prices leading to the DOJ complaint, its settlement,
and the subsequent switch to the modified wholesale model. In Section 3 we describe our unique
dataset, which contains daily e-book prices for more than 2,000 current and former New York Times
best sellers sold by the major e-book retailers in the United States for a period of two years. Our
sample begins in January 2012, which predates the finalization of the first settlement by about nine
months, and ends in December 2013, more than three months after the last settlement. The data
include titles issued by the publishers that were part of the lawsuit, as well as titles issued by other
publishers.
Several recent theoretical papers have analyzed differences in retail prices between the agency
and wholesale models. One strand of the literature argues that even though prices may initially
be higher under the agency model, in the long run consumers are likely to be worse off under the
wholesale model than under the agency model. For instance, Johnson (2013) argues that retailers
who use the wholesale model will initially set low prices to lock in consumers, but find it optimal
to raise prices in the long run once sufficiently many consumers are locked in. Under the agency
model, on the other hand, publishers sell to multiple retailers and thus do not face such incentives,
which fosters direct retail competition between publishers and therefore low prices in the long run.
Similarly, Gaudin and White (2014) point out that a retailer’s incentive to set low prices is larger
when e-books can only be read through the retailer’s proprietary reader, as was the case when
e-books purchased from Amazon could only be read on a Kindle device. However, Gaudin and
White argue that the switch to the agency model coincided with Amazon’s release of Kindle apps
for other platforms (most importantly Apple’s iPad) and hence greatly reduced Amazon’s incentive
to keep retail prices low under the wholesale model.
Another strand of the literature argues that consumers are likely to be better off when retail
prices are set according to the wholesale model. Foros, Kind, and Shaffer (2014) argue that the
structure of the e-book market is such that retail prices will be higher when agency contracts
are used. More specifically, they find that if competition is stronger among retailers than among
manufacturers, as they argue is the case in the market for e-books, publishers will set higher retail
prices than retailers would set if they were in control. This means that if the retailers’ goal is to
increase prices then price control should be given to the level in the distribution channel that faces
the least competitive pressure, as is the case in the agency model.
Our empirical approach sheds light on the conflicting findings of the aforementioned theoretical
3papers as well as recent theoretical papers that considered the relationship between agency and
wholesale models in related settings (Gans, 2012; Abhishek, Jerath, and Zhang, 2013; Condorelli,
Galeotti, and Skreta, 2013; Johnson, 2014). Gans (2012) focuses on the pricing of mobile appli-
cations on platforms and finds that a hold up problem may arise if consumers have to purchase
a device to access the platform. However, restrictions on pricing, such as a most favored nation
(MFN) clause, may help overcome the hold up problem. Abhishek, Jerath, and Zhang (2013) find
that the agency model leads to lower retail prices, although retail prices may be higher under the
agency model if there are positive externalities from sales of complementary products (such as
e-readers in the case of e-books). Finally, Condorelli, Galeotti, and Skreta (2013) let the decision
whether to use agency or wholesale models be endogenous in an environment where the retailer
has privileged information about consumers’ valuations and show that retailers prefer the agency
model.
In Section 4 we present our estimation strategy, which uses cross-publisher variation in the
timing of the switch to estimate the difference in retail prices under the two selling models. Both
variation in the decision to settle the lawsuit and variation in the time it took to renegotiate
contracts between publishers and retailers after the settlement led to substantial variation in the
timing of the switch: the first publisher made the switch to the wholesale model in September
2012, whereas the last publisher did so in September 2013. We employ this variation in timing
in a difference-in-differences framework and find that for publishers that were using the agency
model, Amazon prices decreased on average by 18 percent after retailers regained control of prices,
while Barnes & Noble prices decreased by 8 percent. Placebo tests support our main findings. Our
estimates are robust to several specifications that deal with any serial correlation concerns that
may arise due to the panel structure of our data.
In Section 5 we investigate the pricing strategies of the retailers and publishers in more detail,
and discuss how the pricing strategies fit into the theoretical literature on agency versus wholesale
models as well as on vertical price restraints. One important factor in understanding publishers’
pricing strategies under the agency model is whether higher retail prices go together with higher
wholesale prices. This is related to Jullien and Rey’s (2007) finding that upstream firms may
engage in resale price maintenance at high retail prices as part of a collusive upstream agreement
that prevents them from engaging in secret wholesale price cuts. However, we do not find any
indication that wholesale prices went up, even though publishers’ coordinated move towards the
agency model raised retail prices. In fact, due to the relatively higher commission that went to the
4retailers we find that on average e-book profit margins were lower during the agency period than
afterward. It is therefore likely that other factors explain the publishers’ adoption of the agency
model, such as fears that lower e-book prices cannibalize print books sales and erode consumers’
perceptions of the value of a book.
We do not find any evidence that the pricing strategies of the retailers are primarily intended
to lock in consumers, as argued by Johnson (2013) and Gaudin and White (2014). For instance,
Amazon’s retail prices decreased after it regained the ability to set retail prices, and have remained
consistently low despite having reduced means to leverage the Kindle platform due the availability of
Kindle apps for mobile phones, tablets, and other platforms. Moreover, Amazon prices 15 percent
of the most popular e-books below wholesale cost, suggesting the use of a loss-leader strategy.
Amazon sets e-book prices lower than other retailers, which is consistent with a comprehensive
strategy of customer acquisition and retention within Amazon’s ecosystem, and is not necessarily
intended to subsidize consumers’ adoption of the Kindle platform or sale of older (or backlisted)
e-books with higher margins (see, e.g., Abhishek, Jerath, and Zhang, 2013). Amazon has arguably
the largest breadth and depth of product variety and thus could benefit from selling other—perhaps
more profitable—products to its e-book customers.
In Section 6 we conclude and outline the contributions of the paper. Although a number of recent
theoretical papers have studied the effects of vertical restraints on prices using recent developments
in the e-book market as a motivation, our paper is the first to quantify how e-book prices have
developed before and after the switch from the agency to the wholesale model.4 Moreover, the
settlements only prohibit the use of vertical price restraints by publishers for a period of two years
and the use of MFN clauses for a period of five years. It is therefore important to know how
the selling mechanism affects prices. Although our analysis focuses on the market for e-books,
our results apply to any market that uses some form of the agency model. Examples of markets
besides e-books that use agency models include marketplaces such as eBay (Buy It Now), Amazon
(Amazon Marketplace), newspapers, and smartphone and tablet apps (e.g., Apple’s app store).
4
Examples of empirical studies on vertical price restraints in other markets include Mortimer (2008) and De los
Santos, Kim, and Lubensky (2014). For instance, Mortimer (2008) examines how the introduction of revenue-sharing
contracts in the video industry affected firms’ profits and consumer welfare.
52 Recent Developments in the Book Industry
One of the most significant changes in the book industry in the past ten years has been the transition
from print to electronic books, or e-books.5 Even though e-books have been around since the early
1970s, they gained greater popularity when E Ink, or electrophoretic ink, became available and
offered a much better reading experience while using less battery power. Amazon released its
Kindle in November 2007 and Barnes & Noble followed two years later with the Nook. Although
e-readers are primarily designed for the purpose of reading e-books, there are many other ways of
reading e-books, including computers, smartphones, and tablet computers. Even though tablets
are gaining popularity among readers of e-books, by the end of 2013 the Kindle e-reader was still
the most popular device for reading e-books.6 Amazon is also the dominant player in terms of e-
book sales. Initially responsible for more than 90 percent of all e-books sales in the United States,
Amazon’s market share at the end of 2013 was around 65 percent. Since April 2011 Amazon is
selling more (paid) e-books than print books, which shows the growing importance of e-books for
Amazon.7
The relatively fast growth of the e-book market is due in part to Amazon’s strategy of ag-
gressively discounting popular e-books since Kindle’s launch. E-books, like print books, were sold
using the traditional wholesale model, in which publishers sold e-books to retailers, which in turn
were free to set retail prices faced by consumers. Amazon’s pricing strategy included selling most
New York Times best sellers and new releases for $9.99. According to Amazon’s executives, $9.99
was roughly a break-even price early on: for a hardcover new release with a list price of $25, the
digital list price was 20% less, or $20. Book industry trade terms are usually in the range of a
50% purchase discount, which meant the cost to the retailer was $10.8 However, this strategy also
meant that a fraction (roughly 10%) of books was sold at a loss, consistent with both a loss-leader
strategy and potentially subsidizing consumers’ adoption of the Kindle platform.
According to the DOJ complaint, the major publishers preferred higher retail prices for their
popular books. In January 2009, they raised the digital list price to the print list price in an
unsuccessful attempt to pressure Amazon to increase its retail prices. The publishers’ main rationale
5
See Baye, De los Santos, and Wildenbeest (2013) for a more general overview of recent events in the book industry.
6
Specifically, almost 40 percent of adult Americans who read e-books own a Kindle e-reader, which is the highest
percentage of any single device. Figures are from the “Consumer Attitudes Toward E-Book Reading” survey (Book
Industry Study Group, August 2013).
7
See http://phx.corporate-ir.net/phoenix.zhtml?c=176060&p=irol-newsArticle&ID=1565581.
8
Direct testimony by Amazon’s vice president of Kindle Content, David Naggar. Available at
http://www.justice.gov/atr/cases/apple/exhibits/px-0837.pdf.
6for higher e-book retail prices was to prevent the erosion of the perceived value of books. In addition,
the publishers believed that higher retail prices would diminish Amazon’s dominance, prevent future
downward pressure on print and e-book prices, and reduce cannibalization of hardcover book sales.
In April 2010 Apple entered the e-book market when it launched its tablet computer, the iPad.
Apple did not want to directly compete with Amazon as long as Amazon was heavily discounting e-
books. The major publishers disagreed with Amazon’s pricing strategy as well, for reasons described
above. Their shared motivations led Apple and five of the Big Six publishers to develop the agency
model. Key to the agency model is that retail prices are set directly by the publishers, making the
retailer an agent for the publisher. In exchange the retailer receives a commission, which was set
at approximately 30 percent of the e-book price.
Apple realized that the agency model would only help it gain market share from Amazon if
Amazon did not have lower prices than Apple. To make sure this would happen, Apple negotiated
an MFN clause with the publishers. In this particular context, the MFN clause held that if other
retailers were selling a particular e-book at lower prices then Apple could sell at those lower prices
as well. However, Apple would still get to keep the 30 percent of the price when selling the e-
book. This guaranteed that Apple would sell at the lowest price set by any retailer. This condition
ensured that even if a competing retailer sold at a loss Apple would make a profit, which created a
powerful incentive for the publishers to make sure Amazon would also switch to the agency model.
After a nearly simultaneous decision around Apple’s launch of the iPad on January 27, 2010
the five publishers negotiated the adoption of the agency model with the other book retailers—
most predominantly Amazon, but also Barnes & Noble and Google’s eBookstore, among others.9
Amazon made the switch to the agency model in April 2010, and other retailers adopted the agency
model shortly afterward. Prices of these publishers’ e-books increased almost immediately to the
maximum price tiers set by the agency agreement with Apple (most predominantly $12.99 and
$14.99). On average, prices for these publishers increased 18.6 percent at Amazon and 19.9 percent
at Barnes & Noble. The largest price increase was 42.7 percent for New York Times best sellers at
Amazon. E-book prices for other publishers remained a similar levels during this period: prices at
Random House—the only “Big 6” publisher that did not immediately adopt the agency model—
increased 0.01 percent at Amazon and decreased 0.2 percent at Barnes & Noble. Amazon’s e-book
9
According to the direct testimony of David Naggar, Amazon’s vice president of Kindle Content (see also footnote
8), the negotiation also included a threat to pull their e-books from any retailers that did not adopt the agency model.
Amazon initially stopped sales of Macmillan’s books on January 28, but subsequently acquiesced to their demands
after coming to the realization that the other major publishers (with the exception of Random House) were making
similar demands.
7prices for other publishers decreased 0.2 percent and increased 2.3 percent at Barnes & Noble.10
The developments in the e-book market led the DOJ to sue Apple and the five publishers
in April 2012, alleging that they conspired to fix e-book prices. Three of the publishers settled
immediately (Harper Collins, Hachette, and Simon & Schuster). These settlements were finalized
in September 2012 and prohibited the publishers from restricting a retailer’s ability to set the retail
price of any e-book for a period of two years, while the use of MFN clauses were prohibited for a
period of five years. The settlement specifically mentioned that agency agreements are still allowed,
but that the retailer’s aggregate expenditure on discounts and promotions for e-books sold under
the agency model cannot exceed the retailer’s aggregate commission. In fact, the settling publishers
were not required to switch back to the original wholesale model but to a modified agreement that
effectively restricts them from directly controlling retail prices. In this agreement, publishers set a
list price for each e-book and pay the retailer a commission (around 30 percent) for every book sold
but retailers are free to set retail prices directly. Although this new model is dubbed the modified
or revised agency model by the industry, we prefer to refer to it as a modified wholesale model,
since the defining element of the agency model—resale price maintenance—is no longer present.
Still, even though retailers are free to discount e-books, restrictions on the aggregate discount for
a given publisher’s sales mean that retailers cannot discount e-books too heavily.
The two remaining publishers that were part of the lawsuit (Penguin and Macmillan) settled in
early 2013. Apple went to court and was found guilty of fixing prices in July 2013. It is currently in
the process of appealing, arguing that its entrance into the e-book market led to more innovation
and more competition.
Random House, the only Big Six publisher that did not participate in the talks with Apple,
adopted to the agency model in March of 2011, almost a year later than the other Big Six publishers.
Since it was not part of the lawsuit, it was not forced to abandon the original agency model.
However, as part of its July 2013 merger with Penguin, Random House joined Penguin in the
switch to the modified wholesale model in September 2013.
10
Table 5 of the direct testimony of Richard Gilbert (available at http://www.justice.gov/atr/cases/apple/exhibits/px-
1105.pdf). As part of his direct testimony, Orley C. Ashenfelter found an average price increase of 16.8 percent
for e-books published by the five publishers in the six-month period before and six-month period after the
implementation of the agency model (http://www.justice.gov/atr/cases/apple/exhibits/px-1097.pdf).
83 Data
The dataset contains daily prices of e-books for a large number of titles. The data were obtained
(using a web scraper) throughout 2012 and 2013 for Amazon, Barnes & Noble, and Books-A-
Million; for Apple we only have price data for 2012. In addition to e-book prices, we observe
several characteristics for each title such as publisher, number of pages, and customer ratings. We
also have detailed information for the print version of the title, including price, format (hardcover
or paperback), edition, weight, dimension, sales rank, etc. Table 1 gives descriptive statistics
for the variables we use for our empirical analysis, summarized by publisher. As shown in the
table, Amazon has the lowest average prices of the four retailers for books published by all of the
Big Six publishers, as well as other publishers. Hachette e-books have the lowest average prices
across retailers, while those published by Random House have the highest average prices. Book
characteristics are very similar across publishers.
Table 1: Summary Statistics
Harper Hachette Simon & Macmillan Penguin Random Other
Collins Schuster House Publishers
Price e-book (st.dev.)
Amazon 8.86 8.08 10.04 9.22 9.87 11.05 8.49
(3.09) (2.85) (2.63) (2.36) (2.69) (2.76) (3.14)
Barnes & Noble 10.16 8.87 11.35 10.06 10.70 11.59 10.51
(3.8) (3.15) (2.76) (2.33) (2.69) (2.61) (4.4)
Books-A-Million 10.46 9.36 11.62 10.41 10.80 11.89 10.07
(4.1) (2.64) (2.75) (2.37) (2.66) (2.39) (4.02)
Apple 10.05 10.38 11.22 10.66 11.05 11.90 10.34
(2.75) (2.05) (2.42) (2.03) (2.69) (2.4) (2.75)
Book characteristics
Ratings 4.08 4.02 4.12 3.96 4.03 4.10 4.29
(0.45) (0.5) (0.49) (0.52) (0.55) (0.45) (0.41)
Number of reviews 365 667 441 369 385 708 398
(485) (990) (755) (613) (764) (1,512) (1,234)
Number of years 0.54 0.77 0.80 0.91 0.55 0.85 0.78
since release (0.96) (1.66) (1.62) (2.46) (1.19) (1.78) (1.9)
Print book characteristics
Sales rank 73,237 58,155 58,020 83,607 63,531 38,799 72,479
(161,348) (96,302) (96,322) (121,165) (97,918) (87,587) (136,691)
Number of pages 391 416 391 389 406 406 338
(126) (139) (145) (101) (128) (171) (137)
Book weight 15.51 16.46 17.29 16.68 15.42 18.83 14.49
(8.18) (8.96) (9.54) (8.56) (8.76) (9.95) (9.46)
List price 21.14 20.10 21.80 21.47 19.66 21.98 18.35
(8.28) (7.67) (7.57) (7.87) (9.12) (7.6) (8.29)
Number of titles 200 244 276 163 444 449 451
Number of observations 115,789 141,250 159,790 94,365 257,055 259,929 261,096
Notes: Standard deviation in parentheses.
9Our sample consists of titles that have been on one of the New York Times Best Sellers lists for
at least one week since 2011.11 We track the prices for these titles starting from the time of their
appearance on the best seller list until the end of the sample period. Since new titles appear on
the best seller lists every week, the number of titles in our dataset increases over time—from 417
on January 1, 2012 to 2,068 on December 31, 2013.
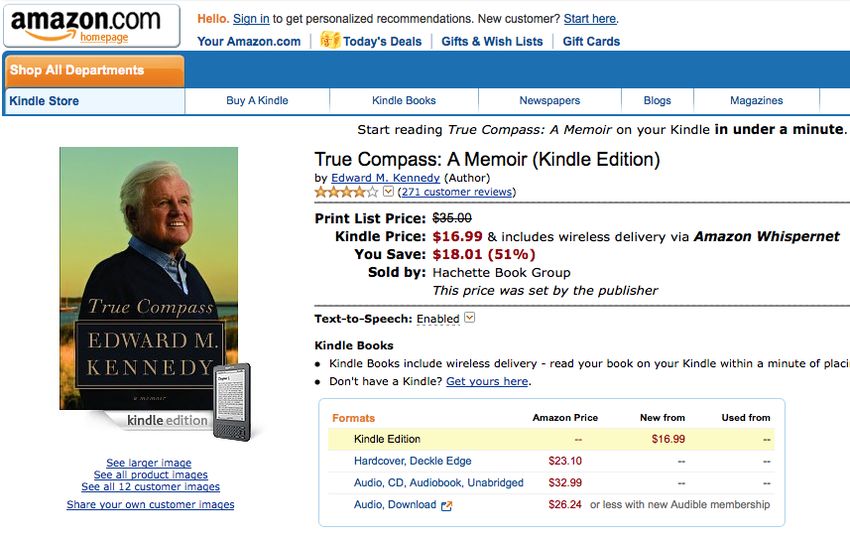
After the switch to the agency model, Amazon began to mention on its product pages whether
it or a publisher set the price of a particular e-book. This is shown in Figure 1 for the book
True Compass: A Memoir’ by Edward Kennedy, which gives screenshots from before the switch
to agency prices (in Figure 1(a)) and after (in Figure 1(b)). After the switch Amazon prominently
displays each book’s publisher who publishes the book (in the example, Hachette Book Group) and,
if the price is an agency price, who set the price. Using this information, we observe the exact date
of the switch away from the original agency model for each title in our sample. This is important,
because there can be several months between the settlement date and the actual switch date due
to the time it takes to renegotiate contracts between publishers and retailers. This is also shown in
Table 2, which for each publisher gives the exact date of the announcement of the settlement, the
finalization of the settlement, and the earliest date on which Amazon stated that it, rather than
the publisher, set the price of a book. Notice that there is a lot of heterogeneity in the time it
took to write new contracts: Amazon started discounting again just four days after finalizing its
settlement with Harper Collins, while in Penguin’s case it took almost four months. The actual
switch in selling model for e-books published by Macmillan, the last publisher to settle, happened
four months before the finalization of the settlement, in part due to restrictions imposed by the
judge that were meant to speed up the transition. The sixth big publisher, Random House, did not
participate in the talks with Apple, and even though it did adopt the agency model in 2011, it was
not part of the lawsuit. Although this meant Random House could keep using the original agency
model, it allowed the retailers to start discounting again on September 2013 as part of its merger
with Penguin.
Since we only observe the exact switch dates at Amazon, we cannot be certain that the other
retailers switched at the same time. However, reports from trade sites for the publishing industry
indicate that in most cases the other retailers followed the same day, or at most within a few days.12
11
The New York Times Best Sellers lists we have used are hardcover fiction; hardcover nonfiction; trade paperback
fiction; mass market paperback fiction; paperback nonfiction; hardcover advice, how-to, and miscellaneous; and
paperback advice, how-to, and miscellaneous.
12
See, for instance, https://gigaom.com/2012/09/10/that-was-fast-amazon-is-already-discounting-harpercollins-
ebooks.
10Table 2: Settlement and Switch Dates
Settlement Settlement Amazon
Announcement Finalization Switch
Harper Collins Apr 11, 2012 Sep 06, 2012 Sep 10, 2012
Hachette Apr 11, 2012 Sep 06, 2012 Dec 04, 2012
Simon & Schuster Apr 11, 2012 Sep 06, 2012 Dec 09, 2012
Macmillan Feb 08, 2013 Aug 12, 2013 Apr 04, 2013
Penguin Dec 18, 2012 May 17, 2013 Sep 01, 2013
Random House – – Sep 01, 2013
Source: Department of Justice Antitrust Case Fill-
ings United States versus Apple, Inc., et al. See also
http://www.justice.gov/atr/cases/applebooks.html.
4 Empirical Analysis
4.1 Empirical Strategy
All five Big Six publishers that were part of the lawsuit have settled since the announcement of the
lawsuit in April 2012 and again allow retailers to offer discounts, as in the original wholesale model.
The sixth Big Six publisher, Random House, was not part of the lawsuit, but did use the agency
model at the beginning of the sample and abandoned the original agency model in September 2013,
after its merger with Penguin.
Since book prices change frequently, simply comparing prices before and after the switch could
lead to misleading results. Instead, we exploit cross-publisher variation in the timing of the switch
to different selling models. Using a difference-in-differences regression framework, prices for each
of the Big Six publishers are compared to prices for the other publishers before and after the
publisher’s switch from the agency to the modified wholesale model. The control group at the time
of the switch therefore includes publishers that are still selling under the agency model as well as
publishers that have already switched.
The specification we estimate is
ln(pricejt ) = γ · (wholesalejt × bigsixj ) + β · Xj + λp + λw + εjt ,
where pricejt is the e-book price of title j at time t, wholesalejt is an indicator for whether at
time t the price of title j was set by the retailer, as in the modified wholesale model, bigsixj
is an indicator for the title being published by one of the Big Six publishers, Xj includes book
characteristics such as days since release, sales rank, weight of the related printed book, ratings,
and list price, λp are publisher fixed effects, λw are week fixed effects, and εjt is an error term.
11Since only Big Six publishers were using the agency model, the variable wholesalejt captures the
switch for each of the publishers to the modified wholesale model, so wholesale × bigsix can be
interpreted as a difference-in-differences estimator.
4.2 Main results
Table 3 presents results for the estimation of the main difference-in-differences specification. Since
retailers may have different pricing strategies, we separately estimate the model for prices at Ama-
zon and Barnes & Noble, the two largest sellers of e-books. We estimate two specifications for each
retailer: a specification in which we allow for publisher fixed effects as well as a specification that
allows for book fixed effects. When allowing for publisher fixed effects, the estimated coefficients
on (wholesalejt × bigsixj ) imply that the switch to the wholesale model at the time of the switch
reduced average e-book prices sold on Amazon by around 18 percent and on Barnes & Noble by
approximately 8 percent.13 Both coefficients are highly significant. Allowing for book fixed ef-
fects reduces the magnitude of the effect, but not by much: as a result of the switch the average
percentage price decrease is 17 percent for e-books sold on Amazon and 7 percent on Barnes &
Noble.
The estimated coefficients for the other controls shown in the table are very similar across
retailers and specifications and indicate that books with higher sales ranks sell at lower prices.
Although the number of pages in the book only affects Barnes & Noble prices, the weight of the
related printed book is positively related to prices of books at both retailers—this could reflect
that the value of having a (zero weight) digital book is increasing with the weight of the printed
alternative. Ratings on Amazon do not seem to matter for prices, although there is a very small
negative association between the number of reviews and prices. The list price of the related printed
book is positively related to the price of the corresponding e-book. The coefficient on the number
of years since release is not significantly different from zero in any of the specifications.
A crucial assumption in our difference-in-differences framework that helps us to identify the
price change following a switch from agency to the modified wholesale model is that if none of
the Big Six publishers would have switched, they would all have continued on the same trend.
Unfortunately this assumption is not directly testable, but we can get an idea of whether this
parallel-trend assumption is plausible by looking at publisher-specific trends in the first few months
of the sample, when all Big Six publishers were still selling e-books using the original agency model.
13
The (average) percentage change in price is calculated as 100 · [exp(γ̂) − 1], where γ̂ is the estimated coefficient
on (wholesalejt × bigsixj ) as reported in Table 3.
12Table 3: Main Results
Amazon Barnes & Noble
Publisher Book Publisher Book
fixed effects fixed effects fixed effects fixed effects
Difference-in-differences estimator
wholesale×Big Six −0.199∗∗∗ −0.191∗∗∗ −0.088∗∗∗ −0.077∗∗∗
(0.006) (0.006) (0.007) (0.007)
Other controls
ln(sales rank) −0.032∗∗∗ −0.024∗∗∗ −0.031∗∗∗ −0.021∗∗∗
(0.002) (0.002) (0.002) (0.002)
number of pages in the book −0.000 −0.000∗∗
(0.000) (0.000)
weight of the book (ounces) 0.003∗∗∗ 0.003∗∗∗
(0.001) (0.001)
rating on Amazon 0.006 0.010
(0.007) (0.007)
number of reviews on Amazon −0.000∗∗∗ −0.000∗∗∗ −0.000∗∗∗ −0.000∗∗∗
(0.000) (0.000) (0.000) (0.000)
list price 0.015∗∗∗ 0.016∗∗∗
(0.001) (0.001)
years since release −0.002 −0.193 0.002 −0.131
(0.003) (0.017) (0.003) (0.018)
constant 2.350∗∗∗ 2.762∗∗∗ 2.339∗∗∗ 2.686∗∗∗
(0.048) (0.026) (0.047) (0.026)
R-squared 0.525 0.733 0.450 0.693
Number of observations 620,992 620,992 607,656 607,656
Notes: Dependent variable is ln(price). All specifications include week fixed effects. Stan-
dard errors (clustered by book) in parentheses. ∗ significant at 10%; ∗∗ significant at 5%; ∗∗∗
significant at 1%.
We do this by adding a linear pre-trend for each of the publishers in the period before any of the
Big Six publishers had switched—if we cannot reject that all of the publishers were on the same
trend in the pre-treatment period, we can have more confidence that the parallel trend assumption
holds in the period after the first switch as well. Table 4 gives the results for the pre-trend analysis.
The results indicate that while for most of the publishers we cannot reject that they are on the
same pre-trend, prices for e-books published by Simon & Schuster are on a slightly more negative
trend than the others at both retailers. However, as is also shown in Table 4, whereas adding the
pre-trend does not affect the difference-in-differences estimator, excluding Simon & Schuster from
the analysis only results in larger estimated price effects of the switch.
Robustness
In this section we present a robustness analysis of the main results under various specifications. As
our analysis relies on a relatively long time series of prices, we first address how susceptible our
analysis is to bias due to serial correlation. In addition to the long time series, publishers do not
13Table 4: Pre-trend Analysis
Amazon Barnes & Noble
No Simon No Simon
Baseline Pre-trend & Schuster Baseline Pre-trend & Schuster
wholesale×Big Six −0.199∗∗∗ −0.201∗∗∗ −0.213∗∗∗ −0.088∗∗∗ −0.087∗∗∗ −0.128∗∗∗
(0.006) (0.006) (0.007) (0.007) (0.007) (0.008)
Publisher-specific trend
Hachette 0.002 0.002∗
(0.001) (0.001)
Simon & Schuster −0.005∗∗∗ −0.006∗∗∗
(0.001) (0.001)
Macmillan 0.000 −0.001
(0.001) (0.001)
Penguin 0.001 −0.002
(0.001) (0.001)
Random House −0.001 −0.002∗∗
(0.001) (0.001)
R-squared 0.525 0.526 0.541 0.450 0.453 0.462
Number of observations 620,992 620,992 520,542 607,656 607,656 509,358
Notes: Dependent variable is ln(price). The specifications include week fixed effects and controls as the main
specification in Table 3. Publisher-specific trend parameters are multiplied by 1,000 and are relative to Harper
Collins. Standard errors (clustered by book) in parentheses. ∗ significant at 10%; ∗∗ significant at 5%; ∗∗∗
significant at 1%.
return to the agency model once they have switched back to the wholesale model, which means
that the treatment variable does not show much variation over time. As argued by Bertrand, Duflo,
and Mullainathan (2004), the resulting serial correlation problems need to be addressed to avoid
underestimating the standard error of the difference-in-differences estimator.
To assess the extent to which serial correlation affects our estimates, we aggregate the data
into weekly as well as monthly observations. This reduces the average number of periods we are
using for our analysis and should therefore alleviate the serial correlation problem. As shown in
Table 5, the estimated coefficient on wholesale × bigsix changes only slightly when collapsing the
data into fewer periods. An alternative way to address serial correlation is to ignore the time series
information altogether by averaging the data before and after the switch. A complication in our
application is that not all publishers switched at the same time. We therefore use the technique
suggested by Bertrand, Duflo, and Mullainathan (2004) to deal with aggregation when treatment
dates are staggered over time. This method consists of two stages: in the first stage we regress the
log of prices on a set of covariates as well as publisher fixed effects and week dummies, i.e.,
ln(pricejt ) = β · Xj + λp + λw + εjt .
14Table 5: Robustness Analysis
DID Estimator
Specification wholesale×Big Six R-squared Obs.
Panel A: Amazon
Aggregated by week −0.194∗∗∗ (0.006) 0.541 90,647
Aggregated by month −0.181∗∗∗ (0.006) 0.561 20,960
Residualized two-period panel −0.281∗∗∗ (0.012) 0.242 852
Including other publishers −0.233∗∗∗ (0.007) 0.499 771,988
Including print-book prices −0.198∗∗∗ (0.006) 0.536 606,825
Within 90 days of release −0.159∗∗∗ (0.011) 0.733 94,604
After 90 days of release −0.199∗∗∗ (0.007) 0.523 595,270
Before paperback release −0.203∗∗∗ (0.007) 0.654 412,759
After paperback release −0.192∗∗∗ (0.010) 0.364 208,233
Panel B: Barnes & Noble
Aggregated by week −0.083∗∗∗ (0.007) 0.466 90,602
Aggregated by month −0.075∗∗∗ (0.007) 0.480 20,947
Residualized two-period panel −0.118∗∗∗ (0.012) 0.049 850
Including other publishers −0.108∗∗∗ (0.008) 0.462 755,274
Including print-book prices −0.086∗∗∗ (0.007) 0.456 599,582
Within 90 days of release −0.112∗∗∗ (0.014) 0.665 93,299
After 90 days of release −0.082∗∗∗ (0.008) 0.450 583,693
Before paperbacks release −0.105∗∗∗ (0.008) 0.595 403,054
After paperbacks release −0.057∗∗∗ (0.012) 0.236 204,602
Notes: The table presents difference-in-differences coefficients estimates for
different sample and control specifications. Dependent variable is ln(price).
The specifications include week fixed effects (month fixed effects when aggre-
gated by month) and controls as the main specification in Table 3. Standard
errors (clustered by book) in parentheses. ∗ significant at 10%; ∗∗ significant
at 5%; ∗∗∗ significant at 1%.
We then group the residuals into residuals from before the switch and residuals from after the
switch and take averages (per book). In the second step we estimate the effect of the switch
on prices by OLS using a dummy variable similar to wholesale × bigsix to indicate that for all
observations the switch occurred in the second period of the aggregated two-period panel. The
results of this residualized aggregation, shown in Table 5, confirm that the standard errors were
indeed understated when not taking serial correlation into account, as in the results shown in Table
3, although at the same time the magnitude of the effect increases at both retailers. Part of this
reflects a difference in sample: for our main results we use all books that came out during the
sample period, even if this was after a publisher’s switch, while for the two-period panel we can
only include books for which we have observations for both before and after the switch.
In our main specification we only include books sold by Big Six publishers. Since we have
variation in the timing of the switch across the Big Six publishers, this means the control group
consists of the Big Six publishers that were still using the agency model. Our dataset also contains
15data on books published by non–Big Six publishers. The books published by these smaller pub-
lishers can serve as an additional control group—these books were sold using the wholesale model
throughout the entire sample period, so any difference in outcome between books published by the
other publishers and those published by the Big Six publishers can potentially be attributed to the
switch away from the original agency model. These results are reported in Table 5 and show an
even larger effect than in our main results: an average price decrease of 21 percent for books sold
by Amazon and 10 percent for e-books sold by Barnes & Noble.
In order to control for demand factors particular to a book title that may change over time (for
instance the release of a movie that is based on the book), Table 5 splits the estimates for titles
that are within ninety days of release and those that are older. Although the differences are minor,
for e-books sold by Amazon the effect of the switch is smaller for newer books than for older books.
We find the opposite effect for Barnes & Noble.
The first edition of a new title is typically released as a hardcover; once hardcover sales begin
to decrease a paperback edition is released. Books that have not yet seen a paperback release
therefore tend to be newer and more popular, which may affect pricing of the e-book version as
well. The final two specifications of Table 5 estimate the main specification separately for titles
that have not yet seen a paperback release, and those that have. For Amazon the results are very
similar across the two specifications. For Barnes & Noble, we find the effect of the switch away
from agency pricing to be smaller for the older titles.
4.3 Effects by Publishers
The main difference-in-differences specification presented above estimates the average effect of the
switch in selling method across publishers. If there is no competition between publishers one
would expect the effect to be similar across publishers. However, if publisher do compete with
one another, the staggered nature of the switches to the modified wholesale model could make the
effect of switching for each publisher depend on how many publishers have already switched. Table
6 presents difference-in-differences estimates by publisher for three different specifications. As the
baseline results show, the effects are generally very similar across publisher, although the price
effect at Amazon is much smaller after Simon and Schuster’s switch than after the switches of the
other Big 6 publishers. However, they are not statistically significant for Barnes & Noble.
In each of the specifications so far we have used all observations before and after a publisher’s
switch to obtain the difference-in-differences estimator. Since publishers made the switch from
16Table 6: Effects by Publishers
Amazon Barnes & Noble
30-day 7-day 30-day 7-day
Baseline window window Baseline window window
wholesale×Harper Collins −0.208∗∗∗ −0.195∗∗∗ −0.191∗∗∗ −0.122∗∗∗ −0.100∗∗∗ −0.078∗∗∗
(0.018) (0.018) (0.011) (0.020) (0.020) (0.016)
wholesale×Hachette −0.226∗∗∗ −0.159∗∗∗ −0.126∗∗∗ −0.152∗∗∗ −0.116∗∗∗ −0.034∗∗∗
(0.013) (0.019) (0.013) (0.014) (0.023) (0.012)
wholesale×Simon & Schuster −0.108∗∗∗ −0.128∗∗∗ −0.232∗∗∗ 0.013 0.017 −0.132∗∗∗
(0.013) (0.017) (0.019) (0.013) (0.017) (0.022)
wholesale×Macmillan −0.191∗∗∗ −0.170∗∗∗ −0.092∗∗∗ −0.100∗∗∗ −0.132∗∗∗ −0.084∗∗∗
(0.013) (0.014) (0.012) (0.011) (0.018) (0.011)
wholesale×Penguin −0.221∗∗∗ −0.047∗∗∗ −0.059∗∗∗ −0.085∗∗∗ −0.003 −0.012∗∗∗
(0.010) (0.008) (0.006) (0.010) (0.008) (0.005)
wholesale×Random House −0.226∗∗∗ −0.189∗∗∗ −0.160∗∗∗ −0.111∗∗∗ −0.054∗∗∗ −0.031∗∗∗
(0.010) (0.007) (0.007) (0.010) (0.008) (0.006)
R-squared 0.528 0.455
Number of observations 620,992 607,656
Notes: The table presents difference-in-differences coefficient estimates by publisher. The baseline specification
includes switching interaction coefficients for each publisher. As publishers switched at various dates, the windowed
coefficients are obtained from separate regressions using observations around the time of the switch of each publisher.
All specifications include controls as in the main specification in Table 3. Dependent variable is ln(price). Week
fixed effects included. Standard errors (clustered by book) in parentheses. ∗ significant at 10%; ∗∗ significant at
5%; ∗∗∗ significant at 1%.
agency to the modified wholesale model at different times, this means that the number of obser-
vations we use before and after a switch is not the same across publishers. A potential concern is
that publishers are not exposed in a similar way to any serial correlation that is left in the data,
or that any differential (publisher-specific) trend that is not picked up by the week fixed effects
will bias the difference-in-differences estimator. Moreover, when using all observations before and
after a publisher’s switch, it is difficult to distinguish between the short-run and long-run effects of
the switch. To deal with these issues, the remaining columns of Table 6 give the publisher-specific
difference-in-differences estimator when using shorter windows. Specifically, we look at a window
that includes price observations 30 days before and 30 days after a switch, as well as a shorter win-
dow of 7 days before and 7 days after a switch. Since the publishers’ switching dates are staggered
and in most cases there are more than 60 days between subsequent switching dates, we have to es-
timate the model for each publisher separately. The reported difference-in-differences estimators in
Table 6 are thus obtained from separate regressions. For most publishers the effects become smaller
when shortening the window, which suggests that the full price effects of the switches are spread
out over time. The difference is striking, especially for Penguin: if the window is shortened, the
difference-in-differences estimate changes from −0.221 to, depending on the exact window, between
−0.047 and −0.059.
17These findings are in line with Figure 2(a), which shows how average prices for each of the Big
Six publishers have evolved over time. As indicated by the yellow curve, the large differences in price
effects for Penguin are indeed because the price effects of the switch happen more gradually during
a five-month period. For Penguin this period of gradual change occurs mostly before Penguin’s
switch.
Figure 2(a) also shows that all the other Big Six publishers saw a more prominent drop in the
average Amazon price when they switched. The drops are in general less noticeable for average
Barnes & Noble prices over time, as shown in Figure 2(b), although Big Six publishers like Hachette
and Macmillan experienced price drops at the time of the switch similar to those at Amazon.
Interestingly, while average Amazon prices remained largely flat in the post-agency period, average
Barnes & Noble prices were on an increasing trend in the period following the switch. We will
get back to this in the next section, when discussing the pricing strategies of the retailers in more
detail.
Placebo Tests and Synthetic Control Method
The identification of the effect of the agency model on e-book prices comes from changes in
publisher-specific selling method. An alternative explanation is that these changes are driven
by shocks that are not captured by our controls. For instance, the switch away from the original
agency model is directly related to the settlement. Thus the drop in prices we observe may be the
effect of unobserved shocks related to the lawsuit (e.g., dissolution of the alleged cartel) that are
not captured by our data. To test whether our results indeed represent the effects of publishers
switching to the wholesale model, we conduct several placebo tests.
In our first placebo test we assign to each of the Big Six publishers the switch date for one of
the other publishers, taking into account that this will only work if the publisher has not already
switched at that date. Since Harper Collins was the first to switch, we cannot estimate a placebo
difference-in-differences estimator for this publisher, but we can use its switch date as a placebo
switch date for all other publishers. Hachette was the second Big Six publisher to make the switch,
which means for Hachette we can only use Harper Collins’ switch date as a placebo switch date,
but we can use Hachette’s switch date as placebo switch date for all the Big Six publishers that
switched at a later time. In total we end up with 14 different combinations of publishers and
placebo switch dates. We estimate each of these combinations separately, using a 14-day window
before and after the placebo switch date. If our main results are picking up unobserved shocks that
18happened around the same time as the switches, then we would expect to find similar effects for
the placebo switch dates.
In our second placebo test we use data for e-books published by the other (non-Big Six) pub-
lishers. These e-books were never sold under the agency model, but we estimate our main model as
if these other publishers used agency pricing for part of the sample and switched to the wholesale
model at the switch dates of each Big Six publisher. Since the switch dates are staggered, we
separately estimate the model for each of the switch dates, using a window of 14 days. Again, if
our main results are picking up unobserved shocks that happened around the same time as the
switches, then we would expect to find similar effects for the placebo switch dates we assigned to
the other publishers.
Table 7: Placebo Tests: Switch Date Imputation
Publisher used to Impute the Date of Switch to the Wholesale Model
Harper Simon & Random
Collins Hachette Schuster Macmillan Penguin House
Panel A: Amazon
wholesale×Hachette −0.011∗∗
(0.006)
wholesale×Simon & Schuster 0.004 0.010∗
(0.004) (0.006)
wholesale×Macmillan −0.006 0.043∗∗ 0.002
(0.007) (0.018) (0.019)
wholesale×Penguin −0.001 0.040∗∗∗ 0.047∗∗∗ 0.006
(0.004) (0.006) (0.008) (0.005)
wholesale×Random House 0.008∗∗∗ 0.023∗∗∗ 0.041∗∗∗ 0.014∗∗∗
(0.002) (0.006) (0.007) (0.004)
wholesale×Other Publishers −0.019 0.034∗∗∗ 0.021 0.004 0.047∗∗∗ 0.020∗∗
(0.016) (0.011) (0.014) (0.011) (0.010) (0.010)
Panel B: Barnes & Noble
wholesale×Hachette −0.009∗
(0.005)
wholesale×Simon & Schuster 0.004 0.012∗∗
(0.004) (0.006)
wholesale×Macmillan −0.004 0.033∗ −0.001
(0.006) (0.020) (0.018)
wholesale×Penguin −0.002 0.031∗∗∗ 0.043∗∗∗ −0.006∗
(0.004) (0.006) (0.008) (0.004)
wholesale×Random House 0.007∗∗∗ 0.016∗∗∗ 0.046∗∗∗ 0.001
(0.002) (0.006) (0.008) (0.003)
wholesale×Other Publishers −0.002 0.020∗∗∗ 0.017∗ 0.005 −0.008 −0.014
(0.008) (0.007) (0.009) (0.009) (0.010) (0.010)
Notes: The table presents difference-in-differences estimates using the switching date of the publisher in each
column imputed to the corresponding publisher on the row. Dependent variable is ln(price). The specification
includes switching interaction coefficients for each publisher, week fixed effects and controls as the main speci-
fication in Table 3. Standard errors (clustered by book) in parentheses. ∗ significant at 10%; ∗∗ significant at
5%; ∗∗∗ significant at 1%.
19The results for both placebo tests are reported in Table 7. Results for Amazon are in Panel A
of the table and results for Barnes & Noble are in Panel B. The first five rows of each panel give
the results for the first placebo test, in which we assign a publisher’s switch date to the other Big
Six publishers that have not switched at that date. The last row presents the results for the second
placebo test, in which we treat the other publishers as if they were using the agency model using
the switch dates of the Big Six publishers. The results are very similar across retailers. Only when
we assign Harper Collins’ switch date to Hachette, do we find the placebo effect to be negative and
significantly different from zero at the 5 percent level, although the effect is very small. For all other
combinations we either cannot reject that the placebo difference-in-differences estimator is equal
to zero, or we get a significant effect, but with a positive sign. Note that the significant positive
coefficients that we find could be the result of some form of price competition between publishers
and retailers, in which prices set by the non-switching publishers are strategic substitutes for the
prices set by the retailer for the publisher that just switched.
Table 8 gives the results for a third placebo test in which we replicate the estimation of the
main specification using the print book price instead of the e-book price for each of the titles in
our sample. If the changes in e-book prices we observe only reflect the change in selling method,
we would not expect to find a similar effect on the related print book prices. The results in Table
8 confirm that the effect is not present for print book prices: although the estimated difference-in-
differences coefficient is negative for both retailers, the effect is small and only significant at the
10 percent level in Amazon’s case and at the 5 percent level in Barnes & Noble’s case. Also if we
split out the effect by publisher we do not find much evidence that print-book prices changed as a
result of the switch, providing strong support for our main findings.
To assuage potential concerns about the quality of the control group, we also obtain difference-
in-differences estimates using the synthetic control group methodology of Abadie and Gardeazabal
(2003) and Abadie, Diamond, and Hainmueller (2010). They propose a methodology that deals
with the uncertainty of selecting a suitable control group from many potential control groups.
Central to their methodology is the creation of a synthetic control group, which is an optimally
weighted average of all possible control groups.
In our setting, the six publishers switched regimes in a staggered fashion, which limits the
number of potential controls available for each switch to the publishers that has not switched at
the time of the treatment. For this reason we were able to construct a synthetic group only for
Harper Collins (the first publisher that made the switch) for retail prices at Amazon and Barnes
20You can also read


