ARE VOTER ROLLS SUITABLE SAMPLING FRAMES FOR HOUSEHOLD SURVEYS? EVIDENCE FROM INDIA - RUCHIKA JOSHI, JEFFERY MCMANUS, KARAN NAGPAL, ANDREW FRAKER ...
←
→
Page content transcription
If your browser does not render page correctly, please read the page content below
Are voter rolls suitable sampling frames for
household surveys? Evidence from India

Ruchika Joshi, Jeffery McManus, Karan Nagpal, Andrew Fraker

IDinsight Working Paper

October 2020

                                                          01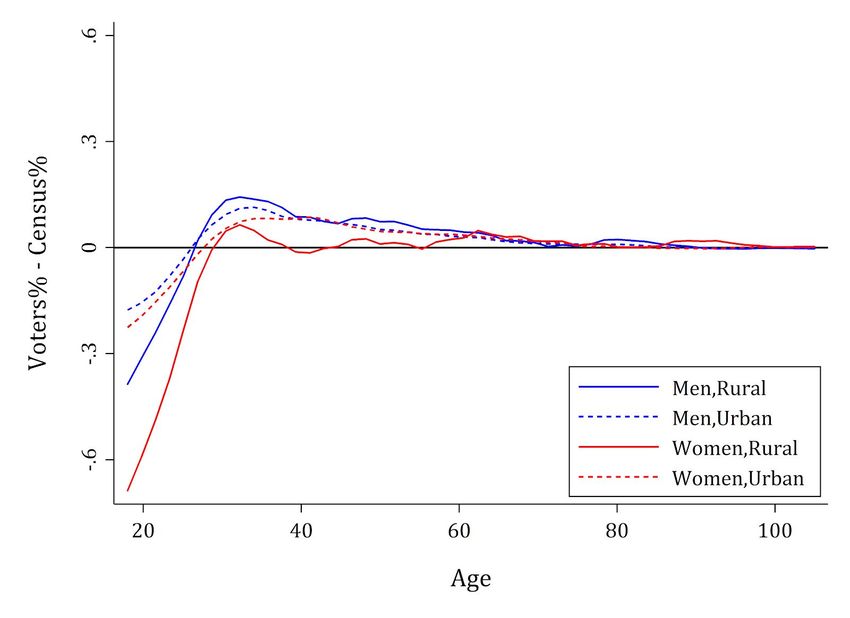
Abstract1
Household sample surveys are valuable inputs into policy decisions. Making data collection cheaper and
faster may expand the use of such surveys. For most household sample surveys, researchers either
conduct comprehensive household listings in sampled areas, which can be slow and costly, or rely on
field-based household selection methods, which may lead to non-representative samples. In India, we
investigate the use of publicly available voter rolls as an alternative to household listings or field-based
sampling methods. Using voter rolls for sampling can save the majority of the cost of constructing a
sampling frame relative to a household listing, but there is limited evidence on their accuracy and
completeness. To assess the suitability of voter rolls for the purpose of generating household sampling
frames, we conducted a household listing in 9 rural polling stations and 4 urban polling stations
comprising 7,769 voting-age adults across four states. We compared the listing results to voter rolls for
these polling stations and found that, overall, voter rolls include 91% of the households found in the
ground-truth household listing. Coverage is significantly higher in rural areas (96%) compared to urban
areas (78%). Exclusion in voter rolls does not appear to vary by a household's religion or socioeconomic
status, though there is some evidence that wealthier, higher-caste households in urban areas are slightly
more likely to be excluded. We conducted simulations to show that sampling from voter rolls can
produce estimates of household-level economic variables with little bias, especially in rural areas. These
results, albeit not representative of all Indian states, suggest that voter rolls are suitable for constructing
household sampling frames in rural areas.

1
  We would like to thank the Bill and Melinda Gates Foundation for financial support and intellectual
guidance for this study, in particular Sanjeev Sridharan and Suneeta Krishnan. Within IDinsight, we
would like to thank Doug Johnson and Ryan Fauber for helping to conceptualize some of the initial
research ideas, and Girish Tripathi for excellent field leadership. We also thank Aaditya Dar, Clément
Imbert, Jeffrey Weaver, Jonathan Lehne, Katie Pyle, Nikhil Srivastav, Pranav Gupta, Rahul Verma,
Santanu Pramanik, Tarun Arora, Vivek Nair, Will Thompson and Yusuf Neggers for conversations and
feedback on the paper. All remaining mistakes are our own.

    02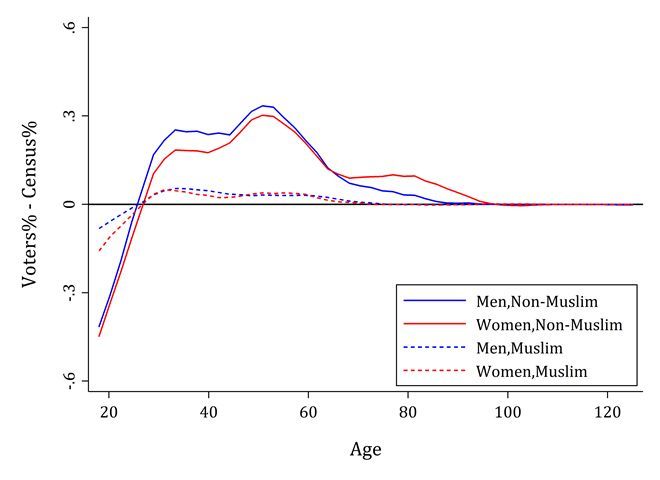
I. Introduction
When taking several types of policy decisions, policymakers rely on representative population statistics.
Generating such statistics, however, can be expensive and time-consuming, which limits the frequency
with which sample surveys are done. If household sample surveys were cheaper and faster to conduct,
policymakers could commission more surveys, leading to more decisions based on recent representative
data.
A large component of the cost of a household survey is the cost of constructing a comprehensive
sampling frame from which the researcher can sample units (households, individuals, firms) to survey.
The gold standard for constructing sampling frames for household surveys is a “household listing” in the
sampled areas.2 However, because each household has to be mapped and enumerated, this process is
costly and time-consuming.
Quasi-random alternatives to household listing, such as “right-hand rule,” “spin-the-pen,” and other
methods developed as part of the World Health Organization’s Expanded Programme on Immunization
(EPI), have also been widely used by public health and social science researchers (Bennett et al, 1991;
Hadler et al, 2004). They may be cheaper and faster than household listing, but are prone to bias
(Lemeshow and Robinson, 1985; Shannon et al, 2012).3
To avoid the cost of household listing while also mitigating the risk of bias inherent in quasi-random
methods, researchers across disciplines in India have turned to lists of voters, or “voter rolls,” to
construct sampling frames (Abraham et al, 2018; Banerjee et al, 2014; Dalal, 2008; Keshavamurthy et al,
2019; Khera, 2018; Lokniti, 2014; Neggers, 2018; Shukla, 2002). These voter rolls are publicly available,
which reduces the time and cost required to construct the sampling frame. Given universal adult
franchise in India, voter rolls are expected to cover every voting-age citizen of that area. Voter rolls are
regularly updated by the Election Commision of India (ECI), a constitutional authority that is
well-regarded for independence and efficient conduct of the largest democratic elections in the world
(Kapur et al, 2018; Shani, 2017). The ECI has also instituted several supervisory and community checks to
ensure that the voter rolls accurately reflect the set of voters in the area (ECI, 2020). Moreover, since
2
Surveyors first map the sampled area, then go door-to-door to list all the households residing within
the area, and finally draw a probability sample from this comprehensive list.
3
For example, in several EPI methods, the enumerators start counting households from a fixed point,
say the centre of the village, and finish sampling when they have reached the sample quota for the
particular location. This is likely to bias the sample towards households located closer to the fixed
starting point. Such biases are particularly concerning when outcome variables are concentrated in
certain clusters. Further, such methods give substantial discretion to the surveyor to choose households,
which increases the bias and creates the risk that the sampled households are chosen for their
convenience, rather than at random (Lemeshow and Robinson, 1985; Shannon et al, 2012).
03most elections are highly competitive, political parties have a collective interest in ensuring that no
voters are excluded from the voter rolls.
However, more recent research has cast doubt on the quality of Indian voter rolls. One criticism is that
voter rolls seem to be updated less frequently than mandated (Peisakhin, 2012). Bureaucratic hurdles
further lead to the exclusion of migrants from voter rolls, and the application process can be opaque,
corrupt and biased against the urban poor (Peisakhin 2012; Gaikwad and Nellis 2020). Errors in voter
rolls seem to be particularly large in cities with high rates of in-migration (Janaagraha, 2015, 2020) and
rural areas with high rates of out-migration (Verma et al, 2019). Further, by comparing voter rolls with
India’s Population Census, researchers estimate high exclusion for certain demographic groups such as
women (Roy and Sopariwala, 2019) and Muslims (Shariff and Saifullah, 2018). Given these findings, it is
important for researchers and policymakers who rely on samples drawn from voter rolls to know the
extent of errors in the voter rolls, and to know how these errors bias any resulting sample drawn using
voter rolls as a sampling frame.
In this paper, we document the extent of exclusion errors in the voter rolls in several locations in
northern India. We randomly sampled 13 polling station locations from four large north Indian states:
Uttar Pradesh, Bihar, Madhya Pradesh, and Rajasthan.4 Four of these polling stations are located in
urban areas, nine in rural areas. In each location, we compiled the most recent voter rolls, as well as
conducted a complete household listing. We then matched individuals enumerated in the household
listing to individuals listed on the voter rolls, using either the voter ID number (if provided), or other
personal information such as name, age, gender, and family relationships. This matching allows us to
calculate the aggregate household exclusion error rates, and to also investigate how these errors vary
with urban or rural status, gender, age, caste, and religion. Finally, we simulated 1,000 random draws
from each household sampling frame and compared the resulting sample estimates.
Voter rolls generally have low household exclusion errors: across these 13 polling stations, voter rolls
include at least one member from 91 percent of the households. Coverage is significantly higher in the 9
rural polling stations (96 percent) compared to the 4 urban polling stations (78 percent).5 Exclusion from
voter rolls does not appear to vary by a household's religion or socioeconomic status, though there is
some evidence that wealthier, higher-caste households in urban areas are more likely to be excluded.
When we compare sample estimates obtained from randomly drawing household samples from the
4
We initially sampled 20 polling stations, but restricted our results to 13 of them. In 6 polling stations,
our fieldwork start dates coincided with the onset of political protests following the Government of
India’s decision to amend the Citizenship Act and therefore we were not able to start our fieldwork. In
one polling station, we incorrectly mapped the boundaries of the area and had to discard those results.
5
These results are similar to what we observed in a separate field exercise we conducted in Rajasthan in
2017, where we similarly examined the completeness of voter rolls. We explain this in more detail in the
Discussion section.
04voter rolls with similar estimates from the household listing, we find that the two sets of estimates are
within 2 percentage points of each other for a range of asset and demographic indicators. The
representativeness of samples drawn from voter rolls is especially promising since we estimate that the
cost of compiling and processing voter rolls for sampling is only 14 percent of the cost of conducting a
household listing, thus reducing a major cost driver of sample surveys. Finally, although we primarily
investigate the suitability of voter rolls for household sampling, we do find that younger women are less
likely to be listed in voter rolls than individuals from other demographic groups.
While these results are not representative of the states from which we have sampled the polling
stations, they provide indicative evidence that voter rolls are a viable alternative for generating
household sampling frames in rural areas in these states.
This paper contributes to several literatures. First, we build on the literature that explores optimal ways
to construct household sampling frames, especially in low and middle-income countries (LMICs). Several
of these studies have called into question the robustness and implementation quality of field-based
sampling methods included as part of the EPI program (Chao et al, 2012; Grais et al, 2007; Milligan et al,
2004). More recently, several studies have explored GIS or satellite-based sampling methods (Awuah et
al, 2017; Guo et al, 2016; Himelein et al, 2016) but these papers have focused on limited geographies
and contexts. Additionally, these methods are presently limited in distinguishing between multiple
households residing in the same building, or between residential and other buildings.
Second, we contribute to the India-focused literature on the quality of voter rolls for household
sampling. Several studies have cast doubt on the completeness and accuracy of voter rolls in either
urban (Janaagraha, 2015, 2020) or rural areas (Verma, Gupta and Chhibber, 2019). Other studies have
compared the number of adults reported by the Population Census and Election Commission voter rolls
(Retnakumar, 2009; Roy and Sopariwala, 2019) to reach contradictory conclusions. To our knowledge,
our paper is the first direct comparison of voter rolls with in-person listing data of individuals in a polling
station to study household-level exclusion and inclusion errors. Using the same methodology for both
urban and rural areas, we examine whether voter rolls are sufficiently complete and accurate such that
at least one household member from each household located in the polling station appears on the voter
rolls for that polling station. We also conduct qualitative interviews with on-the-ground election
administrators to understand why inclusion and exclusion errors may arise.
Third, we contribute to a growing literature that audits administrative lists compiled by government
employees. For example, Niehaus and Sukhtankar (2013) conduct a household-level audit of a sample of
(alleged) beneficiaries to measure the extent of corruption in India’s national employment guarantee
program. In a similar vein, while examining the effect of e-governance reforms on India’s national
employment guarantee program, Banerjee et al. (2019) match names of beneficiaries listed in the
program’s public database with names from the 2012 Socio-Economic Caste Census to estimate the
prevalence of ‘ghost’ households in the program.
05Finally, we provide tools and recommendations for researchers interested in working with voter rolls,
and more broadly with Indian administrative records available in the Devanagari script. We share our
code for a “fuzzy matching” algorithm to match Hindi names across our household listing and voter rolls.
We also demonstrate that our algorithm, which has a high true match rate and a low false match rate,
significantly outperforms alternative off-the-shelf algorithms.
The rest of the paper is organized as follows. In the next section, we describe how voter rolls are
constructed and how they can be used for household sample surveys. Then, we describe how we
collected our data, and our methodology for matching individual records and subsequently estimating
household exclusion rates. Finally, we present and discuss the results.
II. Sampling from Voter Rolls in India
1. Voter rolls in India
Each Indian state is divided into national and state constituencies. For the purpose of managing
elections, the Election Commission of India (ECI) divides each constituency into polling stations, which
represent geographically contiguous areas. All voters registered as living in that area vote at the same
location, usually at a school or primary healthcare centre. In urban areas, a polling station is composed
of adjacent streets, similar to a neighbourhood. In rural areas, the polling station could be an entire
village or part of a village. Since polling stations are created exclusively for the purpose of managing
elections, they do not map neatly onto other administrative units such as villages or wards. According to
the ECI, the number of voters at a polling station cannot exceed 1,200 in rural areas and 1,400 in urban
areas (PTI, 2017). The physical location where citizens vote is called the polling booth; often, multiple
polling stations have the same polling booth.6
The Indian Constitution guarantees the right to vote to all citizens aged 18 and above. To be able to
vote, citizens must appear on the voter roll – the list of registered voters – of their respective
constituencies. The ECI is responsible for preparing, maintaining and revising the voter rolls, with the
Electoral Registration Officer (ERO) and the Booth Level Officers (BLO) in charge of implementation at
the level of the constituency and the polling station, respectively.
The voter registration process, in theory, ensures that every citizen 18 years or older is listed on the
voter rolls of their respective constituency. Every five years, EROs and their staff are mandated to
conduct ‘intensive revisions’ of voter rolls, during which they must visit every household in their
constituency to register eligible citizens. Voter rolls are also updated annually to add newly eligible
voters and those who have recently moved into the area, and to delete names of those who have died
or shifted out of the area. Citizens can also initiate the process of registering to vote, for instance if they
6
For example, an urban ward could have 10 polling stations. Voters living in the urban ward would all vote in the
same school building (“the polling booth”), but different polling stations may be assigned different classrooms
within the school building.
06come of age between registration drives or move to a new location, by submitting an application to the
local registration office (Peisakhin, 2012; Gaikwad and Nellis, 2020).
2. Stylized description for how to sample using voter rolls
In order to provide context for later sections, we first describe how researchers could use voter rolls to
sample households.
The website of each state’s Chief Electoral Officer provides the latest voter rolls for each polling station.7
The voter roll for each polling station includes the polling station address, the number of voters
registered in the polling station, the date of the last update, a map showing the geographic extent of the
polling station, and details of each voter. Figure 1 shows a typical (mock) entry in the voter roll. The
entry includes the voter’s name, their relative’s name (usually parent or spouse), their age at the time of
the last update, gender, and a house number. The house number is based on co-residence within the
same structure and is typically assigned by the registration officer, rather than representing the street
address.
The number in the top left corner is the voter’s serial number in the voter roll; the alphanumeric
sequence in the top right is the voter’s unique ID. The voter’s photo is included on their voter ID card
and in the ECI’s database, but not provided in publicly available voter rolls.
Figure 1: Stylized Voter Roll Entry
Researchers using voter rolls to construct household sampling frames may sample villages and urban
wards from administrative lists and then attempt to match the corresponding polling stations. However,
this can sometimes be difficult because a village (or urban ward) may have multiple polling stations, or a
7
The ECI’s links to online voter rolls are at times out-of-date or broken. As of August 10, 2020, only six
links of India’s 36 states and union territories were working. Through online searching we were able to
identify working links for 22 other states and union territories.
07polling station may include parts from multiple villages or wards, or a village or ward may have multiple
polling stations and some of those polling stations may cover parts of other villages or wards.
Another option is to sample electoral units directly. Most state Chief Electoral Officer websites publish
the number of voters per assembly constituency and polling station, which can enable researchers to
sample clusters with a probability proportional to their size, or to construct post-sampling weights to
correct for different probabilities of selection.8
Once the clusters have been selected, the researcher could generate a household sampling frame from
voter rolls in two ways.
First, researchers could directly sample households from the list of all house numbers in the voter rolls.
However, the process of assigning house numbers to voters can be fairly ad-hoc, and the definition of a
household used by electoral officers does not correspond to commonly used definitions of households,
such as the use of a shared kitchen. In its instructions to BLOs, ECI (2011) interchangeably uses the term
house number, household, and family, thus creating a conceptual confusion. From our qualitative
interviews with BLOs, we learnt that some BLOs define a household as a group of individuals living and
eating together, while others define it as a group of individuals who inhabit the same physical dwelling.
Yet others defined it as a group of individuals who “run” their household together, or as a “family” that
includes parents and their unmarried children.9 Finally, in some voter rolls, we found that house
numbers were altogether missing.10
Given these issues, we recommend the second approach: randomly sample voters from the voter rolls
and instruct enumerators to find and list the household to which the sampled voters belong. However,
as we elucidate in the methodology section, final household sampling weights using the self-reported
8
Since assembly constituencies are delimited for their electorates to be roughly equal in size, and since
the electorate of a polling station is also capped (at 1,200 voters in rural areas and 1,400 in urban polling
stations) (PTI, 2017), population weights tend to have relatively low variance.
9
This conceptual inconsistency amplifies once eligible voters move out of their dwelling house e.g.
children grow up and move out of the house for work or marriage. Either their voter IDs are not updated
to reflect this change at all or the procedure for updation inconsistently applied across polling stations
and individual situations surrounding the move.
10
We show in Appendix Table B1 that “houses” as per voter rolls tend to be much larger than
households according to our household listing definition. Moreover, as shown in Appendix Table B2,
voters with the same house number often belong to multiple households according to the listing, and
members of the same household according to the listing are often listed under different “houses” in the
voter rolls.
08number of voters in the household will be needed for each household to correct for unequal
probabilities of selection and recover unbiased population estimates.
III. Methodology and Data Collection
1. Polling station sample and household listing
Our sample includes 13 polling stations across four states: Bihar, Madhya Pradesh, Rajasthan, and Uttar
Pradesh. Although our sample is not large enough to be statistically representative of the population of
these states, we selected these states to maximize the population for which we could make indicative
claims. These states collectively include over a third of India’s population. Restricting our study to these
four states also made the household listing operationally easier, since most households in these states
can communicate in Hindi.
From each of the four states, we first randomly sampled two ACs from the most recent list of all ACs
available in the Lok Dhaba dataset collated by the Trivedi Centre for Political Data at Ashoka University
(2019). In national and state elections in India, some constituencies are “reserved” for candidates
belonging to the Scheduled Castes (SC) and Scheduled Tribes (ST), based on the proportion of these
communities in the electorate of the constituency. Constituencies reserved for ST candidates may have
lower quality voter rolls because of broader systemic inequalities or varying administrative capacity. To
account for this, we further sampled 2 ACs reserved for ST candidates from across the four states. This
yielded a sample of 10 ACs [5 General, 3 SC and 2 ST ACs] across the four states.
Next, we randomly sampled two polling stations from each AC, resulting in a sample of 20 polling
stations. Of these, we were only able to complete data collection for 13 polling stations, which include 9
rural and 4 urban polling stations.
We conducted our household listing during November – December 2019. Our data collection period
coincided with the passing of the Citizenship Amendment Act 2019, which was followed by public
violence in some parts of the country. Because of safety concerns for our field staff, we canceled listing
for the remaining 6 polling stations in our sample.11 That we could not complete the household listing in
these 6 polling stations was driven by our data collection schedule, rather than by any characteristics of
the polling stations themselves. Thus, this decision is unlikely to affect our results.
Further, in one urban polling station in Madhya Pradesh, we later found that the official polling station
boundaries, as denoted by the map on the voter roll, were incorrect and impaired our household listing
process. We discovered this issue when a large number of individuals in the denoted area reported
being registered at a different polling station. Of the 407 individuals in the polling station who provided
voter IDs to our enumerators, only 74 (19%) match with IDs in the corresponding voter rolls (compared
to greater than 90% voter ID matches for all other polling stations). We randomly sampled 100 of the
11
Of these, two polling stations were located in a ST-reserved constituency in Rajasthan, two polling
stations were located in an SC-reserved constituency in Rajasthan, and two polling stations were located
in an unreserved constituency in Uttar Pradesh. All these 6 polling stations are rural.
09remaining unmatched voter IDs and manually inputted them one-by-one into the ECI’s online voter
search portal.12 Of those 100, 79 IDs matched with IDs registered at surrounding polling stations in the
same city, while 21 did not return a match, suggesting that voters in the area are assigned to other
polling stations besides the one that is officially delimited for this area. As a result, we decided to drop
this polling station from the analysis.
Table 1 lists our the final sample of 13 (9 rural and 4 urban) polling stations by state.
Table 1: Household Listing Sample
State # ACs selected, by reservation type # PS selected, by type
General SC ST Total Urban Rural Total
Bihar 1 1 0 2 2 2 4
Madhya Pradesh 2 0 1 3 2 3 5
Rajasthan 1 0 0 1 0 2 2
Uttar Pradesh 0 1 0 1 0 2 2
Total 4 2 1 7 4 9 13
Within each polling station we attempted to list every household. Our team first located the BLO in
charge of maintaining the updated voter lists for that polling station to understand the boundaries of
the polling station. If the BLO was unavailable, our team sought out community leaders such as local
elected representatives, government school teachers, or any elected official in the area. Our field team
would ask the BLO or community leader to confirm the boundaries of the polling station, which the field
team would then compare to the polling station map printed on the voter rolls of that polling station,
and reconcile any discrepancies.13
Next, the field team systematically walked through the polling station to map its boundaries, which they
cross-checked with the map provided in the voter rolls. They further mapped the main entry and exit
routes, lanes, sub-lanes, intersections and key landmarks like schools, government offices, hospitals,
clinics, and places of worship. The team then enumerated every dwelling structure in the polling station.
Finally, enumerators were each assigned clusters of 10-15 structures and were instructed to list and
12
The online portal is protected by CAPTCHA and thus does not allow automated search queries.
13
Our team confirmed the polling stations’ geography, main roads, lanes, and sub-lanes with the BLO or
the community leader. Enumerators also asked for a rough estimate of the population of voters and
household count within the polling station. Enumerators were trained to remind the BLO to make sure
that all remote hamlets were included where relevant. For example, they were trained to ask the BLO to
identify any settlements that did not fall within the boundary of the polling station, and then cross-check
if in fact those settlements should be included in the voter rolls for that polling station.
010interview each household in every structure in their cluster. At the end of the household listing, the field
team leaders did a final round of verification in the entire polling station to ensure that each dwelling
structure marked on the map had been listed by the enumerators per protocol.
As part of our household listing process, we defined the household to be a group of people normally
living together and taking food from a common kitchen, consistent with the definition recommended by
the United Nations (UN Department of Economic and Social Affairs Statistics Division, 2017) and the
Indian National Sample Survey Office (National Sample Survey Office, 2016). This definition includes
temporary stay-aways i.e. those whose total period of absence from the household is expected to be
less than 6 months in the last one year, but excludes temporary visitors and guests i.e. those whose
expected total period of stay has been less than 6 months in the last one year.
Based on this definition, we enumerated 2,665 households. Of these, 157 households did not have
anyone available for an interview after two attempts to revisit them; in 135 of those cases, we managed
to find the number of voting-age adults and the religion of the household by asking their neighbors.14
131 households refused to participate in the full interview, though 84 of those completed an abridged
interview. Overall, we collected data on 2,596 or 97.4% of the enumerated households, which included
7,769 voting-age individuals. 15
For households that participated in the full interview, we collected information on asset ownership,
caste, religion, and household size.16 We also collected name, gender, age, marital status, primary
occupation, and father’s name (or husband’s name in the case of married women),17 and relationship to
the household head for all voters in the household. Finally, we asked voters for their voter IDs, though as
described below, not all voters were able or willing to share this information. Characteristics of
households in the sampled polling stations are summarized in Appendix Table B4.
In addition to the household listing and interview, we conducted qualitative interviews with BLOs in all
but one polling stations to understand the scope of their work, how frequently the voter rolls were
updated, what the main challenges in maintaining accurate voter rolls were, and whether they expected
there to be any variation in exclusion by subgroups.
14
We also asked neighbors about the missing household’s caste but neighbors often did not have this
information. In terms of household size and religion, there is no average difference between households
that were available for the interview and those that were unavailable.
15
When we estimate the total number of voting-age individuals per polling station in Appendix Table
B3, we impute the number of voters in households that we could not interview, using the average
household size in that polling station.
16
The shortened interview completed by 149 households excluded the asset module, which was the
longest part of the interview.
17
Voter rolls include each voter’s father’s or husband’s name, and so we needed to collect the same
information in order to match individuals in our household listing with entries in the voter rolls.
0112. Matching listing data to voter rolls
In order to compare the ground-truth household listing data with voter roll data, we matched eligible
voters identified in our listing with entries of registered voters listed on the voter rolls.18 Conceptually,
this approach is similar to one used by Banerjee et al. (2016) who used a matching algorithm to compare
names across administrative and household survey datasets.
Our approach was to first merge individuals across the two datasets using their voter ID number. 44
percent of matches are based on voter ID. Where the respondent did not provide their voter ID number,
or if the voter ID number did not match with an ID in that polling station, we “fuzzy matched” names
and different pieces of information like gender, age, marital status, and whether individuals were listed
in the same house number as other matched individuals. Fewer than 10 percent of the matches were
based on the exact same spelling of the individual’s name and their relative’s name; 46 percent matches
were based on fuzzy name matching and different pieces of information provided in the voter rolls. We
describe our matching algorithm, with 125 discrete merges of the two datasets, in detail in Appendix A.
We also assess the robustness of our algorithm in the Results section by running it on names and other
information of individuals who matched on voter IDs.
3. Analytical approach
From the matching exercise described above, we estimate household exclusion by calculating the
percentage of households in our household listing that have at least one individual who matched to an
individual on the voter roll of their polling station. We compare household exclusion by subgroups of
caste, religion, wealth quartile, and ownership of different types of government-issued poverty cards.
Next, we assess whether sampling from voter rolls can produce unbiased estimates of household
characteristics. As described above, house numbers in voter rolls are inconsistently defined and
sometimes missing, so we sample households by first sampling individuals from voter rolls, selecting
their corresponding household until the desired number of households is reached, and then applying
household weights to correct for unequal probabilities of selection. While correct weights depend on
the number of adults in each household who are registered at the applicable polling station, in practice
we found that it was challenging to confirm the voter registration status of each adult in the household.
Rather than attempt to match each individual in the household with an entry in the voter roll, we asked
the household head to report the number of registered voters in their household. Thus, our sampling
weight for each household is:
wip = [P r(select hh i in ps p)]−1 , where
P r(select hh i in ps p) = (# households sampled in p) * (# voters reported in i)/(# voters in p′s voter roll)
18
Throughout our analysis, we assume that our household listing provides a complete and true picture
of all voters in the polling station.
012Ideally, these weights should correctly adjust for different numbers of voters in each household, and
thus unequal probabilities of selection. But if self-reported voter counts are inaccurate and errors are
correlated with household characteristics, then applying household weights based on these
self-reported numbers may worsen bias. In the Results section, we simulate this sampling method and
assess whether estimates using these approximate weights outperform unweighted estimates when
compared to true means.
Finally, we examine individual-level exclusion by age and gender to assess the suitability of using voter
rolls for generating individual-level sampling frames.
IV. Results
1. Household-level voter roll exclusion
Table 2 shows the percent of households in each polling station with at least one individual found in
voter rolls. Across 13 polling stations, voter rolls include at least one member from 91 percent of the
households. Household match rates are significantly higher for the nine rural polling stations (96
percent) than for the four urban polling stations (78 percent).
Table 2: Household Match Rates by Polling Station
HH matches if at least one individual in HH is matched with voter roll entry
State PS Urban or Reservation Total Matched Matched
Rural status HH HH %
BR 1 Urban GEN 180 157 87%
BR 2 Urban GEN 264 165 63%
BR 3 Rural SC 252 244 97%
BR 4 Rural SC 224 219 98%
MP 5 Urban GEN 126 111 88%
MP 6 Rural GEN 130 120 92%
MP 7 Rural ST 192 183 95%
MP 8 Rural ST 206 193 94%
MP 9 Urban GEN 84 74 88%
RJ 10 Rural GEN 171 160 94%
013RJ 11 Rural GEN 249 243 98%
UP 12 Rural SC 146 144 99%
UP 13 Rural SC 145 136 94%
Total 2369 2149 91%
We cannot say with certainty that unmatched households are not represented on the corresponding
voter rolls. It may be that some individuals in unmatched households are in fact listed on the voter rolls
under names that are sufficiently different to be missed by our algorithm or by manual inspection. Thus,
our estimates of exclusion: 4 percent in rural areas and 22 percent in urban areas, are the upper bounds
of exclusion error for our sample.19
Table 3 reports match rates by subgroups. While match rates are significantly lower for upper caste
households, households in the top wealth quartile, and households without a ration card, this is in part
explained by urban areas having lower match rates in general and the fact that such households are
relatively more likely to live in urban areas. In rural polling stations, match rates are comparable across
all groups; no between-group differences are statistically significant at the 5% level. In urban polling
stations, upper-caste Hindu households in the top wealth quartile have slightly lower match rates than
other groups (p < 0.05).20
Table 3: Household Match Rates by Demographic Group
Category All PS Urban PS Rural PS
Total HH # Matched % Total HH # Matched % Total HH # Matched %
Caste group
General 483 83.2% 249 72.3% 234 94.9%
OBC 898 92.7% 277 81.9% 621 97.4%
19
False matches would lead us to underestimate the exclusion rate, but as we show in our robustness
checks at the end of the Results section, the number of non-matches are likely larger than the number
of false matches.
20
We interpret differences in match rates across subgroups as suggestive evidence of exclusion error
since we cannot disentangle true exclusion from an inability to correctly match an individual in the
household with a voter roll entry due to large discrepancies in names.
014SC 481 92.9% 71 76.1% 410 95.9%
ST 409 93.4% 30 86.7% 379 93.9%
Other 98 87.8% 27 74.1% 71 93.0%
Religious group
Hindu 2123 90.6% 481 73.0% 1642 95.7%
Muslim 228 93.4% 167 92.2% 61 96.7%
Other 18 72.2% 6 33.3% 12 91.7%
Wealth quartile
(PPI scores)
Top 25% 548 84.1% 282 73.4% 266 95.5%
25-50% 571 92.8% 116 82.8% 455 95.4%
50-75% 612 91.2% 156 78.2% 456 95.6%
Bottom 25% 616 94.8% 90 85.6% 526 96.4%
Missing 22 72.7% 10 50.0% 12 91.7%
Ration card
None 628 82.0% 329 72.0% 299 93.0%
Antyodaya 205 94.6% 30 90.0% 175 95.4%
BPL 880 93.6% 190 81.6% 690 97.0%
APL 604 94.0% 87 83.9% 517 95.7%
Other 52 92.3% 18 83.3% 34 97.1%
2. Estimation using household samples from voter rolls
Given low but likely non-zero exclusion rates, we examine whether voter rolls can be used to construct
household samples that produce estimates with low bias.
Table 4 shows that households with at least one registered voter are comparable to all households
enumerated in the household listing. For each household characteristic, we report the mean for all listed
015households compared with the mean for households with at least one member matched in the voter
rolls. The differences in means reflect bias due to both exclusion error and matching error. In Appendix
Table B5 we report these differences in terms of standard deviations from the mean value for all
households.
Across all polling stations, bias is less than 2 percentage points or 0.05 SD for all variables. Bias is larger
in urban polling stations, where the difference in means between all households and matched
households is greater than 4 percentage points for two variables (whether the household is Muslim and
whether the household owns a business), and greater than 0.1 SD for one variable (whether the
household is Muslim). In rural polling stations, differences in means never exceed 1 percentage point, or
0.02 SD, for any variable.
Table 4: Means of Household Characteristics, All Households vs Households with At Least One
Member in Voter Rolls
All PS Urban PS Rural PS
All HH Match Diff All HH Match Diff All HH Match Diff
SC/ST 0.392 0.402 0.010 0.161 0.164 0.003 0.479 0.475 -0.004
Muslim 0.096 0.099 0.003 0.256 0.304 0.048 0.036 0.036 -0.000
HH owns 0.168 0.167 -0.001 0.370 0.412 0.042 0.091 0.091 -0.000
business
HH farms 0.445 0.465 0.020 0.058 0.051 -0.007 0.592 0.593 0.001
HH has BPL card 0.373 0.384 0.011 0.292 0.306 0.014 0.403 0.408 0.005
Female HoH has 0.256 0.237 -0.019 0.526 0.499 -0.027 0.154 0.156 0.002
at least upper
prim educ
Pr(HH below 0.266 0.274 0.008 0.174 0.183 0.009 0.301 0.302 0.001
poverty line) per
PPI
HH owns table 0.589 0.578 -0.011 0.810 0.806 -0.004 0.505 0.508 0.003
HH owns dresser 0.330 0.318 -0.012 0.544 0.528 -0.016 0.248 0.254 0.006
016HH owns 0.551 0.534 -0.017 0.874 0.875 0.001 0.429 0.429 -0.000
pressure cooker
HH owns stove 0.694 0.687 -0.007 0.897 0.907 0.010 0.617 0.619 0.002
HH owns fan 0.751 0.743 -0.008 0.940 0.943 0.003 0.680 0.682 0.002
HH owns TV 0.439 0.428 -0.011 0.717 0.719 0.002 0.333 0.338 0.005
HH owns fridge 0.220 0.208 -0.012 0.439 0.431 -0.008 0.137 0.139 0.002
HH owns 0.364 0.361 -0.003 0.450 0.441 -0.009 0.332 0.336 0.004
car/motorbike
HH owns mobile 0.902 0.900 -0.002 0.952 0.955 0.003 0.883 0.883 -0.000
phone
Although Table 4 shows that voter rolls can, in theory, be used to obtain a representative sample of
households in the polling station, unbiased estimation also depends on calculating accurate weights for
the sampled households. Households will have different probabilities of selection depending on the
number of voters in each household, and in practice it may be challenging to estimate this number. As
described above, rather than attempt to match each individual in the household with an entry in the
voter roll, we recommend asking the household head to report the number of registered voters in their
household.
To investigate whether our household weights yield unbiased estimates, we simulate different sampling
and weighting procedures and present the results in Table 5. Column (1) reports the ‘true mean’ for
each variable computed by averaging values for all households in the household listing. Column (2)
reports estimates and 95% confidence intervals from randomly sampling 10 households per polling
station without replacement from the list of households with at least one member matched to an entry
in the voter rolls, repeated 1,000 times. These values are in theory the best that we could do if we had
access to an accurate household listing and could sample from that listing. As expected, these values are
very similar to the true mean for all matched households.
In Columns (3) and (4) we randomly sample individuals from the voter rolls and select their
corresponding household. If an individual is not matched with a name in our household listing, then we
assume that that person cannot be found and we draw again. If an individual matches with a name in a
household that has already been selected, then we discard that draw and draw again until we find 10
distinct households. Column (3) lists average means from 1,000 simulations of this sampling process,
017weighted only by the number of voters found in each polling station. Column (4) lists the results using
our suggested household weights, i.e. weighting each household inversely to the number of registered
voters in the household as reported by the household head.
Table 5: Estimates of Household Characteristics Under Different Sampling Procedures with 10
Households Sampled per polling station
Variable All HH Sample: All HH Sample: Voters Sample: Voters
(Unweighted) (Weighted)
(1) (2) (3) (4)
SC/ST 0.392 0.404 0.360 0.382
[0.343,0.467] [0.303,0.423] [0.315,0.454]
Muslim 0.096 0.097 0.111 0.111
[0.065,0.130] [0.078,0.145] [0.068,0.157]
HH owns business 0.168 0.163 0.224** 0.186
[0.118,0.215] [0.170,0.277] [0.132,0.243]
HH farms 0.445 0.465 0.461 0.438
[0.403,0.527] [0.403,0.522] [0.364,0.510]
HH has BPL card 0.373 0.380 0.380 0.373
[0.314,0.445] [0.314,0.452] [0.298,0.452]
Female HoH has at least 0.256 0.242 0.262 0.272
upper prim educ [0.187,0.297] [0.208,0.315] [0.203,0.343]
Pr(HH below poverty line) 0.266 0.269 0.255 0.257
per PPI [0.240,0.297] [0.228,0.282] [0.227,0.288]
HH owns table 0.589 0.587 0.662** 0.615
[0.517,0.651] [0.598,0.724] [0.543,0.691]
HH owns dresser 0.330 0.324 0.403** 0.358
[0.261,0.388] [0.341,0.466] [0.290,0.428]
HH owns pressure cooker 0.551 0.545 0.624** 0.579
[0.480,0.610] [0.565,0.687] [0.503,0.653]
018HH owns stove 0.694 0.691 0.746* 0.710
[0.631,0.758] [0.692,0.801] [0.637,0.780]
HH owns fan 0.751 0.751 0.795* 0.763
[0.689,0.814] [0.739,0.850] [0.689,0.833]
HH owns TV 0.439 0.437 0.523** 0.474
[0.375,0.500] [0.460,0.584] [0.404,0.544]
HH owns fridge 0.220 0.213 0.294** 0.250
[0.166,0.265] [0.242,0.347] [0.193,0.306]
HH owns car/motorbike 0.364 0.368 0.453** 0.386
[0.302,0.436] [0.388,0.516] [0.314,0.460]
HH owns mobile phone 0.902 0.901 0.929 0.908
[0.852,0.943] [0.886,0.965] [0.847,0.959]
Stars denote whether the true mean is outside of the 90% confidence interval of the sample mean (*),
the 95% confidence interval (**), and the 99% confidence interval (***)
Weighted estimates are close to true means. For all variables, the true mean is within the 90%
confidence interval around the weighted estimate. Weighted estimates are also closer to true means
than unweighted estimates for 15 of 16 variables.
Table 6 reports differences between average weighted estimates and true means for each variable for
all polling stations and separately for urban and rural polling stations. Across all polling stations, these
differences never exceed 4 percentage points. This sampling procedure is less stable for urban polling
stations, producing several estimates that are more than 5 percentage points different from the true
mean.21 However, it is quite stable for rural polling stations, with estimates never differing from true
means by more than 2 percentage points.
Table 6: Estimates of Household Characteristics, Differences between Average Weighted Estimates
(Based on Sampling 10 Households per polling station) and True Means
Variable All Urban Rural
21
True means are not significantly different from all estimated means in urban areas, though this is
largely due to the small number of urban polling stations (and thus small sample size).
019SC/ST -0.010 -0.018 0.002
[-0.077,0.062] [-0.116,0.105] [-0.086,0.093]
Muslim 0.015 0.041 -0.001
[-0.028,0.061] [-0.071,0.163] [-0.036,0.041]
HH owns 0.018 0.068 -0.008
business [-0.036,0.075] [-0.069,0.223] [-0.052,0.047]
HH farms -0.007 -0.011 0.008
[-0.081,0.065] [-0.058,0.054] [-0.080,0.099]
HH has BPL card 0.000 0.016 -0.002
[-0.075,0.079] [-0.119,0.162] [-0.094,0.090]
Female HoH has 0.016 0.010 0.009
at least upper [-0.053,0.087] [-0.133,0.149] [-0.063,0.089]
prim educ
Pr(HH below -0.009 -0.012 -0.006
poverty line) per [-0.039,0.022] [-0.060,0.039] [-0.045,0.032]
PPI
HH owns table 0.026 0.029 0.020
[-0.046,0.102] [-0.102,0.140] [-0.076,0.114]
HH owns dresser 0.028 0.049 0.016
[-0.040,0.098] [-0.092,0.202] [-0.056,0.093]
HH owns 0.028 0.031 0.016
pressure cooker [-0.048,0.102] [-0.071,0.126] [-0.069,0.101]
HH owns stove 0.016 0.027 0.006
[-0.057,0.086] [-0.069,0.103] [-0.090,0.095]
HH owns fan 0.012 0.012 0.007
[-0.062,0.082] [-0.065,0.060] [-0.088,0.097]
HH owns TV 0.035 0.051 0.020
[-0.035,0.105] [-0.083,0.172] [-0.063,0.106]
HH owns fridge 0.030 0.064 0.010
[-0.027,0.086] [-0.073,0.210] [-0.045,0.067]
020HH owns 0.022 0.032 0.015
car/motorbike [-0.050,0.096] [-0.105,0.177] [-0.068,0.105]
HH owns mobile 0.006 0.003 0.005
phone [-0.055,0.057] [-0.083,0.048] [-0.065,0.067]
3. Individual-level voter roll exclusion
While our focus is primarily on using voter rolls for sampling households, there may be circumstances
where researchers want to use voter rolls as individual sampling frames. For such cases, we document
the exclusion rate from voter rolls at the individual level in our sampled polling stations.
Appendix Table B6 shows the total number of voting-age adults found in the household listing and the
number of voters listed on the voter rolls. 74 percent of individuals in our household listing matched
with individuals on the voter rolls. As with household match rates, individual match rates are
significantly higher for rural areas than for urban areas: 79 percent of individuals in rural polling stations
match with a voter roll entry, compared to 61 percent in urban polling stations.
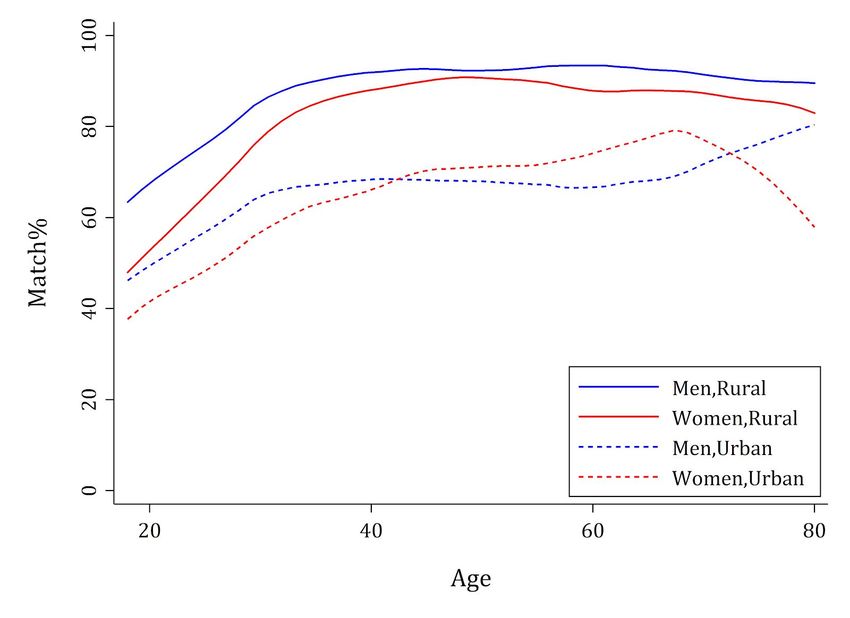
In Figure 2 we assess match rates by age-gender cohort, separately for urban and rural polling stations.
Across subgroups, younger individuals have lower match rates, with rates rising with age and plateauing
around 30 years old.22 Younger women, particularly in rural areas, have lower match rates than
similarly-aged men.
Figure 2: Subgroup Differences in Individual Match Rates
22
Match rates start to fluctuate substantially above 70 years old, reflecting the small sample size for
these gender-age cohorts.
021Next we investigate whether these results reflect true exclusion error, or whether younger people (especially younger women) are simply harder to match with voter roll entries.23 To assess the robustness of differential exclusion rates by individual subgroups, we ignore match rates and simply compare the fraction of individuals in each gender-age-urban/rural cohort in our household listing compared to voter rolls. Consistent with the matched results above, Appendix Figure B1 shows that voter rolls have a lower fraction of younger people than the household listing. Similarly, women under the age of 30 are especially underrepresented in voter rolls. In fact, women under 30 are the only groups where the raw number of individuals in the household listing is greater than the raw number of entries in voter rolls. 23 Younger women may have lower match rates if, for instance, they are less likely to be married than older women, and the combination of name-father’s name (for unmarried women) is less distinctive than the combination of name-husband’s name (for married women) in voter rolls entries (e.g. because many people may have the same father but the majority of marital relationships in India are monogamous). 022
4. Robustness of the matching algorithm

Our results depend on correctly matching individuals in our household listing with voter roll entries. If
our fuzzy matching algorithm incorrectly matches individuals, then our results may understate true
exclusion error in voter rolls.

We assess the robustness of our algorithm by running it on the full sample, without excluding the 2,530
individuals who matched on voter IDs. We then compare the matches made by the algorithm with the
original matches on voter ID for those 2,530 individuals. This gives us an upper bound on the matching
error, since the algorithm must find matches in a larger pool, which increases the likelihood of false
matches.24

Out of 2,530 individuals whom we matched on voter ID, the algorithm correctly matches 2,356 (93.1%)
using other information besides the voter ID. Of the remaining voter ID matches, the algorithm
incorrectly matches 57 (2.3%) with a different individual and does not find matches for 117 individuals
(4.6%). Incorrect match rates and non-match rates are similar across polling stations and subgroups.

If we assume that false match rates are similar for the rest of the sample, then an upper bound on
incorrect matches in the full sample is 2.3% of the 55.6% of individuals who matched on other
information besides voter ID, or 1.3% of the total number of matches. These results also suggest that the
algorithm is failing to make some matches that would increase the overall match rate by 2.7 percentage
points. Accounting for these matches would likely reduce our estimates of household exclusion error
further.

We also ran a common ‘off-the-shelf’ fuzzy match algorithm (Stata’s reclink command) on our sample to
compare performance against our algorithm. The off-the-shelf algorithm correctly matches 1,201 of
2,530 individuals (47.5%). Of the remaining voter ID matches, the off-the-shelf algorithm incorrectly
matches 123 (4.9%) with a different individual and does not find matches for 1,206 individuals (47.7%).
Thus, our customised algorithm significantly outperforms this common off-the-shelf algorithm in terms
of both true match rate and false match rate.

VI. Discussion

Overall, using voter rolls appears to be a strong alternative to conducting a traditional household listing
for constructing household sampling frames, especially in rural areas. In our sample, the overall
household exclusion rate from voter rolls in rural polling stations is below 4%. Most households have at
least one individual in the voter roll, ensuring that those households have a positive probability of
selection when sampling from voter rolls. In contrast, the exclusion rate in the urban polling stations we
examined was higher (22%) and varied significantly across polling stations.

24
   There are 7,769 individuals in our household listing and 9,351 voter roll entries in the pool that
includes those who matched on voter ID, compared to 5,239 individuals in our household listing and
6,821 voter roll entries in the pool that excludes those who matched on voter ID.

                                                                                                       023
These results are consistent with our findings from an earlier field exercise conducted by our team in 2017, where we similarly examined the completeness of voter rolls in five villages and one urban ward in the Ajmer district of Rajasthan. Although our methodology differed from the current study, in that we sampled villages and urban wards instead of polling stations and used a shorter survey instrument during household listing, the results were similar: 92% of households had at least one member in the voter rolls, and the household match rate for urban areas (84%) was lower than the household match rate for rural areas (93%). We discuss more results from the Ajmer field exercise in Appendix C. Higher exclusion in urban areas Several reasons could explain higher exclusion rates in urban polling stations. High migration in urban polling stations may contribute to inaccurate or incomplete voter rolls. Gaikwad and Nellis (2020) cite evidence that migrants in urban cities in India are likely to be more politically excluded from voter lists compared to residents due to bureaucratic hurdles, corruption, and prejudiced staff behaviour. Kumar and Banerjee (2017) find that the average rate of enrolment in voter lists for recent migrant workers in Delhi in 2014 was only 64 percent compared to 86 percent for permanent residents. Based on their assessment of voter rolls in Delhi, Janaagraha (2015) also suggests that a major source for errors in voter rolls was that voters registered in one part of the city were actually residing elsewhere, indicating high intra-city migration. Another reason may be related to ambiguous boundaries of urban polling stations in dense settlements, which we learnt from our field experience and from qualitative interviews with BLOs. In urban polling stations, houses located near the boundaries may get excluded from voter rolls corresponding to their own polling station because they were included in the voter rolls of an adjacent polling station. Additionally, since the number of voters that can be enrolled in an urban polling station is capped at 1,400, in densely populated urban areas, once this limit is reached, any remaining eligible voters are mandated to be enrolled in the neighbouring polling station. Finally, given that there are more polling stations for a given urban area compared to a rural area of the same geographical size, it is common to find that enrollment for a set of adjacent polling stations happens in the same location, which also serves as the polling booth on election day. In such cases, it is possible that when an individual goes to the polling booth to register, they may be mistakenly enrolled in the polling station for which the BLO is available at the polling booth on that day, and not in the polling station where their household is located. Given these issues, we recommend that researchers exercise a high degree of caution when using voter rolls for sampling in urban areas where polling station boundaries are ambiguous. Researchers may also consider sampling at the level of the polling booth (which would include several adjacent polling stations in a densely populated area) instead of at the level of the polling station. 024
No systematic exclusion of marginalized groups
An especially promising finding for those who are sampling households for better program delivery to
marginalised groups is that voter rolls also do not appear to systematically exclude lower castes,
Muslims, or less wealthy households.

Ahuja and Chhibber (2012) suggest that, owing to their differential relationship to the state, the poor
are more likely to view voting as a right, as compared to the non-poor who are more likely to report
participating in elections to secure material benefits or from a sense of civic duty. On the other hand,
the perceived gains from registering to vote may have little to do with the ability to vote. Instead, the
socioeconomic advantages of voter registration may arise from being able to use voter identity cards to
access employment opportunities and government benefits (Peisakhin, 2012).

In terms of religion, Muslim and non-Muslim households appear to have similar (low) rates of exclusion.
This suggests that researchers who want to specifically sample Muslim or non-Muslim households may
be able to use voter rolls to select representative and reliable samples. In this case, our findings
contradict Shariff and Saifullah (2018) who suggest that Muslims adults are more likely to be excluded
from voter rolls compared to other groups in Karnataka. The divergent results of our studies may reflect
methodological differences or regional differences in the populations being studied.

Higher exclusion of younger women
While we focused primarily on household sampling in this paper, researchers considering using voter
rolls to select a representative sample of individuals should exercise caution. We find that up to 26
percent of individuals may be listed under different names in voter rolls or outright excluded from them.
Across subgroups, individuals under the age of 30 are more likely to be excluded from voter rolls with
younger women, particularly in rural areas, more likely to be excluded than similarly-aged men.

This finding is consistent with Roy and Sopariwala (2019), which documents a ‘shortfall’ of 21 million
women voters when comparing voter rolls with Census projections. As a result, samples drawn from
voter rolls may not adequately represent the populations of these subgroups

From qualitative interviews with BLOs, it appears that the underrepresentation of younger women may
be driven by marriage migration of women. According to NFHS-4 , the median age for women at first
marriage was 19 years (IIPS & ICF, 2017). After marriage, women traditionally move to live with their
husband’s family which most often resides in a different village than of their birth. As part of qualitative
interviews, BLOs shared that recently married women who have moved into the polling station are most
likely to be excluded from voter rolls, although they are included over successive rounds of voter rolls
updation. This may explain why women over the age of 30 have similar rates of exclusion as men.

Cost of voter roll sampling frames
To consider voter rolls as an alternative sampling frame, evidence on exclusion rates should be
examined alongside the potential cost savings. Voter rolls-based sampling is significantly cheaper than
household listing. Based on our internal costing exercise for this research study, we found that the cost

                                                                                                        025
You can also read