China's Growing Demand for Agricultural Imports - Fred Gale, James Hansen, and Michael Jewison
←
→
Page content transcription
If your browser does not render page correctly, please read the page content below
United States Department of Agriculture

Economic
Research
Service
                     China’s Growing Demand for
Economic
Information
                     Agricultural Imports
Bulletin
Number 136

February 2015
                     Fred Gale, James Hansen, and Michael Jewison
United States Department of Agriculture

  Economic Research Service
  www.ers.usda.gov

  Access this report online:
  www.ers.usda.gov/publications/eib-economic-information-bulletin/eib136

  Download the charts contained in this report:
   • Go to the report’s index page www.ers.usda.gov/publications/
  		eib-economic-information-bulletin/eib-136
      • Click on the bulleted item “Download eib-136.zip”
      • Open the chart you want, then save it to your computer

  Recommended citation format for this publication:
  Gale, Fred, James Hansen, and Michael Jewison. China’s Growing Demand for
  Agricultural Imports, EIB-136, U.S. Department of Agriculture, Economic Research
  Service, February 2014.

  Cover image: Fred Gale, USDA, Economic Research Service.

  Use of commercial and trade names does not imply approval or constitute endorsement by USDA.

  The U.S. Department of Agriculture (USDA) prohibits discrimination in all its programs and activities on
  the basis of race, color, national origin, age, disability, and, where applicable, sex, marital status, familial
  status, parental status, religion, sexual orientation, genetic information, political beliefs, reprisal, or because
  all or a part of an individual’s income is derived from any public assistance program. (Not all prohibited
  bases apply to all programs.) Persons with disabilities who require alternative means for communication of
  program information (Braille, large print, audiotape, etc.) should contact USDA’s TARGET Center at (202)
  720-2600 (voice and TDD).

  To file a complaint of discrimination write to USDA, Director, Office of Civil Rights, 1400 Independence
  Avenue, S.W., Washington, D.C. 20250-9410 or call (800) 795-3272 (voice) or (202) 720-6382 (TDD). USDA
  is an equal opportunity provider and employer.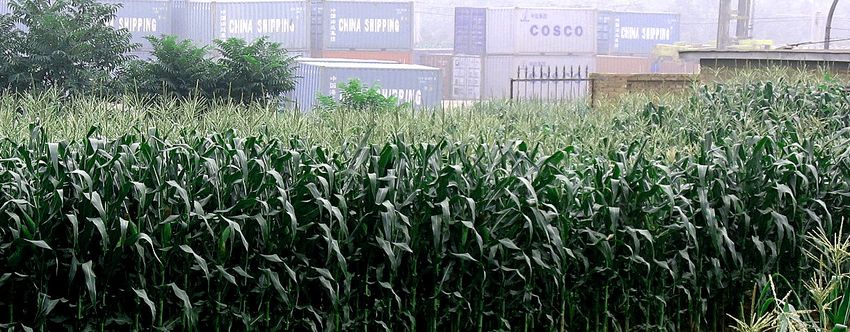
United States Department of Agriculture

Economic
Research        China’s Growing Demand for
Service
                Agricultural Imports
Economic
Information
Bulletin        Fred Gale, James Hansen, and Michael Jewison
Number 136

February 2015

                Abstract
                This report examines China’s recent emergence as a major agricultural importer and its
                implications for global markets. It analyzes trade patterns employing U.S. and Chinese
                trade statistics, summarizes alternative projections of future imports, and discusses how
                Chinese officials are adjusting their strategic approach to agricultural trade as imports
                grow. A strong agricultural trading partnership has developed between China and the
                United States that is likely to persist into the future. However, Chinese interventions to
                preserve self-reliance create volatility and uncertainty that can disrupt markets.

                Keywords: China, agricultural imports, soybeans, grain, meat, dairy, projections, policy

                Acknowledgments
                Michael Jewison is an agricultural economist with the USDA’s Office of the Chief
                Economist. The authors thank Andrew Anderson-Sprecher of USDA’s Foreign
                Agricultural Service; Colin Carter of the University of California-Davis; Mechel Paggi
                of California State University-Fresno; and Sun-ling Wang of USDA’s Economic Research
                Service (ERS) for their peer reviews. We also thank the USDA, Foreign Agricultural
                Service and China’s Ministry of Agriculture for their support during our participation
                in the USDA-China Scientific Cooperation and Exchange Program during June 2014.
                Thanks also to ERS editor Susmita Pendurthi and ERS designer Curtia Taylor.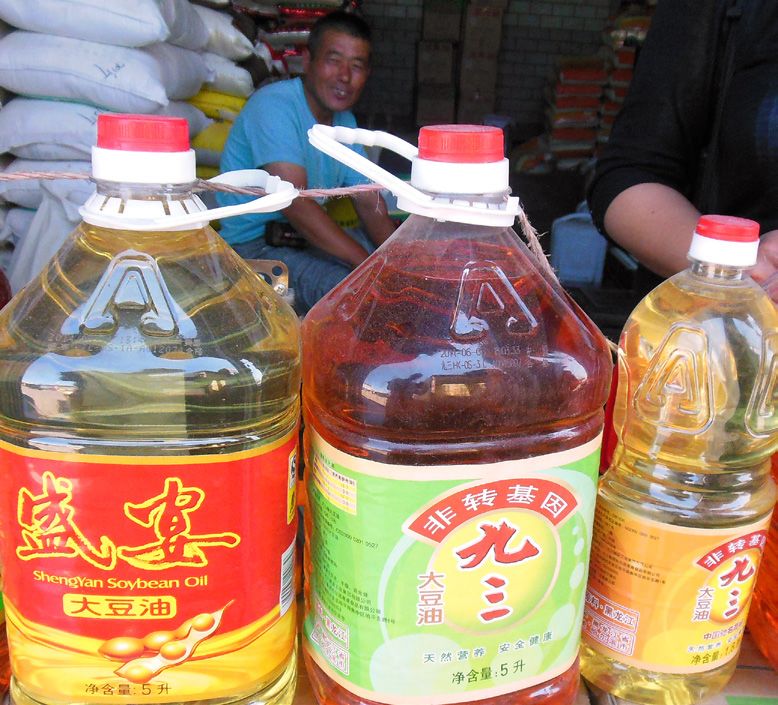
Contents

Summary.  .  .  .  .  .  .  .  .  .  .  .  .  .  .  .  .  .  .  .  .  .  .  .  .  .  .  .  .  .  .  .  .  .  .  .  .  .  .  .  .  .  .  .  .  .  .  .  .  .  .  .  .  .  .  .  .  .  .  .  .  .  .  .  .  .  .  .  . iii

Introduction. .  .  .  .  .  .  .  .  .  .  .  .  .  .  .  .  .  .  .  .  .  .  .  .  .  .  .  .  .  .  .  .  .  .  .  .  .  .  .  .  .  .  .  .  .  .  .  .  .  .  .  .  .  .  .  .  .  .  .  .  .  .  .  .  .  .  . 1

China’s Agricultural Imports Have Risen .  .  .  .  .  .  .  .  .  .  .  .  .  .  .  .  .  .  .  .  .  .  .  .  .  .  .  .  .  .  .  .  .  .  .  .  .  .  .  .  .  .  . 3

      U.S.-China Agricultural Trade Grew Rapidly. . . . . . . . . . . . . . . . . . . . . . . . . . . . . . . . . . . . . . . . 3

      The United States Is the Leading Supplier of Many Commodities to China. . . . . . . . . . . . . . . . . 4

      China Has Become a Consistent Grain Importer. . . . . . . . . . . . . . . . . . . . . . . . . . . . . . . . . . . . . . 7

      Policies Affect the Mix of Imports . . . . . . . . . . . . . . . . . . . . . . . . . . . . . . . . . . . . . . . . . . . . . . . . 8

      Meat and Dairy Imports Are Surging . . . . . . . . . . . . . . . . . . . . . . . . . . . . . . . . . . . . . . . . . . . . .  11

      Cotton Imports Are Volatile. . . . . . . . . . . . . . . . . . . . . . . . . . . . . . . . . . . . . . . . . . . . . . . . . . . . .  13

      Imports of Processed Food Products Are Increasing Rapidly. . . . . . . . . . . . . . . . . . . . . . . . . . .  14

Projections Anticipate Further Import Growth. .  .  .  .  .  .  .  .  .  .  .  .  .  .  .  .  .  .  .  .  .  .  .  .  .  .  .  .  .  .  .  .  .  .  .  .  . 16

China’s Strategy for Controlling Agricultural Imports .  .  .  .  .  .  .  .  .  .  .  .  .  .  .  .  .  .  .  .  .  .  .  .  .  .  .  .  .  .  . 19

Transparent Policies for Efficient International Markets. .  .  .  .  .  .  .  .  .  .  .  .  .  .  .  .  .  .  .  .  .  .  .  .  .  .  .  .  . 22

References .  .  .  .  .  .  .  .  .  .  .  .  .  .  .  .  .  .  .  .  .  .  .  .  .  .  .  .  .  .  .  .  .  .  .  .  .  .  .  .  .  .  .  .  .  .  .  .  .  .  .  .  .  .  .  .  .  .  .  .  .  .  .  .  .  .  .  . 24

Appendix 1.  .  .  .  .  .  .  .  .  .  .  .  .  .  .  .  .  .  .  .  .  .  .  .  .  .  .  .  .  .  .  .  .  .  .  .  .  .  .  .  .  .  .  .  .  .  .  .  .  .  .  .  .  .  .  .  .  .  .  .  .  .  .  .  .  .  .  . 30

Appendix 2.  .  .  .  .  .  .  .  .  .  .  .  .  .  .  .  .  .  .  .  .  .  .  .  .  .  .  .  .  .  .  .  .  .  .  .  .  .  .  .  .  .  .  .  .  .  .  .  .  .  .  .  .  .  .  .  .  .  .  .  .  .  .  .  .  .  .  . 32

                                                                                                            ii
                                                       China’s Growing Demand for Agricultural Imports, EIB-136
                                                                                 Economic Research Service/USDA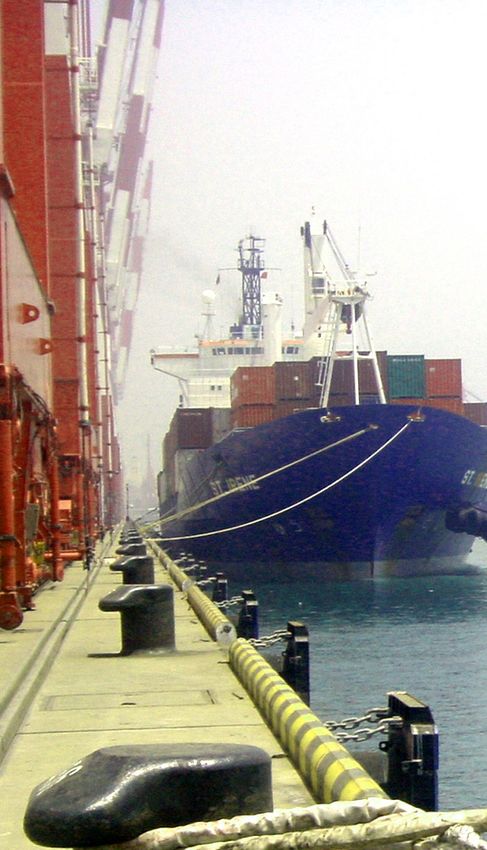
United States Department of Agriculture

                                                                     A report summary from the Economic Research Service                                  February 2015
               United States Department of Agriculture

 Economic
                      China’s Growing Demand for

                                                                      China’s Growing Demand for
 Research
 Service

 Economic
 Information
                      Agricultural Imports
 Bulletin
 Number 136

 February 2015
                      Fred Gale, James Hansen, and Michael Jewison

                                                                      Agricultural Imports
                                                                      Fred Gale, James Hansen, and Michael Jewison
  Find the full report
   at www.ers.usda.
   gov/publications/
    eib-economic-
 information-bulletin/
      eib136.aspx                                                      What is the Issue?
                                                                       China is playing an important role in global agricultural markets as it emerges from
                                                                       isolation, liberalizes its economy, and experiences rising living standards. Policymakers,
                                                                       analysts, researchers, and the public need information about China’s growing, multifac-
                                                                       eted role in agricultural markets. For example, what countries are the leading suppliers of
                                                                       China’s agricultural imports? What commodities is China importing, and what trends and
                                                                       patterns can be discerned? How do China’s current agricultural imports fit in its historical
                                                                       context? How have China’s policies responded to its increased role in global agricultural
                                                                       markets? Can import growth be sustained in the future or will it be limited by new policies
                                                                       and procedures?

                                                                       China’s capacity to meet new demands for agricultural products has been assessed by
                                                                       analysts inside and outside China since the 1980s. Economists have anticipated that market
                                                                       forces would induce China to import grains and other land-intensive crops, but Chinese
                                                                       officials (motivated by food security and other concerns) have long resisted these forces
                                                                       and sought to maintain self-sufficiency. However, officials are now adjusting their strategies
                                                                       to accommodate their country’s growing reliance on agricultural imports.

                                                                       What Did the Study Find?
                                                                       China’s 2001 accession to the World Trade Organization lowered barriers to agricultural
                                                                       imports, and its economic growth has generated new demands for agricultural commodi-
                                                                       ties. An agricultural trading relationship of mutual importance is developing between the
                                                                       United States and China. The United States accounted for over 24 percent of the value
                                                                       of China’s agricultural imports during 2012-13, a larger share than any other country.
                                                                       U.S. agricultural sales to China doubled from 2008 to 2012, reaching nearly $26 billion
                                                                       in annual sales. China has overtaken Japan, Mexico, and Canada to become the leading
   ERS is a primary source                                             export market for U.S. agricultural products.
  of economic research and
    analysis from the U.S.
 Department of Agriculture,                                            China’s agricultural imports reflect its relative scarcity of land resources, and its
  providing timely informa-                                            most prominent imports are oilseeds, oils, and cotton—products that have high land
tion on economic and policy
issues related to agriculture,                                         requirements per unit of output. China has become a net importer of grain, but its grain
  food, the environment,and

                                                                                                                                  www.ers.usda.gov
        rural America.
imports are still modest in comparison with its oilseed imports. China has also swung from net exporter to
net importer of corn and is importing large volumes of distillers’ dried grains, a byproduct of corn-based
ethanol production. While demand for animal feeds is an important factor in China’s agricultural import
growth, imports of meat and dairy products have also surged as rising costs of feed and forage, as well as
other constraints, limit the growth of domestic livestock output.
Demand for imported cotton and wool fibers as raw material for textile manufacturing has also risen. When
China stockpiled domestic cotton to support prices above world levels during 2011-13, cheaper imports of
cotton surged to meet textile demand.
While bulk commodities remain predominant in China’s agricultural imports, evolving consumer tastes
and increased purchasing power are stimulating demand for higher value products. Imports of wine, beer,
cheese, breads, cookies, extracts of coffee and tea, and ice cream are growing rapidly.
Projections by the U.S. Department of Agriculture (USDA) and several other sources anticipate continued
growth in Chinese agricultural imports through 2023. Soybeans are expected to continue as the dominant
import commodity, but imports of corn and meats are expected to rise as well. However, an unanticipated
surplus of corn that was evidenced in China soon after projections were made underscores the difficulty of
assessing China’s market.
Officials in China now acknowledge their country’s need for agricultural imports and are emphasizing agri-
cultural trade and investment in diplomacy. They are also formulating strategies to use domestic support
and border measures to prevent imports from dominating Chinese markets. However, interventions in
markets can create uncertainty that distorts prices and disrupts trade. On the other hand, policies that allow
market demand and supply to determine prices, combined with the consistent application of regulations and
standards, generally help global markets to supply demands efficiently.
How Was the Study Conducted?
The study is based on an analysis of China’s agricultural imports reported in Chinese customs statistics and
U.S. agricultural export data; it evaluates recent trends in data through calendar year 2013, as well as histor-
ical trends. The study also summarizes projections of Chinese agricultural imports through 2023 from four
sets of projections and summarizes Chinese policies on food security and agriculture based on information
from numerous Chinese documents, speeches, and news media reports.
www.ers.usda.govChina’s Growing Demand for
Agricultural Imports
Fred Gale, James Hansen, and Michael Jewison
Introduction
China’s demand for imported raw materials and foods is critical to any assessment of global agricul-
tural trade patterns. Industry and government leaders around the world have long anticipated China’s
important role in agricultural markets, but China’s import demand has evolved in unexpected ways
and remains difficult to predict.
China’s imports of grain and cotton surged as economic reforms began in the late 1970s (Surls,
1982). During the 1980s, Chinese leaders also discussed strategies for upgrading the Chinese diet by
boosting intake of animal protein, and they targeted industries that use agricultural raw materials for
expansion to create employment. Studies of changing food consumption patterns commissioned by
the Chinese Government during the 1980s anticipated significant deficits in grains, meats, and vege-
table oils by the end of the 20th century (China Mid- and Long-Term Food Development Strategy
Team, 1990; Ding, 1991).
During the 1980s and 1990s, international attention focused on China’s demand for agricultural
imports as the country emerged from isolation and allowed economic forces to allocate resources
(Crook, 1988; Yang and Tyers, 1989; Carter and Zhong, 1991; Garnaut and Ma, 1992). Brown (1995)
drew attention to China’s agricultural trade prospects by warning that China’s rising consumption of
animal protein and domestic resource limits would cause rapid growth in import demand and disrupt
global grain markets. China’s extended negotiations to join the World Trade Organization (WTO)—
finally completed in 2001—brought even more attention to the topic.
China’s accession to the WTO also generated additional projections, based on the principle of
comparative advantage, that China would import more land-intensive crops (e.g., cereal grains
and cotton) and export labor-intensive products (e.g., fruits and vegetables) (Anderson and Peng,
1998; Wailes et al., 1998; Lu, 1998; Huang et al., 1999; Chen, 2000; Carter and Li, 2002).1 Studies
seemed to form a consensus that China would import grain, but estimates varied widely; for
example, Crook and Colby (1996) reviewed a dozen projections of China’s grain imports for various
years in the 21st century that ranged from 15 million metric tons (mmt) to over 200 mmt.
While China’s gradual liberalization, rising living standards, and changing consumption patterns
have been the main forces driving its production and trade, growth has been somewhat hindered by
long-standing, deep-rooted preferences among Chinese officials for self-sufficiency. For example,
a white paper issued by China’s State Council (1996) called for China to remain at least 95 percent
1 The U.S. Department of Agriculture (USDA) anticipated that China’s WTO accession would create substantial
export opportunities for U.S. farmers that would increase demand and boost agricultural prices (Colby et al., 2000;
Lohmar et al., 2002).
1
China’s Growing Demand for Agricultural Imports, EIB-136
Economic Research Service/USDAself-sufficient in grain by raising farm productivity, ensuring that prices are high enough to give
producers strong incentives, reclaiming cropland, and utilizing crop straw and wastes to feed live-
stock. A number of studies noted that China’s future trade would be influenced by restrictions moti-
vated by self-sufficiency or other objectives (Crook, 1988; Yang and Tyers, 1989; Huang et al., 1999;
Gale, 2002). Carter and Rozelle (2001) outlined different future scenarios for China’s agricultural
trade and development depending on agricultural policy and institutional-reform choices taken by
Chinese leaders.
This tension remained after China’s accession to the WTO, which Chinese officials viewed as neces-
sary to create jobs and make further progress on market-oriented reforms, though they worried that
China’s farmers would be vulnerable to import competition (Han, 2011). Officials initiated plans
to restructure the agricultural sector, and they pledged to use WTO-compliant measures to support
farmers and insulate domestic industries from global market pressures (Niu, 2011).
In the years following WTO accession, China’s gross domestic product (GDP) and household
income grew rapidly, manufacturing and service industries absorbed large numbers of rural laborers,
and agricultural production grew rapidly. The structure of food consumption changed to include
more meat, dairy, and processed foods, much as the assessments during the 1980s predicted. China
achieved remarkable increases in domestic agricultural production, as well. Grain production rose
40 percent during 2003-13 and reached the 550-mmt target for 2010 set by the Chinese Government
(China State Council, 1996)—an achievement that China’s Minister of Agriculture attributed mainly
to policy support (Han, 2014).2 Yet output of some other commodities that received less policy
support also increased rapidly as producers responded to changing consumer demand. China’s meat
output increased by 32 percent, its milk output doubled, and its aquaculture production rose 50
percent during 2003-13.
Despite the increase in domestic output, China’s role as an agricultural importer has grown. Tensions
between market-driven resource allocation and the Chinese objectives of self-reliance continue into
the 21st century. Rising imports prompted adoption of a new food security strategy that allows for
imports to supplement China’s domestic food supplies, but advocates the use of domestic support
measures and trade barriers to keep the country self-reliant in food (Han, 2012; Han, 2013; Han,
2014). China’s demand for agricultural imports is growing rapidly, but potential suppliers face
obstacles and uncertainties (e.g., rejections of shipments, antidumping investigations, new require-
ments for exporters, opaque approval processes, and uneven application of inspection and quarantine
regulations and procedures).
This report profiles recent patterns of growth in China’s agricultural imports by summarizing
Chinese customs data and U.S. agricultural export statistics. The data portray an important agricul-
tural trading relationship between China and the United States and patterns of agricultural import
growth broadly similar to those predicted by studies in earlier decades. Projections suggest that trade
will continue to expand in a similar manner, but assessing China’s demand for imports remains diffi-
cult due to inconsistent application of regulations, market-distorting interventions, and a lack of data.
2 The Chinese State Council’s Development Research Center calculated that subsidies and other agricultural support
expenditures rose from 390 yuan per metric ton of grain produced in 2004 to 1,120 yuan per metric ton in 2012 (Han
and Jin, 2014). The 2012 value equaled $178 per metric ton at the official exchange rate.
2
China’s Growing Demand for Agricultural Imports, EIB-136
Economic Research Service/USDAChina’s Agricultural Imports Have Risen
China’s agricultural imports have risen dramatically in recent years, and the United States has
become the leading supplier of these imports. Though China’s import policies vary depending on the
commodity (and show a marked preference for prioritizing self-sufficiency in cereal grains), it has
been increasingly importing oilseeds, oils, cotton, grains, meat and dairy, and processed foods.
U.S.-China Agricultural Trade Grew Rapidly
China’s agricultural imports are of particular interest to U.S. farmers because the United States and
other countries with rich endowments of farmland are positioned to supply farm products to China
(where land is a relatively scarce factor of production). During the years immediately following
China’s WTO accession, annual U.S. agricultural exports to China surged from under $2 billion to
$5 billion in 2005.3
In recent years, growth in U.S.-China agricultural trade has accelerated, and the two countries have
become key trading partners in agricultural products. During calendar years 2012-13, U.S. exports
of agricultural products to China averaged $25.9 billion per year (fig. 1)—a tenfold increase from
the late 1990s. Sales to China doubled during 2004-08 and doubled again during 2008-12. The share
of U.S. agricultural exports going to China rose from 2 to 3 percent during the 1990s to 18 percent
during 2012-13, and China is now the largest overseas market for U.S. farm products (up from
number four in 2008) (table 1). U.S. imports of agricultural products from China rose at a slower
Figure 1
U.S. agricultural trade with China: 1990-2013
Billion dollars
30
Agricultural imports from China Agricultural exports to China
25
20
15
10
5
0
1990 91 92 93 94 95 96 97 98 99 2000 01 02 03 04 05 06 07 08 09 10 11 12 13
Source: USDA, Economic Research Service analysis of data from USDA, Foreign Agricultural Service, Global Agricultural Trade System.
3 This far exceeded the U.S. Department of Agriculture’s estimates that China’s accession to the World Trade Orga-
nization would boost U.S. agricultural exports by $900 million (Lohmar et al., 2002) to $1.6 billion (Colby et al., 2000)
annually.
3
China’s Growing Demand for Agricultural Imports, EIB-136
Economic Research Service/USDATable 1
Top destinations for U.S. agricultural exports, 2008 and 2013
Country/region 2008 Country/region 2013
bil$ bil$
Canada 16.3 China 25.9
Mexico 15.5 Canada 21.3
Japan 13.2 Mexico 18.1
China 12.1 Japan 12.1
European Union-28 10.1 European Union-28 11.9
Source: USDA, Economic Research Service analysis of data from USDA, Foreign Agricultural Service, Global Agricultural
Trade System.
pace, reaching $4.4 billion in 2013—agriculture is one of the few sectors where the United States
has a trade surplus with China.
All of China’s leading suppliers of agricultural imports are countries richly endowed with land
resources: the United States, Brazil, Australia, Canada, New Zealand, and Argentina. China has
been importing more agricultural products from many of these countries, but the United States
remains the leader (fig. 2).
The United States is also one of the top three markets for China’s agricultural exports (fig. 3) and
the only one of China’s leading agricultural export markets that is outside East Asia. However,
China’s agricultural exports have grown at a much slower pace than its agricultural imports (see box,
“China’s Agricultural Export Growth Diminishes”), and it has become a large net importer of agri-
cultural products.
The United States Is the Leading Supplier of Many Commodities
to China
China’s excess demand for agricultural imports has been channeled into a few commodities that
reflect rising consumer demand for vegetable oils, livestock products, and industrial raw materials.
The United States, with its abundant land resources, has a competitive advantage in many of these
products.
Soybeans, other oilseeds, and fats and oils represent nearly half of China’s agricultural import
value (fig. 4). Soybeans and other oilseeds are processed to extract oils, and the residual meal is
used as a high-protein animal feed ingredient. China also imports fats and oils that are refined and
manufactured into consumer oil products. China produces most of its own meat and dairy prod-
ucts, but imports of these products are also significant. The mix of agricultural imports is diver-
sifying as China’s purchases of fruits, nuts, cassava, sugar, wine, breeding stock, and processed
food imports rise.
During 2012-13, the United States accounted for over 24 percent of China’s agricultural imports by
value and was the leading supplier of its oilseeds, cotton, meat, cereal grains, cattle hides, distillers’
dried grains (mainly used for animal feed), and hay (table 2). The United States accounted for 36
percent of China’s oilseed imports, 42 percent of its grain imports, 30 percent of its cotton imports,
and 25 percent of its meat imports. Soybeans comprise nearly all of U.S. oilseed exports to China,
4
China’s Growing Demand for Agricultural Imports, EIB-136
Economic Research Service/USDAFigure 2
China agricultural imports, by supplying country, 2000-13
Billion dollars
30
United States
Brazil
25
Australia
Canada
20
New Zealand
Argentina
15
10
5
0
2000 01 02 03 04 05 06 07 08 09 10 11 12 13
Source: USDA, Economic Research Service analysis of China’s customs statistics reported by the Global Trade
Atlas (2014).
Figure 3
China's agricultural exports to leading destinations, 2000-13
Billion dollars
12 Japan South Korea
Hong Kong Vietnam
10 United States Malaysia
8
6
4
2
0
2000 01 02 03 04 05 06 07 08 09 10 11 12 13
Source: USDA, Economic Research Service analysis of China’s customs statistics reported by the Global Trade
Atlas (2014).
5
China’s Growing Demand for Agricultural Imports, EIB-136
Economic Research Service/USDABox: China’s Agricultural Export Growth Diminishes
China’s agricultural exports are chiefly labor-intensive, high-value (per unit of land) prod-
ucts that often require processing (Lu, 1998; Chen, 2000). U.S. imports from China include
farmed fish and shellfish, canned mandarin oranges, garlic, mushrooms, soybeans for food
use, apple juice concentrate, pet food, chicken feathers, noodles, tea, and spices (appendix 2).
While products from China comprise a small share of the U.S. food supply, some of China’s
agricultural products have gained a significant share of the U.S. market (Gale and Buzby,
2009). Food safety hazards, such as antibiotic residues in fish and shellfish and adulteration
of wheat gluten and dairy products, have also raised concerns.
China’s agricultural export growth came from a combination of cost advantage and
Government support. After WTO accession, officials in China formulated plans to boost
labor-intensive exports (Han, 2011). Chinese authorities aided food processors in attaining
internationally recognized certifications, and inspection and quarantine officials set up their
own certifications for food exporters (Gale and Buzby, 2009). For example, China’s apple-
juice-concentrate exports dominated the global market following an initiative to promote
apple production in western provinces, investment in processing, and assistance from inspec-
tion and quarantine authorities (Gale et al., 2009).
China’s agricultural export growth has slowed in recent years due to various reasons.
Certifications imposed higher costs on processors and farmers (Wang et al., 2009). Some
Chinese industry associations imposed minimum prices to prevent price competition among
exporters, which had prompted antidumping actions in overseas markets (Wang and Chen,
2011).1 Rising vegetable prices in China also prompted industry and Government officials to
place more attention on the domestic Chinese market (Gale et al., 2013). Additionally, a study
of tomato sauce exports found that labor intensity had become a disadvantage after wages
doubled during 2006-12 (Wang et al., 2013). The volume of tomato sauce exports peaked in
2009, and financial losses and plant closures were widespread in 2012.
However, agricultural officials in China continue to encourage exports. A program for
agricultural export industries gives grants, loans, and technical assistance to companies and
cooperatives that procure a commodity for processing and export from a base of farmers in
a particular area. The projects emphasize implementation of food safety measures, quality
standards, and developing brands and they include a variety of commodities (e.g., garlic,
tomato sauce, flowers, bamboo products, fish, honey, and sunflower seeds).
1A U.S. court found that a Chinese association’s minimum-price requirement for Vitamin C manufacturers
violated U.S. antitrust laws (Wall Street Journal, 2013).
6
China’s Growing Demand for Agricultural Imports, EIB-136
Economic Research Service/USDAFigure 4
China’s imports of food and agricultural products
Annual average 2012-13 (billion dollars)
Soybeans and oilseeds
13.1
Fats and oils 2.3
Cotton, wool, fibers 6.4
Hides, skins, furs 39.6
8.5
Meat and dairy
Grains and feeds
9.6
Fruits, vegetables, nuts
4.0
11.9
Sugar 13.4
Other food and agricultural products
Notes: Chart shows the value of China’s food and agricultural imports from all countries. The chart shows totals for
categories 01, 02, and 04 to 24 from the Harmonized System codes (the global classification system used for
customs statistics developed by the World Customs Organization), plus cotton, wool, hides, skins, and furs. Data
are for calendar years. Fish and forestry products are excluded. Grains and feeds include animal feeds, as well as
wheat and rice for human consumption. Cotton, wool, and animal hides are used as raw materials in the manufac-
ture of nonfood consumer products.
Source: USDA, Economic Research Service analysis of China’s customs statistics reported by the Global Trade
Atlas (2014).
and they are the most prominent U.S. agricultural export to China (averaging $14.1 billion during
the 2012-13 calendar years, more than half of the total export value of U.S. agricultural exports).
Soybeans are also the largest U.S. export of any type to China, accounting for about 11 percent of
the value of all U.S. exports to China.
China Has Become a Consistent Grain Importer
Chinese authorities place a high priority on self-sufficiency in grain, which is reflected in policies
encouraging domestic production and limiting imports. Despite China’s low per-capita endowment
of cropland, it remained a net exporter of cereal grains—mainly corn—from the late 1990s until
2007. Since 2008, China has become a consistent importer of grains, and exports have declined (fig.
5). However, its grain imports of 13 mmt during 2013 were still much less than its soybean imports
of 63 mmt.
During 2012-14, China’s grain imports included corn, wheat, and rice, which were the focus of
many of the 1990s analyses (fig. 6), as well as sorghum and barley. China consistently imported
barley—mainly as a raw material for beer manufacturing—since the 1990s. Barley imports varied
between 1.0 and 2.5 mmt each year from 2000 to 2013, with most coming from Australia, Canada,
7
China’s Growing Demand for Agricultural Imports, EIB-136
Economic Research Service/USDATable 2
U.S. share of China’s leading agricultural imports, 2012-13
Average Chinese U.S. share of
Item import value China’s imports U.S. rank
$ Billion Percent Number
All agricultural products 109.0 24 1
Soybeans and other oilseeds 40.6 36 1
Fats and oils 11.9 2 11
Cotton 10.1 30 1
Meat 5.0 25 1
Cereal grains 4.9 42 1
Dairy 4.2 10 2
Fruit and nuts 3.9 13 4
Wine and beverages 3.1 3 7
Cattle hides 2.6 53 1
Wool 2.7Figure 5
China is now a net importer of soybeans and cereal grains
Million metric tons
30
20
Grain exports
10
0
-10
Grain imports
-20
-30
-40
Soybeans net trade
-50
-60
-70
1982 84 86 88 90 92 94 96 98 2000 02 04 06 08 10 12
Notes: Cereal grains include wheat, rice, corn, barley, and sorghum. Net trade equals exports minus imports.
Source: USDA, Economic Research Service analysis of China Customs Administration (1984-1995) and the Global
Trade Atlas (2014).
Figure 6
China's net trade in grains, 2000-14
Million metric tons
Rice
25
Wheat
20 Barley
15 Corn
Sorghum
10
DDGS
5
0
-5
-10
-15
-20
-25
-30
2000 01 02 03 04 05 06 07 08 09 10 11 12 13 14
Notes: Net trade equals exports minus imports. Data are for calendar years. DDGS refers to distillers’ dried grains.
DDGS is not included in the traditional definition of grain since it is a byproduct of corn processing. However, it has
emerged as a major U.S. export to China that is now bigger than any single grain.
Source: USDA, Economic Research Service analysis of China’s customs statistics reported by the Global Trade Atlas
(2014).
9
China’s Growing Demand for Agricultural Imports, EIB-136
Economic Research Service/USDAon imports of soybean meal, DDGS, and other grain-milling byproducts to address deficiencies in
feed raw materials. During the years before and after WTO accession, the tariff on soybeans was
also lowered to 3 percent and quotas were eliminated on imports of soybeans and vegetable oil.
China, however, retained stricter control over the imports of cereal grains. In its WTO accession,
China agreed to tariff rate quotas (TRQs) for rice, wheat, and corn that allow limited quantities
of each commodity to flow into the Chinese market at low tariffs. Low tariffs of 1 percent are set
on imports up to the quota amount—set at approximately 5 percent of annual consumption—but
imports outside the quota are assessed high tariffs of 65 percent.
The TRQ system was intended to open a more transparent trade channel than the internal quota and
licensing systems previously used. However, Chinese authorities cite “management of TRQs” as
one of the measures used to regulate the flow of imports (Ni, 2011, p. 79; Ni, 2012, p. 112; Xi and
Yang, 2013, p. 446).5 Most of the corn and wheat quotas are reserved for state-designated trading
companies, and the remainder are distributed to thousands of potential importers in a cumbersome
application process once a year (see box, “Feed Executive Calls for Reform of Import Quota”).
Market analysts report that Chinese importers turned to DDGS, sorghum, and barley as alterna-
tives to corn because there is no import quota for these commodities (Jewison and Gale, 2012).
During 2014, news media reported that alleged problems with bribery in the distribution process had
Box: Feed Executive Calls for Reform of Import Quota
Liu Yonghao, the founder and chief executive of China’s largest feed company, has publicly
criticized the corn tariff rate quota (TRQ) system for favoring state-owned enterprises. In
2011, Liu criticized the TRQ system for reserving 60 percent of the corn import quota for
a few state-owned companies, while hundreds of private companies like Liu’s account for
95 percent of China’s feed output (Zhang, 2011). Liu pointed out that the quota distribu-
tion mechanism divides the private share of the quota among applicants in 31 provinces and
regions—just 90,000 tons per province. According to Liu, a single corn shipment has to be
at least 50,000 tons to be economically viable. Liu said his company was awarded less than 3
percent of the quota during 2010 although his company accounts for 9 to 10 percent of China’s
feed output. He said his company had to purchase a quota from a state-owned company that
year. Liu called for allocating quotas to companies based on the volume of feed they produce.
Concerns about the TRQ system grew as the gap between Chinese and international grain
prices widened during 2014, and Liu repeated his critique of the TRQ system at a meeting
that year (Xinhua News Service, March 2014). Industry publications also raised concerns that
the TRQ system placed small feed companies at a disadvantage (Guangdong Feed, 2014),
and that flour mills cannot access the special types of wheat needed for the breads and snack
foods that have become more popular in China (Zhengzhou Wholesale Grain Market, 2014).
5 Weihai Evening News (2014) revealed that a Municipal Development and Reform Commission office distributed
quotas for 22,700 metric tons of four commodities among six local companies and the office monitored market condi-
tions to advise recipients when the quotas should be used.
10
China’s Growing Demand for Agricultural Imports, EIB-136
Economic Research Service/USDAprompted China’s National Development and Reform Commission to consider using other methods
to distribute the quotas (Shanghai Pobo Financial News, 2014).
China’s domestic support has also focused on grains, including direct payments based on area
planted in grain; support prices for rice, wheat and corn; and transfer payments to major grain-
producing counties (Gale, 2013). Price supports were introduced for soybeans, rapeseed, and cotton,
but persistently higher returns for grains resulted in land shifting to grain. China’s Minister of
Agriculture asserted that Government policies produced 10 consecutive increases in grain produc-
tion during 2003-13 (Han, 2014).
China’s corn imports were disrupted during 2013-14 when inspection and quarantine officials
began rejecting U.S. corn shipments containing a genetically modified corn variety that agricul-
tural officials had not approved. The rejections began in November 2013 and continued until the
variety was approved in December 2014. By mid-2014, officials said they had rejected 1.25 mmt
of corn shipments. During July and August of 2014, Chinese authorities also issued instructions to
customs officials to closely scrutinize sorghum and barley imports for a variety of potential problems
(AQSIQ, 2014; Niu and Patton, 2014). Officials also began to check DDGS and alfalfa shipments
for unapproved genetically modified varieties, and uncertainty about Chinese approval of shipments
continued throughout 2014.
Meat and Dairy Imports Are Surging
Most of the 1990s assessments of China’s commodity demand anticipated that China would import
feeds to support a growing livestock herd. Now China’s imports of livestock products are also rising.
China’s imports of meat and animal offal rose to over 2.5 mmt during 2013 (fig. 7). Pork meat and
offal are the largest types of meat imported. Pork imports first surged during 2007-08, a period of
tight supplies and soaring prices following a swine6 disease epidemic in China, and pork imports
rose further as Chinese pork prices climbed during 2011-13. China also became a significant
importer of beef and mutton during 2013 as domestic prices for these meats soared.7 China’s poultry
imports, on the other hand, fell in 2010 following an antidumping action against U.S. poultry.8
China’s imports of dairy products grew more than fourfold from 2008 to 2013, reaching 1.6 mmt
(fig. 8).9 About half of the imports consist of milk powder used to manufacture infant formula and
other milk products, while whey is used in various processed food and animal feed products. China
has also become a significant importer of other types of dairy products like cheese, butter, butter-
milk, and yogurt.
Rising demand, slow growth in domestic supply, and growing costs of feed, labor, and land are
pushing domestic meat and dairy prices higher, which makes imported meats more competitive in
China. China’s retail prices for beef and mutton rose 85 percent during 2009-13, while pork and
poultry prices rose about 30 percent. Chinese livestock production is also shifting from traditional
6 Swine refers to animals; pork refers to their meat.
7 China has banned imports of U.S. beef since 2003, when a case of bovine spongiform encephalopathy occurred in
the United States.
8 The dip in China’s poultry imports during 2004-05 was the result of an avian influenza epidemic that depressed
domestic consumption and prices. China also banned imports from some countries during that period.
9 Imports are on a product-weight basis, not milk equivalent.
11
China’s Growing Demand for Agricultural Imports, EIB-136
Economic Research Service/USDAFigure 7
China's meat imports and exports, 2000-13
Million metric tons Imports
Mutton
3.0 Beef
Pork meat and offal
2.5 Poultry meat and offal
2.0
1.5 China's meat exports
1.0
0.5
0.0
2000 01 02 03 04 05 06 07 08 09 10 11 12 13
Source: USDA, Economic Research Service analysis of China’s customs statistics reported by the Global Trade Atlas
(2014).
Figure 8
China's dairy imports, 2000-13
Million metric tons
1.8
Cheese, butter, Whey Skim milk Whole milk
1.6 other milk powder powder
1.4
1.2
1.0
0.8
0.6
0.4
0.2
0.0
2000 01 02 03 04 05 06 07 08 09 10 11 12 13
Source: USDA, Economic Research Service analysis of China’s customs statistics reported by the Global Trade Atlas
(2014).
12
China’s Growing Demand for Agricultural Imports, EIB-136
Economic Research Service/USDAsmall-scale, backyard production to larger scale, concentrated modes of production. Larger scale
farms tend to use commercial feeds and have higher fixed costs, and they face challenges acquiring
land and managerial talent. Livestock farms are also facing higher costs from more stringent
enforcement of environmental and food safety regulations, including a new regulation on hog-farm
waste disposal that took effect in 2014.
Imports of animal breeding stock also reflect the influx of commercial-scale livestock farms in
China. The value of live animal imports was in the range of $40 to $50 million annually during
1995-2002, but it exceeded $400 million in 2013. Cattle accounted for 60 to 70 percent of live
animal imports from 2009 to 2013 as new dairy operations stocked their farms with imported
animals. Imports of poultry, swine, and other animals also increased rapidly in recent years; most of
these are hybrids supplied by animal genetic companies to stock breeding farms.
However, China’s feed imports still exceed imports of livestock products. One reason is the coun-
try’s tariff structure, which favors imports of feeds over imports of meat and dairy products. China’s
tariffs on feed ingredients range from 1 to 9 percent, while tariffs on dairy and meats range from
10 to 25 percent (table 3). China’s 2008 free trade agreement with New Zealand leveled the tariff
bias against livestock imports to some degree by cutting tariffs on New Zealand milk powder and
unboned sheep meat to 5 percent in 2013. The agreement will eventually phase out tariffs on both
products—New Zealand is now the leading exporter of milk powder and sheep meat to China.
Cotton Imports Are Volatile
China’s industrial growth has also contributed to demand for imported cotton, wool, and animal
hides. Demand for these raw materials is driven by similar forces—demand for exports and
domestic sales of manufactured goods—but cotton imports have been much more volatile than
imports of wool and animal hides.
Imports of wool and animal hides rose at a steady pace and were both near $3 billion by 2013.
Cotton imports, however, soared to nearly $5 billion in 2006, plunged to $2 billion in 2009, and
soared again to $11.8 billion during 2012 (fig. 9).
Table 3
China’s tariffs on feeds, meats, and dairy
Feed ingredients Tariff Dairy and meats Tariff
Percent Percent
Corn* 1 Milk powder and butter 10
Sorghum 2 Frozen pork, poultry, and beef 12
Soybeans 3 Frozen mutton 15
Distillers’ dried grains** 5 Sausage 15
Soybean meal 5 Chilled pork 20
Alfalfa 9 Smoked or salted meat 25
*Within a quota of 7.2 million metric tons annually; over-quota tariff is 65 percent. **Exempt from value-added tax.
Source: USDA, Economic Research Service analysis of China’s WTO accession tariff schedule from the World Trade
Organization (2001) and China’s Ministry of Finance (2001).
13
China’s Growing Demand for Agricultural Imports, EIB-136
Economic Research Service/USDAFigure 9
Agricultural imports used as manufacturing raw materials
Billion dollars
14
Cotton
12 Wool
Hides and skins
10
8
6
4
2
0
1995 96 97 98 99 2000 01 02 03 04 05 06 07 08 09 10 11 12 13
Source: USDA, Economic Research Service analysis of China’s customs statistics reported by the Global Trade Atlas
(2014).
China is now the world’s leading producer of cotton and the largest importer. China’s cotton imports
surged in response to growing textile output in the years after its WTO accession. China’s textile
exports and its cotton imports grew further after 2004, when the end of the global Multi Fibre
Arrangement10 removed the quotas on textile imports that had previously constrained China’s textile
exports to its major markets. China’s cotton imports fell during a global economic slowdown in
2009, but they rebounded to record-high levels during 2011-13 as a cotton price-support policy held
China’s domestic cotton price far above the world price (Gale, 2013). Chinese authorities reported
stockpiling nearly 16 mmt of cotton over 3 years from the domestic crop, while textile manufacturers
seeking cheaper raw materials purchased record volumes of imported cotton.
Imports of Processed Food Products Are Increasing Rapidly
While bulk commodities and generic products used as raw materials for processing are still predom-
inant, higher value foods and beverages comprise a rapidly growing share of China’s agricultural
imports. Imports of higher value items are increasing rapidly as living standards rise and the prolif-
eration of food service and modern retail outlets creates new markets for such products.
The most prominent example is wine. China’s imports of wine totaled $1.5 billion in 2013, a four-
fold increase from 2008. France has traditionally been the predominant supplier, accounting for
45 percent of wine import value in 2013, while the United States accounts for about 5 percent of
China’s wine imports. China’s imports of brandy, whiskey, and other spirits also exceeded $1 billion
in 2013, while beer imports totaled $232 million.
10 An international agreement set by the General Agreement on Tariffs and Trade, which expired after 2004.
14
China’s Growing Demand for Agricultural Imports, EIB-136
Economic Research Service/USDAImports of many other consumer-oriented food products are making inroads. For example, imports
of cheese, cookies, breads and pastries, extracts of coffee and tea, and ice cream were negligible in
the early 2000s but their value grew until interrupted by China’s economic slowdown in 2008-09.
The value of these imports grew more than threefold during 2009-13, and their combined value was
$764 million in 2013 (fig. 10).
Figure 10
China's imports of selected processed food products, 2000-13
Million dollars
250
Cheese
Cookies
200 Bread and pastries
Extracts of coffee and tea
Ice cream
150
100
50
0
2000 01 02 03 04 05 06 07 08 09 10 11 12 13
Notes: Harmonized System codes (the global classification system used for customs statistics developed by the World
Customs Organization) used for these categories are cheese (0406), cookies (190531), bread and pastries (190590),
extracts of coffee and tea (2101), and ice cream (2015).
Source: USDA, Economic Research Service analysis of China’s customs statistics reported by the Global Trade Atlas
(2014).
15
China’s Growing Demand for Agricultural Imports, EIB-136
Economic Research Service/USDAProjections Anticipate Further Import Growth
USDA projections for 2014-23 anticipate a continuation of China’s recent trends in agricultural
trade. The projections are based on models of agricultural supply and demand that reflect changing
consumption patterns tied to income growth, rising crop yields, and limited cropland area.
Despite rising wages and other costs, China is expected to remain the leading textile manufacturer
and the key buyer of cotton in global markets. China will remain a relatively modest rice importer,
while its wheat imports will rise to fill deficits in the types of wheat not widely grown in China (and
which are needed for certain breads and processed foods).
The projections indicate that China will increase production of pork and poultry—the main
consumers of commercial feeds—by a combined 15 mmt over 10 years, and imports of these meats
will also rise modestly. The rising feed requirements of swine, poultry, and other livestock, however,
are difficult to assess since the dietary needs of animals can be met through various commodities,
a wide range of production practices are used in China, and information on supply and demand of
both livestock and feed resources is often unavailable or unreliable.
The USDA projections anticipate that China will increase its imports of soybeans and feed grains
to support rising domestic meat production. Expansion of ruminants—beef, dairy cattle, and
sheep—is expected to put pressure on grasslands and forage resources, and China’s increasing live-
stock numbers will require greater volumes of feed to supply energy, protein, and micronutrients.
The need for protein in animal diets is a key consideration behind USDA’s projections of continued
robust growth in soybean imports. Liberalization of soybean meal and soybean imports during the
1990s eased a constraint on China’s livestock production by supplying high-protein feed ingredi-
ents. The meal left over after extracting oil from soybeans will continue to be the primary source of
protein to support growth in animal numbers over the next decade.
China is also expected to continue expanding corn production by increasing planted area and
improving yields. However, the consumption of corn for feed, processed foods, and industrial prod-
ucts is expected to outpace supply capacity over the next decade. The supply of alternative feeds like
brans and hulls of wheat and rice, tubers, and food wastes that traditionally supplied a significant
share of energy to China’s livestock is likely to grow only marginally. Thus, increased livestock
output will rely on corn to a greater degree than in past decades.
Several other projections released during 2014 reflect a similar outlook of rising living stan-
dards and increased imports of major agricultural commodities (table 4). Ten-year projections
by the Organization for Economic Co-operation and Development and the Food and Agriculture
Organization of the United Nations (OECD/FAO), China’s Academy of Agricultural Sciences
(CAAS), and China’s Research Center for Rural Economy (RCRE) all anticipated increases
of varying magnitude in China’s imports of corn, soybeans, and meat. USDA and OECD/FAO
projected continued growth in soybean imports, but CAAS and RCRE projected modest increases
that imply an abrupt slowdown in soybean import growth. A World Bank assessment (2014) also
discussed the role of livestock products in China’s dietary changes, as well as constraints on
domestic supply response, and reported results of projections by the Center for Chinese Agricultural
Policy that showed growing imports of soybeans, corn, and milk for 2020 and 2030.
16
China’s Growing Demand for Agricultural Imports, EIB-136
Economic Research Service/USDATable 4
Projections of China’s imports of selected commodities in 2023
China Academy of China Research Center
Commodity USDA OECD-FAO Agricultural Sciences for Rural Economy
Million metric tons
Rice 2.4 2.4 2.3 1.8
Wheat 5.5 2.8 3.1 5.7
Corn 22.0 16.9* 12.0 18.0
Soybeans 112.0 81.5* 74.0 75.0
Meat 2.4 3.6 2.4 NA
Cotton 4.6 3.3 1.6 3.0
*OECD-FAO’s corn projection is for all coarse grains; soybean projection is for all oilseeds. NA=Not available.
Notes: OECD/FAO refers to the Organization for Economic Co-operation and Development and the Food and Agriculture
Organization of the United Nations.
Sources: USDA, Office of the Chief Economist, 2014; OECD-FAO, 2014; China Academy of Agricultural Sciences, 2014; Xu
et al., 2014.
All of the projections expected China’s imports of corn to rise beyond the country’s 7.2-mmt tariff-
rate quota for corn, implying that demand would be strong enough to prompt officials to install
a mechanism to facilitate over-quota imports. However, soon after the projections were made,
an unanticipated corn surplus in China became evident, suggesting that demand growth is not as
rigid as presumed and underscoring the difficulty of assessing China’s market (see box, “China’s
Unanticipated Corn Surplus”).
17
China’s Growing Demand for Agricultural Imports, EIB-136
Economic Research Service/USDABox: China’s Unanticipated Corn Surplus
China’s emergence as a net corn importer, and robust demand growth during 2011 and 2012,
influenced projections of its future corn imports by analysts (including those in China). Food
security assessments formulated by Chinese officials during those years also anticipated a
growing deficit between corn supply and demand (Han, 2012; Ni, 2013; Han and Jin, 2014).1
However, soon after these projections of growing corn imports were made, it became evident
that China actually had a large surplus of corn. China had record crops in 2012 and 2013 while
there were indications that domestic consumption of corn had slowed. The United States also
had a record corn crop following 2 successive years of drought, causing U.S. corn prices to
fall, while China raised its support price for corn. Thus, a large gap between Chinese and U.S.
corn prices appeared in 2013.
Authorities in China purchased 70 mmt of domestic corn to maintain the support price during
2013/14. Officials announced that corn reserves grew to 100 mmt—approximately 50 percent
of annual consumption. During 2014, authorities held auctions to release 63 mmt of corn from
reserves into the domestic market, but only 25 mmt were actually purchased. Chinese authori-
ties also announced that they would buy corn from the 2014 harvest to support prices, and
market analysts anticipated that this would add even more to the corn inventory.2
It could take years for China to dispose of such large surpluses. With high Chinese prices,
producers still had strong incentives to produce corn. The large corn surplus cast doubt on
the consensus view that China would import large volumes of corn. This is not the first time
a sudden change in market conditions altered assessments of China’s supply and demand. A
similar glut of grain appeared between 2000 and 2002, resulting in USDA’s projected impact
of China’s WTO accession on U.S. agricultural exports being scaled back from $1.6 billion
annually (Colby et al., 2000) to $900 million (Lohmar et al., 2002).
1 The report by Han and Jin (2014) is based on data from 2012.
2 An official in one of China’s leading corn-producing provinces said that most of the corn was stored in
crude temporary bins where it was vulnerable to mold and pests (Jingji Cankao Bao, 2014). In October 2014, a
Vice Premier raised concerns about the lack of storage for the new crop (China Government Net, 2014).
18
China’s Growing Demand for Agricultural Imports, EIB-136
Economic Research Service/USDAChina’s Strategy for Controlling Agricultural Imports
Chinese officials are formulating plans and strategies to gain control over growing agricultural
imports. These strategies imply extensive Government intervention that could lead to conflict and
pose potential challenges for U.S. industry leaders and policymakers. Chinese leaders have made
agricultural trade and investment a significant component of diplomacy, an initiative that mixes
commercial and political objectives and further increases the role of Government officials in agricul-
tural trade (Xinhua News Service, July 2014).
Chinese officials acknowledge the inevitability of international trade and its benefits and risks. The
Development Research Center of China’s State Council estimates that China’s imported vegetable
oils and oilseeds already utilize over 50 million hectares of land overseas, and they anticipate
that China will need to import more feed grains in coming decades (Han, 2012). A Vice Minister
of Agriculture noted that rising agricultural trade reflects the benefits of specialization based on
comparative advantage but he also warned that pressure from imports can threaten China’s control
over its food supply (Niu, 2013).
During 2013, the Chinese leadership set forth a new food security strategy that was reiterated in
the Communist Party’s 2014 “Number One Document” on rural policy. The strategy acknowledges
that imports are likely to increase due to changing diets, the growing role of livestock products, and
limited endowments of land and water, but it asserts that China must take the initiative to ensure that
domestic supplies will be China’s primary food source (Han, 2013; Han, 2014; Han and Jin, 2014).
The food security strategy calls for retaining Chinese control over the country’s food supply by:
• Boosting domestic production capacity through investments in irrigation and other infrastruc-
ture, science and technology, and strong policy support, and
• Utilizing international markets and overseas resources in a way that ensures a dominant role for
Chinese companies in the supply chain for imported commodities.
The food security strategy focuses on cereal grains, but its principles of self-reliance guide policy for
other agricultural commodities as well.
While Chinese officials view agricultural imports as necessary and have endorsed a decisive role for
the market, they appear to distrust international markets. Officials characterize agricultural markets
as distorted by trade barriers, subsidies in other countries, and monopoly power exercised by multi-
national companies, and they raise concerns about risks introduced by climate change, biofuels,
speculation in commodity markets, and export bans (Ni, 2011; Ni, 2012; Niu, 2013). In an article
explaining the food security strategy, China’s Minister of Agriculture asserted that the volume of
global grain exports is insufficient to meet China’s potentially large needs (Han, 2014). The food
security strategy is strongly influenced by the perceived dominance of imports and foreign compa-
nies in China’s soybean industry, which has been described as a potential threat to the country’s
soybean supply (Niu, 2013). Many of the measures advocated are designed to prevent such domi-
nance from occurring in other sectors.
Officials call for limiting imports to a supplementary role in the food supply, similar to the view of
imports articulated in the 1996 white paper “The Grain Issue in China.” The Minister of Agriculture
asserted that imports could fill market niches or gaps in domestic supply—such as importing high-
19
China’s Growing Demand for Agricultural Imports, EIB-136
Economic Research Service/USDAYou can also read