Whanganui District Council Sport & Recreation Strategy - Facilities - January 2016 - Sport NZ
←
→
Page content transcription
If your browser does not render page correctly, please read the page content below
Whanganui District Council
Sport & Recreation Strategy - Facilities

                             Prepared for

                                       By

                              January 2016
Acknowledgements
The authors wish to thank all of the individuals and organisations that participated in the consultation process and
giving feedback to date, particularly the volunteers who participated. In preparing this report significant support was
received from Sport Whanganui and Whanganui District Council (WDC). The authors wish to acknowledge the work
of Adam Gosney, Jimmy Hildreth, Keith Smith and other staff and thank them for their support.

                                                   Report Disclaimer

In preparing this report it has been necessary to make a number of assumptions on the basis of the information
supplied to Global Leisure Group Limited in the course of investigations for this study. The recommended actions
contained in this report are subject to uncertainty and variation depending on evolving events, but have been
conscientiously prepared based on consultation feedback and an understanding of trends in sport and recreation
facility provision.
The authors did not carry out an audit or verification of the information supplied during the preparation of this report,
unless otherwise stated in the report. Whilst due care was taken during enquiries, Global Leisure Group Limited
does not take any responsibility for any errors nor mis-statements in the report arising from information supplied to
the authors during the preparation of this report.

                                                             Authors

David Allan and Rob Kennedy

Contact:

Global Leisure Group Limited
PO Box 2147
Stoke
Nelson
Davea@glg.nz

Whanganui Sport & Recreation Strategy (Stage 2 Sporting Facilities): Global Leisure Group                               i
Contents
1.          Executive Summary                                                                    1
2.          Recommendations                                                                      2
3.          Introduction                                                                         4
     3.1.    Study Objectives                                                                     4
     3.2.    Agreed Deliverables                                                                  4

4.          Environment Scan                                                                     5
     4.1.    Demographics                                                                         5
     4.2.    Household income levels                                                              5
     4.3.    Age profile of the district                                                          5
     4.4.    Ethnic profile of district                                                           6
     4.5.    Population projections                                                               7
     4.6.    Summary of environment scan                                                          7
     4.7.    National and Regional context                                                        8

5.          Current network of sporting facilities                                               9
6.          Current facility assessment                                                          11
7.          Future demand based on sports participation and trends                               12
     7.1.    Key findings for Adults                                                             12
     7.2.    Key findings for Young people                                                       14
     7.3.    Commentary of national participation trends                                         14
     7.4.    Demand based on barriers to participation                                           15
     7.5.    Future demand based on membership trend of user groups                              15

8.          Current issues with facility provision                                               17
     8.1.    Indoor and Outdoor courts or modified playing surfaces                              17
     8.2.    Water ways and aquatic sports                                                       18

9.          Benchmarking comparisons based on population                                         19
     9.1.    Indoor court provision (WDC owned)                                                  19
     9.2.    Indoor Court Provision (high Schools)                                               19
     9.3.    Combined provision of indoor courts                                                 20
     9.4.    Benchmark of current indoor provision                                               20
     9.5.    Aquatic Pool provision (council owned)                                              20

10.         Summary of sporting facility provision                                               22
11.         Proposed Investment Strategy                                                         23
     11.1.    Decision Framework and Key Concepts                                                24
     11.2.    Strategic Goal and outcomes                                                        24
     11.3.    Principles for the provision of facilities                                         25
       11.3.1. Development Principles                                                       25
       11.3.2. Investment Strategy Principles                                               26
     11.4.    Development rationale                                                              27
     11.5.    Management                                                                         32

12.         Implementation Priorities                                                            33
13.         Appendix                                                                             39
     13.1.     Hockey Participation                                                              39
     13.2.     Glossary of terms used in this Strategy:                                          39

Whanganui Sport & Recreation Strategy (Stage 2 Sporting Facilities): Global Leisure Group         ii
1. Executive Summary
The general consensus of key stakeholders was that the Whanganui district needed a Sport and Recreation
Strategy completed. This reflects the Sport New Zealand (Sport NZ) guide for Territorial Authorities (TA’s)1 in
making decisions on their sporting infrastructure that stated;
Development of a sport and recreation strategy, aligned with the TA long-term and annual plans, is essential for
defining the TA’s vision, mission, approach, outcomes, focus and priorities for sport and recreation”
The Whanganui District Council (WDC) contracted Sport Whanganui (SW) to undertake preparation of the Sport
and Recreation Strategy. Global Leisure Group (GLG) were commissioned by SW to deliver a report for stage one
of the overall project that covers WDC owned sport and recreation facilities plus other significant facilities that
support the wider sporting network.
The Whanganui district commonly reflects the development of facilities nationally in the 1960’s and 1970’s to
support social infrastructure2. Council currently provides a wide-ranging and diverse supply of sporting facilities that
includes an uncovered cycling velodrome, all-weather athletics track, indoor and outdoor pool facilities. Additional
facilities are provided by sports themselves, by the Wanganui Community Sports Centre Incorporated (Springvale
and Jubilee Stadiums) and by private and state schools. These facilities include Wanganui Gymnastics Centre, two
Hockey turfs and outdoor netball courts. The indoor stadiums provide for core sports of Basketball, Table Tennis,
Badminton, Volleyball, Bowls and an International level Inline Skating rink. The management of the sporting and
recreational facilities in the district is that of a mixed model. The organisations that make-up the bodies managing
operational contracts on behalf of council are;
Sport Whanganui for operation of the Splash Centre
Wanganui Events Trust (WET) for Cooks Gardens
Wanganui Community Sports Centre Incorporated for the Springvale and Jubilee Stadiums
Wanganui East Pool Trust for the Wanganui East Outdoor Pool
The Wanganui Boys and Girls Club also has a “licence to occupy” which means they are responsible for any
maintenance and improvements for all the assets they manage. Historically, the mixed model of facility
management appears to be one that has developed organically over time rather than a strategically planned
process. As with all the other procurement choices, there are advantages and disadvantages with a mixed facility
management model, but nevertheless it is a legitimate choice for TAs to make. It may depend on the number of
sport and recreation facilities they own and their aspirations for each of those facilities.
WDC currently places an estimated value of $25 million on its sport and recreation facilities that it owns and this is
not replacement value. Council has an annual operational budget of $4.7 million to deliver sport and recreation
services to the community.3 This is forecasted to rise to nearly $7 million in operating costs by 2025 4, given that
the population growth is currently static and predicted to decline over the next 16 years5 Council needs to ensure
that its sporting network is of appropriate capacity, “fit for purpose” and financially sustainable. Generally the facility
stock in Whanganui is over 40 years of age, in particular Springvale Stadium and Wanganui East Pool both built in
the 1960’s and in terms of their lifecycle would be considered “aging”. Sport NZ identifies that facilities built before
1975 are considered "high risk" for on-going repairs and maintenance due to their age and may potentially need
large-scale investment (if there is sufficient current demand for their services).
The District has one public indoor court per 14,000 residents excluding the Jubilee Stadium (which has been omitted
from estimations due to its specialized activities including inline skating); this is 50% more provision than the
national average of one court per 21,000 residents. When comparing high school indoor courts provision, the District
1
Territorial Authority Sport and Recreation Facilities Decision Guide 2013
2
Key Findings National Facility Strategies for Indoor and Aquatic Sport 2013/14
3
WDC estimated operational budget 2014-2015
4
Whanganui District Council 10-Year Plan 2015-2025
5
Statistics NZ Area of Population Projections 2006-2031
Whanganui Sport & Recreation Strategy (Stage 2 Sporting Facilities): Global Leisure Group 1has 6,000 residents per court compared with 14,000 per court nationally, again manifestly more provision than the
national average. This equates to four indoor courts above the national average based on population. With 10
indoor courts (public and school combined but excluding Jubilee) in the district, the district has more than enough
provision compared with national average benchmarks.
The provision of Council pool water space also compares favourably with national benchmarks by providing
1,348m2 of water space, which equates to 32 people per m 2 of available space. This compares positively with the
national average of 47 people per m 2 of council owned pools and indicates an adequate level of supply in
comparison with other regions nationally. This provision is not all year round with Wanganui East Swimming Pool
being seasonal.
Overall, given the analysis of the districts sporting facility network the main issues for Council (as main asset owner)
and the Wanganui district in general are:
Plentiful provision of indoor court space compared to national benchmarks
Fewer projected participants for the indoor court facility stock given declining and aging population
Significant liabilities for asset owners due to aging facilities
Multiple facility operators leading to undue complexity
Plethora of lease and sub-lease arrangements leading to undue complexity
Limited human resources at Council for dealing with sporting facility assets
Limited performance measures and monitoring of operators to ensure “best value” for community and
Council’s return on investment.
The following recommendations are to assist Council in making informed decisions on the future of facility provision
in the District that include short, medium and longer-term timeframes for financial and planning purposes. These
recommendations have been assessed using the Sport New Zealand (Sport NZ) decision framework 6 and key
concepts and principles to ensure “best value” is achieved for asset owners and the communities these facilities
serve.
2. Recommendations
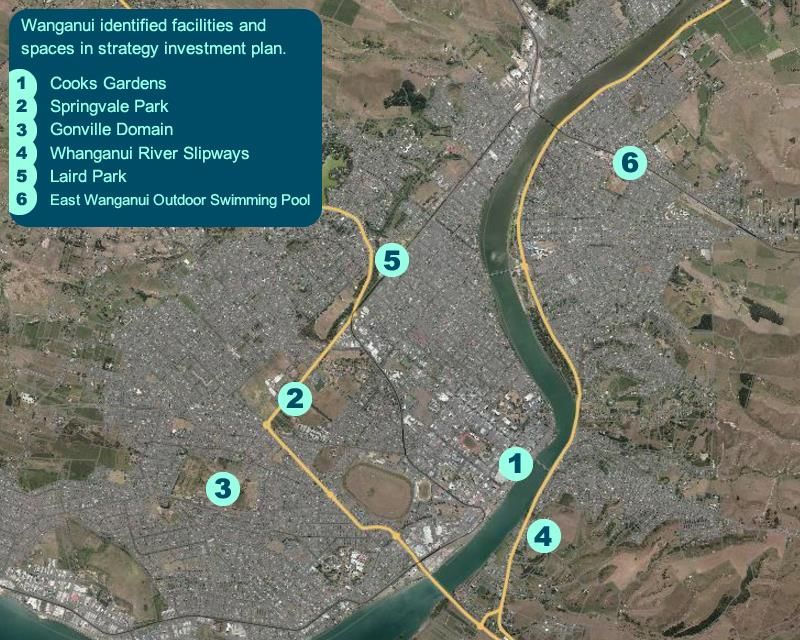
1. Creation of a community sports “hub” at Springvale Park to optimise and enhance the current cluster of
facilities on the Park. This development would integrate the current facilities on the park and link with
nearby schools to create “Whanganui’s home of community sport”.
2. Develop a new building to link the two Stadiums and provide an administration hub for sport and other
community organisations including reconfiguring a new main entrance and reception for visitors to the
Springvale Park site.
3. Enlarge health & fitness provision at Springvale, as there is a strong growth trend from Sport NZ data
nationally.
4. The “Gym and Swim” option at the Splash Centre would still be available and should be developed to
become a wider “Home of Sport” pass to be used across all of the sports hub facilities
5. Relocate Wanganui Netball Centre to Springvale Park to enable co-location of indoor and outdoor netball
utilising the existing indoor court space and support facilities plus develop 6-9 outdoor courts adjacent to
the Stadiums.
6. Establish the indoor cricket nets in the Jubilee Stadium mezzanine area (built for future seating provision
but unused for this purpose)
6
Better Value from New Zealand Sporting Facilities: The New Zealand Sporting Facilities Framework 2014
Whanganui Sport & Recreation Strategy (Stage 2 Sporting Facilities): Global Leisure Group 27. Relocate hockey from the aging Gonville turf to be in closer proximity to a second turf such as a secondary
school with an all weather turf – creating a Centre of Hockey for Whanganui.
8. Gonville Park could change its focus from a hockey artificial turf facility to a more multi-code all-weather
training facility (e.g. Futsal, Ki O Rahi, football, rugby and rugby league).
9. A longer-term option could be the relocation of tennis to the Springvale hub when the courts are in need
of a major renewal. Some of these courts could be covered but a detailed feasibility study would be needed
to assess financial viability.
10. There are aspirations to cover the outdoor Velodrome and this needs further investigation through a
detailed feasibility study to identify the viability or otherwise of a covered Velodrome and how it would
potentially “fit” into the wider national facility hierarchy.
11. A governance and management review is undertaken to clearly identify the best structure and the priorities
for the organisation managing and operating Cooks Gardens on behalf of Council.
12. Investigate viability of modification of the corporate boxes at the Westpac Stadium to provide more
flexibility for function and meeting hire opportunities.
13. Investigate development of a river based water sports and tourism hub as part of the town centre
regeneration project and subsequent master plan at Moutoa Quay along the Town Wharf centred on the
former Chronicle Newspaper office and paper store buildings and possibly include the building at 61 Taupo
Quay which formerly housed the Whanganui River Maori Trust Board.
14. Undertake a detailed review of governance and management of sporting facility assets on Council
reserves.
Whanganui Sport & Recreation Strategy (Stage 2 Sporting Facilities): Global Leisure Group 33. Introduction
Sport Whanganui (SW) in partnership with Whanganui District Council (WDC) contracted Global Leisure Group
(GLG) to undertake a review of Whanganui’s sporting facilities with the long term aim of determining what sporting
infrastructure Whanganui needs to meet current and future demand.
The Stage 1 Sporting Facilities Report is the basis for the development of a long-term investment strategy for
Whanganui. This report should be used in conjunction with the latter Regional Sport and Recreation Strategy when
completed.
This report identifies areas of supply and demand, opportunities for partnership and clustered approaches to the
provision of facilities and the potential for consolidation of activities onto fewer sites used more intensively than has
been the case up until now. It is expected that the findings will contribute to this strategy in a way that enables WDC
to use information from it in its long term planning and for the document to inform and support initiatives by SW.
Furthermore, sport clubs and regional sport organisations (RSOs) will be able to plan with some certainty about the
future allocation of funds to sport-related projects in the region.
3.1. Study Objectives
The expected outcomes of this review are that SW; WDC and sport stakeholders have a clear understanding and
outline of:
The current demand for sporting and recreational facilities and infrastructure in the Whanganui region and
how that is likely to change over time
The extent to which this demand is being met or not
The options for the region to meet any shortfall of these demands
The proposed major sporting infrastructure projects with ball park costs to be constructed and/or replaced
over the next 10 years
The identification of preferred locations of sporting infrastructure to maximise integration and cost
efficiencies.
3.2. Agreed Deliverables
This project aims to provide a cohesive and collaborative approach to achieving the following outcomes:
Establish a full inventory of type and condition of WDC owned and educational facilities identified to support
the sporting network.
Provide gap analysis.
Identify future investment requirements across the facility network ranging from short to long-term
Identify facility network opportunities for consolidation or rationalisation so they complement each other
Make recommendations on potential partnership innovations to enhance financial sustainability
Provide guidance to key stakeholders on good practice in facility planning
Present a prioritised list of recommendations with focus on facility development, funding and operations
Provide a summary of how recommendations align with LTP process and intent
Explore high level advantages of working with Manawatu and Taranaki regions with specific reference to
facilities and events
Whanganui Sport & Recreation Strategy (Stage 2 Sporting Facilities): Global Leisure Group 44. Environment Scan
The following is a review of key demographic and economic measures designed to give a better understanding of
the district.
4.1. Demographics
Whanganui District is situated on the south-western coast of the North Island and is centred on the Whanganui
River, with the city of Whanganui at the river mouth. The district has four territorial authority neighbours: Ruapehu
District to the north, Rangitikei District to the east, and South Taranaki and Stratford Districts to the west. The data
presented has been gathered using information available on (WDC’s community profile website. The demographic
analysis shown in the table below is based on results from the 2013, 2006 and 2001 Censuses of Population and
Dwellings7. It shows that the population has been steadily declining from 46,000 in 1996 to just over 43,000 in 2013.
Over the last ten years it has remained relatively static at a mean average of 43,600.
Figure 1 Whanganui District Populations 1996-2014
Whanganui District Population
46500
46000
Population number
45500
45000
44500
44000
43500
43000
42500
42000
Years
4.2. Household income levels
Analysis of 2013 household income levels shows that the Whanganui District has a smaller proportion of high-
income households (those earning more than $70,000 per annum) and a higher proportion of low-income
households (those earning less than $30,000 per annum) than the national average. Overall, 24.2% of households
earned a high income and 28.3% were low-income households, compared with 38.7% and 18.7% respectively for
New Zealand.
The major differences between the household incomes of the Whanganui District compared with New Zealand
were:
A larger percentage of households earned $20,001 to $25,000 (7.4% compared to 4.7% nationally)
A larger percentage of households earned $30,001 to $40,000 (10.7% compared to 8.3%)
A larger percentage of households earned $15,001 to $20,000 (6.4% compared to 4.1%)
A smaller percentage of households earned $100,001 or more (11.1% compared to 23.4%)
4.3. Age profile of the district
7
Statistics NZ Subnational Population Estimates June 2013
Whanganui Sport & Recreation Strategy (Stage 2 Sporting Facilities): Global Leisure Group 5The chart below shows that the population in the district is ageing, with the number of people over 50 years old
having increased significantly between 2001-2013. In the 50-59 age group alone there has been an increase of
more than 22% over the same period, while there has been an 18.5% increase in those over 50. Just under 40%
of the population is now over 50 years of age.
Figure 2 District age profile 2001-2013
8000
7000 Less than 10 years
6000 10-19 years
20-29 years
5000
30-39 years
4000
40-49 years
3000 50-59 years
2000 60-69 years
1000 70-79 years
80 years and over
0
2001 2006 2013
4.4. Ethnic profile of district
The chart below shows that Europeans are by far the largest ethnic group in the district, mirroring the national
average of 73%8. However, the district also has a higher proportion of Maori who account for 23% of the population,
well above the national average of 14.9%. The proportion of people from both the Pacific and Asia is below the
national average, with each group making up about 3% of the district’s population.
8
2013 Census QuickStats about a place
Whanganui Sport & Recreation Strategy (Stage 2 Sporting Facilities): Global Leisure Group 6Figure 3 Ethnic profile of district
Ethnic Groups
European
Maori
Pacific peoples
Asian
Middle Eastern / Latin
America / African
Other
4.5. Population projections
The chart below is based on Statistics NZ9 data and indicates that the district has a declining population. By 2031
the population is projected to fall by 7% from its current level to approximately 40,000 residents.
Figure 4 District population projections between 2006-2031
45,000
44,000
43,000 2006
2011
42,000
2016
41,000 2021
2026
40,000
2031
39,000
38,000
Population
4.6. Summary of environment scan
The estimated resident population for the Whanganui District in 2014 was 43,40010, a decline of nearly 3000
residents or 6.5% since 1999. This is expected to continue with the population projected to fall to just over 40,000
by 2031. European and Maori make up 93% of the population, with nearly 1 in 4 people Maori, which is significantly
above the national average. These factors impact the nature of sporting infrastructure needed in the region with a
range of traditional sport being popular with Maori communities, including rugby, rugby league and basketball
9
Area Unit Population Projections by Territorial Authorities 2006 (base) – 2031 update
10
Estimated resident population WDC web-site
Whanganui Sport & Recreation Strategy (Stage 2 Sporting Facilities): Global Leisure Group 7among others. Sport facility provision should reflect the participation patterns and needs of Maori communities of
interest.
Another factor to be considered is the ageing population, with the number of people in the district above 50 years
having increased by nearly 19% between 2001-2013. The ageing population will significantly increase demand on
sporting facilities to provide an excellent range of exercise activities, which help maintaining mobility and
rehabilitation for this age group. Older adults prefer warmer water particularly for therapeutic and relaxation
purposes and this will be a factor in planning for new facilities.
Affordability will be a key issue for many families with over 28% being identified as low-income households within
the Whanganui District. These households have less discretionary income to spend on sport and recreation and
programme and sport club fees, pool admissions and the like than the average across many communities
nationwide. This issue impacts on the capability of residents to support sport through fees and subscriptions and
through user charges. Cost will be a very real barrier to use of sports facilities for a significant proportion of
residents. Targeted pricing strategies and funding contributions from WDC and SW could enable all residents to
access facilities and their services.
4.7. National and Regional context
A facility hierarchy approach has been used in this report in order to better understand the “network” of sporting
facilities in an area. These definitions have been drawn largely from work commissioned by Sport New Zealand
(Sport NZ)11 into where facilities “fit into the wider network”. Learning’s from such work will help Whanganui’s
sporting facility infrastructure to be effective and efficient.12:
“When clubs and codes and communities make decisions in isolation, we end up with too many of one kind of
facility and not enough of another”
The table below identifies the hierarchy and associated definitions.
Table 1 Facility Hierarchy levels and definitions for indoor courts and aquatic facilities
Hierarchy position Definition Impact / Challenges Benchmarks
International A facility with the ability to High supporting Indoor spectator capacity
host international infrastructure, official’s likely to exceed 5,000.
competitions/events (i.e. space, television, and For Aquatic Facilities
between nations) spectator capacity. population centre over
300,000.
National A facility with the ability to High specification of Indoor spectator capacity
host regional representative facility to meet NSO likely to exceed 3,000.
competitions (including needs. For Aquatic Facilities
professional and semi population centre over
professional franchise 100,000. Seeking 100,000 to
competitions involving 500,000 visits per annum.
teams from outside New
Zealand) and/or to serve as
a national high
performance-training hub
for one or more sports
codes.
Regional A facility with the ability to Facilities tend to be used For indoor provision of 3-6
host inter-regional and by sporting codes as courts and ability for
internal regional training venues prior showcase court for finals.
competitions and/or serves national events. For For Aquatic Facilities
as a regional high indoor court purposes population centre of 30,000
performance-training hub multiple courts for multiple required.
for one or more sports games played
codes. simultaneously.
11
National Facility Strategy for Indoor and Aquatic Sports 2014
12
The New Zealand Sporting Facilities Framework 2014
Whanganui Sport & Recreation Strategy (Stage 2 Sporting Facilities): Global Leisure Group 8Sub Regional A facility with the ability to Hosting events Minimum indoor two court
draw significant numbers of competitions not at provision.
teams/competitors from regional level but may
across adjacent territorial meet local needs (e.g.
authority boundaries for rural location) For aquatic purposes
either competition or population centre of between
training purposes. 10,000-30,000.
Local A facility with the ability to Different temperature Population centre of 10,000
serve a local catchment’s ranges and pool depths to for Aquatic Facility below this
basic sporting needs. This meet all community would require strong business
catchment will needs. case
predominantly be drawn
from within a single
territorial authority.
5. Current network of sporting facilities
The table below shows the facility assets that are owned by WDC and the Wanganui Sports Centre Trust. The
information provided for the table was part of an inventory survey completed by WDC in July 2015. It highlights the
range of sporting and recreational facilities. The key components for each facility are also listed. The facilities are
grouped into categories and include indoor, outdoor artificial surface sports including courts and tracks, watersports
activities, which are largely waterway sports with some lake usage, and aquatic sports, both recreational and
competitive.
Table 2 Inventory of sporting facilities
Facility Owner Location Key components
Wanganui East Whanganui District Tinirau Street 33.3m pool, 15m learners pool,
Swimming Pool Council toddlers pool, hydro slide, changing
sheds, clubrooms, office, first aid
room, wooden stands
Laird Park Whanganui District Peat Street, Whanganui 13 outdoor netball courts, Three green
Council bowling facility plus clubrooms,
clubrooms for H&DS, local
headquarters for blind association, two
bocce courts.
Lake Wiritoa Whanganui District Kaitoke Road, Whanganui A lake, gazetted water ski lane and
Council recreational users
Slipway accessing Whanganui District 4 locations on river within city Concrete slipways for recreational
Wanganui River Council boundary boaties and emergency services
Cooks Gardens Whanganui District St Hill Street, Wanganui 400m artificial athletics track, in field
Council area contains main rugby venue,
seated grandstand for 4000, lighting
towers, corporate boxes, media and
function rooms, 250m wooden cycling
velodrome, cycling clubrooms
Springvale Stadium Wanganui Community Springvale Park Springvale Main Hall
Sport Centre Trust 2 x Full Size Basketball
Courts
2 x Full Size Netball Courts
3 x Volleyball Courts
8 x Badminton Courts
64 x Indoor Bowls Mats
Whanganui Sport & Recreation Strategy (Stage 2 Sporting Facilities): Global Leisure Group 9Facility Owner Location Key components
Springvale Extension
1 x Full Size Basketball
Court
1 x Volleyball Court
4 x Badminton Court
30 x Indoor Bowls Mats
Wanganui Boys & Wanganui Community Springvale Park Main hall
Girls Gym Club Sport Centre Trust Adjoining building with
(WB&GC has Licence to accommodation block of 10 rooms (1-
Occupy) 4 people per room).
Jubilee Stadium Wanganui Community Springvale Park Main Hall
Sport Centre Trust 1 x International Inline Rink
1 x International Roller
hockey Rink
1 x Artistic Skating Rink
1 x Speed Skating Rink
4 x Volleyball Courts
86 x Indoor Bowls Mats
1 x Roller derby Track
Jubilee Extension
12 x Table Tennis Tables
20 x Indoor Bowls Mats
Springvale Park / Whanganui District G F Moore Drive, Wanganui Sports fields used for rugby, touch,
Open Spaces areas Council cricket, rippa, circus plus other ad hoc
events
Gonville Domain Whanganui District Alma Road, Wanganui 9 hole golf course and driving range,
Council one hockey turf, sports field (grass)
Splash Centre Whanganui District Springvale’s Park 25m x 8 lane pool, 25m x 6 lane pool,
Council hydrotherapy pool, LTS pool, Lazy
river, 2 spa pools, 2 hydro slides,
Gymnasium, seating for 300, cafeteria,
meeting room, party room, toddlers
pool
Network of school facilities
Four schools are included in this report because they have significant facilities used by the community and support
the wider facility network. These schools are Wanganui Girls College, Wanganui Collegiate, Wanganui High School
and Wanganui City College. The table below shows the core components of each school site.
Table 3 School sports facilities to support provision
School Location Community Facility Facility Planned
use components components developments
Indoor outdoor
Wanganui Girls Jones Street Yes. Hire Extended gym Tennis 9 courts Developing all
College contract via 2006/7. Netball including Netball weather
property court. Use 6 courts. surface. Not
manager. volleyball x 2 Swimming pool 6 full size. Multi-
Netball, across. lanes (15m x purporse.
Karate. Badminton. Full 30m) Hockey,
fitness suite. netball, tennis,
football.
Whanganui Sport & Recreation Strategy (Stage 2 Sporting Facilities): Global Leisure Group 10Wanganui Liverpool Street Yes. School Indoor Cricket Synthetic Interest in
Collegiate has priority Centre, Sports Hall Hockey Turf (1) extending
use. (Netball, Tennis Courts 6 indoor cricket
Wanganui Basketball) 1 Outdoor centre. Convert
Cricket competition swimming pool 6 squash courts.
Academy on volleyball. 4 lanes 15m x
site. Badminton. Junior 22m)
mini-ball.
Wanganui High Purnell Street Yes. YMCA 2 gyms, 1 full size Multi-sport Potentially
School Futsal. Sport netball, (1 complex, lighting outdoor
Wanganui. basketball), synthetic turf. area in future
Intermediate volleyball marking, Tennis Courts 6
use facilities. fitness Centre Netball,
basketball.
Hockey Turf ½
no lighting
2 artificial cricket
Wanganui City Ingestre Street 1 indoor court Basketball
College Courts 4
Tennis Courts 5
Netball 2
Hockey Turf (1)
6 lanes (15m x
25m)
6. Current facility assessment
This section of the report summarises the findings from information provided by the WDC completed survey13. They
provide an overview of:
The age of the facilities
Whether condition assessment reports have been undertaken in the last 5 years
If plans are in place to develop the facilities at that particular location
Age of Facilities
The following criteria were used to establish which particular colour of the “traffic light system” would be adopted to
identify its current level of assessment.
Facilities built before 1975 were coded RED due to being older than 50 years and considered "high risk" for
on-going repairs and maintenance
Facilities aged between 1975 and 1990 were coloured AMBER based on requiring some level of investment
once condition assessment was undertaken
Facilities built after 1990 were coloured GREEN as being those with good economic life, assuming asset
management had been consistent with industry standards.
Condition of facilities
This analysis was based on information provided by WDC as to whether the facility has had a condition report
completed within the last 5 years.
RED: No condition report in last 5 years
AMBER: May have had improvements carried out in last 10 years which improves "whole of life"
expectancy level
GREEN: For facilities that have had condition report in last 5 years and no major work is required
13
WDC Facility Inventory July 2015 (Survey Monkey)
Whanganui Sport & Recreation Strategy (Stage 2 Sporting Facilities): Global Leisure Group 11Facility development plans
The future development status of the facilities were categorised using the following definitions:
GREEN: There are currently no plans in place for the facility requiring future development
AMBER: There are currently no plans in place but the facility has made general upgrades in the last 10 years
RED: Yes there are current plans in place for investment
Commentary and analysis of current facility network
With regard to the age, condition and future development of the facilities:
Generally the facility stock in Whanganui is over 40 years of age. This has implications for facilities that
haven’t received significant investment or development in the last 10 years.
With some sites having numerous buildings on site, more detailed analysis and condition reports should be
undertaken to provide more robust information.
Some facilities (e.g. Cook’s Gardens) have received a level of investment in recent years that should extend
its “whole of life” expectancy level.
The Splash Centre has a mix of facility ages due to new development in 2008. Consideration should be
given to older parts of combined facilities that will eventually become less efficient and more susceptible to
higher maintenance costs.
There have been some condition reports competed but this is not the case for all facilities. There were two
facilities that were identified by WDC as requiring immediate investment. The Wanganui East Swimming
Pool - due to the age of the pool and associated plant - has had a condition report that recognises the need
for a significant upgrade. This has been estimated at $75,000 per year for the next five years. Also, the
slipway accessing Whanganui River off Wharf Street has tidal and silting issues. The slipway work requires
collaboration with iwi and recreational users.
Table 4 current facility assessments
Facility Age of facility Condition Assessment Development Plans
Wanganui East
Swimming Pool
Laird Park
Lake Wiritoa
Slipway accessing
Whanganui River
Cooks Gardens
Springvale
Stadium
Jubilee Stadium
Wanganui Boys &
Girls Gym Club
Gonville Domain
Springvale Park /
Open Spaces
areas
Splash Centre
7. Future demand based on sports participation and trends
This section of the report reviews sport participation and lifestyle trends that may have an impact on the future
demand for sporting and recreational facilities in Whanganui. The bulk of the data analysed is from the Active NZ
Survey of 2013/14, which reflects the overall participation in sport and recreation among New Zealand adults (over
16 years). Key findings for Adults
7.1. Key findings for Adults
Whanganui Sport & Recreation Strategy (Stage 2 Sporting Facilities): Global Leisure Group 12The table below shows a “snapshot” of facts and how this report will interpret them for the consideration of future
facility provision.
Table 5 National sports participation trends in Adults
National sporting facts for adults Commentary for facilities
Man-made facilities (e.g., paths, cycleway and walkways in Purpose built facilities are integral to the participation of
town and cities, people’s homes and outdoor facilities) are sport and for physical activity purposes. For Whanganui it
used by most participants (91.3%). is vital these facilities meet the needs of the community
they serve.
The most common way people pay to participate is pay-to- By understanding this the development of sporting facilities
play i.e. per visit, entry or hire (35.2%). ensuring they are financially sustainable will need to be
captured in the business case.
There were also declines in participation between Maori Nearly 1 in 4 people in the district are Maori and over 28%
and those in the lowest income group (quartile 1). identified as low income households. These pose a real
challenge to future participation levels and measures need
to be put into place to reduce these potential barriers to
participation.
Participation levels are high for men and women and most With the aging population in the district there needs to be
age groups, except the older age group of 75 and over. some intervention to increase participation in the 75 and
over age group. This may include innovative programming
at facilities and looking at new ways to use the current
sporting facility infrastructure.
The most popular activities are recreational in nature Given the aging population and the social aspect to some
(walking, swimming, cycling, jogging/running). of the sports listed (opposite). The facilities in the future
may be part of the offer or meeting place with the activity
be carried outside of the main building. The support
services (toilets, showers, café etc.) then may be
accessed post activity.
Groups with the most notable increases were the mid-age Unfortunately, for the district this is a group within the
group (35 to 49-year-olds), Pacific peoples, and those in a population that is declining. Specific targeted programmes
mid-income group (quartile 2). should be promoted to create “a habit of use” so that this
group stays active throughout their lives.
The most popular sports are golf, football, tennis, netball, This needs to be recognised when developing improved or
cricket and touch rugby. new facilities but key research needs to be undertaken to
fully appreciate sustainability levels.
However, sports club membership has declined from Stand-alone clubs will need to look towards other models
19.0% in 2007/08 down to 16.9% in 2013/14. including “multi-use and sports hubs” in order to rationalise
the financial challenges ahead.
74% of adults (2.5 million people) taking part in sport and Sport is still high on people’s agenda’s but more specific
recreation in any given week information is required locally to appreciate how people are
participating.
Participation sometimes varies with people’s socio- Given the high levels of low-income households in the
economic position (high deprivation participation is lower) district the challenges to participation need to be fully
and where they live (rural participation is lower than understood. Also, for any new improvements or
urban). developments these needs to be “fit for purpose” for their
community. By not fully understanding all community
needs facilities could be developed to only serve a small
percentage of the overall population.
Young adults’ (16-24) sports participation declined over the This is also an age group that is in decline in the district.
same period from 79% in 2007/08 to 76.7% in 2013/14. Therefore, to buck the trend in participation, new and
innovative programmes / facilities will be required rather
than the same offering that is now being recognised as in
decline.
42.4% of participants received coaching or instruction. Nearly 1 in 2 adult participants wanted to receive further
information and guidance. Therefore, it is safe to assume
that programmes and activities offered in the future with
instruction could prove popular. Due to the aging
population there may become more specialised fitness
and health programmes targeting 75+ age group.
Whanganui Sport & Recreation Strategy (Stage 2 Sporting Facilities): Global Leisure Group 13National sporting facts for adults Commentary for facilities
Trends in adults’ sports participation show that, for adults, Participation in the last 5 years is mainly static nationally in
participation grew by just over 1% from 72.6% in 2007/08 adults. Locally, more focused resources would be required
to 74.0% in 2013/14. to change this pattern.
7.2. Key findings for Young people
The table below presents information largely taken from the 2011 Young People’s Survey (aged 5-18 years). Unlike
overall adult participation, which has remained high over the last 5 years, participation levels among young people
have remained largely static. The reasons for this and what young people will require in the future will need to be
understood when assessing future demand of sporting facilities in the district.
Table 6 National sports participation trends in young people
National sporting facts for young people Commentary for facilities
Participation is higher for boys than girls (in most respects), By understanding the barriers to participation facility
and drops off in the teenage years, particularly for girls. planners and operators may be able to reduce participation.
For example this may include making changing areas with
separate cubicles to allow for more privacy.
By Year 13, almost half of girls (47%) and over one-third of For sporting facilities the “offer” and level of attractiveness
boys (36%) spend no time in organised sport (including PE). needs to be considered. In a very competitive marketplace
for young peoples time and money sporting facilities in the
future will need to change.
Participation also varies with young people’s ethnic With a higher percentage of Maori people than the national
backgrounds; in particular, Asian young people are less average the district is faced with challenges to attract groups
engaged in most aspects of sport and recreation than young to sporting facilities. More targeted approaches may be
people overall. needed to “create a sporting habit for life”.
10 to 15-year-olds in low-decile schools are more likely to In areas where transport or cost are barriers to participation
say that their parents/caregivers are less likely to drive/take a more “sport on the door” approach may need to be
them to a place to do sport/recreation that they do not have introduced. This may include a network of small multi-sport
sports equipment available at home and that facilities in their spaces in local parks to attract new participants that were
neighbourhood were not available for use. previously excluded.
Young people in urban areas, where more than 80% of the The competition for young peoples time and resources
population live, tend to be less engaged in sport than those cannot be discounted. In a more urban environment there
in rural areas. would be a greater level of distraction (entertainments
centres, shopping malls etc.), which would not be the case
in rural areas. Therefore, the “build it and they will come”
approach to facility development will need clearer planning
processes in place to ensure future sustainability.
7.3. Commentary of national participation trends
While adult (16 years and over) participation in sport is high with nearly 2.5 million people participating every week,
it has remained largely static for adults over the last 5 years14. Given that Whanganui’s population is projected to
continue to decline, it would be prudent that any future sports facility developments have a robust business case in
place. This change in needs was identified in a Sport NZ commissioned report15 that stated:
The quality of the changing rooms, covered pools and water temperature are likely to be important in attracting this
[older adult] age cohort as the ease of access to and within the facility
While this quote is about aquatic facilities, it clearly recognises that more attention will need to be paid to needs of
the wave of older people when providing future facilities. . There is also the challenge posed by the increasing
numbers of New Zealanders aged over 12 spending more than 80% of their leisure time on passive digital media
such as watching TV, playing computer games or on-line socialising)16. If this trend is to be changed, it will require
14
Sport New Zealand Active NZ Survey 2013/14
15
National Facilities Strategy for Aquatic Sports (Revised Edition 2013)
16
The Future of Sport in New Zealand 2015
Whanganui Sport & Recreation Strategy (Stage 2 Sporting Facilities): Global Leisure Group 14a combined coordinated approach by physical activity and health practitioners to create the habit of a “healthy
lifestyle” in communities.
The onus is on sporting and recreational facilities to ensure that their “offerings” are as attractive if not more so than
digital products and services if they wish to remain relevant and competitive.
7.4. Demand based on barriers to participation
The chart below shows data taken from the Sport New Zealand Market Survey17. This is a full year survey that
runs from April-March. Data is collected from each of the 17 regional sports trusts. In 2011-12 12,113 adults aged
16-64 completed the survey. It found that the cost of participation is the single major reason for people not taking
part in sport.
Figure 5 Regional data for barriers to participation 2011-2013
Barriers to participation
Other barriers
Time required to do this sport / activity
Don't have skills / ability to do sport / activity
Lack of appropriate / available facilities
Having existing injuries
Having to become a member
Not having anyone to participate with
Commitment to a season /year long programe
Not knowing where to participate
Cost of participating
0 20 40 60 80
Percentage of respondents
7.5. Future demand based on membership trend of user groups
A questionnaire was distributed to operators and users groups of sporting facilities. The findings are presented in
the chart below. Of the 21 responses received, the respondents reported that they had combined user numbers of
4,118, which is nearly 9.5% of the current total population of the district. The survey asked whether membership
had increased, decreased or remained the same over the last three years, with 38% saying it had remained the
same and another 29% saying it had decreased. In short, nearly three quarters of organisations reported static or
falling membership. This is significant in terms of potential future demand upon facilities and may mean that better
utilisation of existing facilities is a better option than developing additional capacity, which may not have the
necessary demand to be sustainable.
Figure 6 Membership trend of user groups 2012-2015
17
Gemba Regional Data (Manawatu / Whanganui) 2011-2013
Whanganui Sport & Recreation Strategy (Stage 2 Sporting Facilities): Global Leisure Group 15Increased in last 3 years Decreased by 10%
About the same
Whanganui Sport & Recreation Strategy (Stage 2 Sporting Facilities): Global Leisure Group 168. Current issues with facility provision A variety of consultation methods were used to ascertain the needs identified by user groups and operators of facilities. These included an on-line survey, a series of workshops and face-to-face meetings. The following tables show key issues and challenges facing those sports in the district that responded to requests for information. 8.1. Indoor and Outdoor courts or modified playing surfaces Sports and their associated facilities were put into groups where there was potential for shared use such as, outdoor and indoor court sports were included with track and speed skating. The table below identifies the issues and challenges facing the sports surveyed but also list the potential impact these challenges may place on the wider facility network. These range from sports recognising that they have a declining membership base to sports with increasing membership that have concerns whether there is enough capacity in the overall network to supply them with the necessary space and time in order to grow further in the future. Table 7 Challenges and issues identified by user groups (Indoor: Outdoor Courts: Tracks: Artificial) Whanganui Sport & Recreation Strategy (Stage 2 Sporting Facilities): Global Leisure Group 17
Sport                   Issues / Challenges                             Facility Impact
 Hockey                  Increasing membership                           Available space to support growth
                         Gonville all weather turf needing total         Cost of refurbishment and current site suitability to support
                         refurbishment                                   future growth
 Table Tennis            Competition for space                           Groups wanting same space same time
                                                                         Development programme needed to grow sport
 Speed Skating           Level of facility to meet club standards /      Will facility compliment current network or is this duplication for
                         expectations                                    a small number of potential users?
                                                                         Determining the needs that will support wider needs of speed
                                                                         skating network
 Athletics               Making track standard to meet users             Fit into wider athletics track network. Financially viable for
                         expectation                                     investment?
                                                                         Are expectations realistic and how will L1 standard track “fit”
                                                                         into wider network?
 Athletics               On-going costs of track                         Financial sustainability concern if wanting further investment for
                                                                         upgraded level facility.
                                                                         Dual use of site with Rugby balances winter / summer usage of
                                                                         Cooks Gardens
 Tennis                  Extending playing opportunity by covering       Whole of life costs of development versus using existing indoor
                         courts (4 possibly)                             court spaces
                                                                         Upgrade of indoor court space rather than new development
 Tennis                  Growing membership, space of provision          Better use / management of current facility provision. Require
                         particularly for tournaments                    potential differing model than current
 Tennis                  Extension of playing opportunity                Increased expectation from user. Revenue potential for
                                                                         investment needed to be provided in business case
 Squash                  Declining membership                            Offer from facilities etc. not competitive with other offerings
                                                                         Development programme required to stabilise membership and
                                                                         usage levels of facilities.
 Basketball              Meets needs of users                            Position in network to attract regional, national events.
                                                                         Where Basketball facilities in Whanganui sit within regional and
                                                                         national hierarchy
 Badminton               Organisational structure to operations          No robust systems in place to fully understand business
                                                                         required for long-term strategy
                                                                         Development programme required to enhance utilisation
 Netball                 Not meeting users needs                         Expectation of user to have "fit for purpose" facilities
                                                                         Outdoor netball – resurface due, water table / moss issue (13
                                                                         courts at Laird Park)
 Netball                 Increased demand on available space             Capacity to increase or review of operations.
                                                                         Programming of available spaces to be reviewed rather than
                                                                         develop more indoor courts

8.2. Water ways and aquatic sports
Water sports were grouped together due to the requirement of needing a water body in order to participate. This
included users who accessed the Whanganui River, Lake Wiritoa and man-made aquatic experiences including the
Splash Centre and Wanganui East Outdoor Swimming Pool. The issues ranged from airflow inside the Splash
Centre adversely affecting customers to concerns over climate change leading to more floods. After the region
experienced a major flood in 2015, river users identified issues of public safety and whether facilities needed to be
better located or designed.
Table 8 Challenges and issues identified by user groups (Watersports and Aquatics)

Whanganui Sport & Recreation Strategy (Stage 2 Sporting Facilities): Global Leisure Group                                                  18
Sport Challenge Facility Impact
Rowing Fit for purpose facilities that are safe Better understanding of future provision
considering climatic changes
Waka Ama Current facilities not "fit for purpose" Better understanding of future provision
considering climatic changes
Multisport Current facilities not "fit for purpose" Better understanding of future provision
considering climatic changes
Masters Swimming Decreasing membership Aquatic Forum to support groups particularly
"older" users who will be growing population
group in future
Development programme needed to grow
sport
Splash Centre Only provide indoor provision Energy plan
Air flow Improving access (aging population /
Fitness Centre / Load bearing disability)
No major programming issues
Competition with beach / river
9. Benchmarking comparisons based on population
This section measures what the current facilities offer is set against national and regional averages to assess
whether they compare positively with other regions and councils.
9.1. Indoor court provision (WDC owned)
The table below shows the number of indoor courts that currently support the indoor sporting network of facilities
that are owned by WCSCT. For the purpose of this report the standard one court definition has been taken from
FIBA regulations (28m by 18m) and netball court dimensions of 30.5m by 15.25m (approximately 465m 2). These
can either be marked basketball or netball courts that are similar to the standard measurements used in the national
strategy on indoor courts. Springvale Stadium currently offers three combined indoor marked basketball courts over
1,855m2. More interestingly is that there is potential indoor capacity of 1918m 2 at Jubilee Stadium that is currently
largely used for skating, table tennis and indoor bowls. Therefore, council has future indoor capacity if sporting
needs change with a combined indoor provision of 3,773m 2.
Table 9 Council owned indoor court provision
Facility Courts Size M2 Year built
Springvale Stadium 2 1260 1966
Springvale extension 1 595 1971
Jubilee Stadium 1464 1987
Jubilee extension 454
9.2. Indoor Court Provision (high Schools)
The district has five high schools that provide a network of an additional seven indoor courts. The schools tend to
operate a variety of booking systems for community uses but the courts are predominantly for school activities,
which have priority over third party bookings.
Table 10 Provision of high school indoor courts
Whanganui Sport & Recreation Strategy (Stage 2 Sporting Facilities): Global Leisure Group 19School Courts Size m2 Year built
Wanganui High School 2 1383 2003
977 1973
Wanganui Girls College 2 1068 1983
427 1940
Wanganui City College 1 851 1961
Cullinane College 1 632 1993
Wanganui Collegiate 1 n/a n/a
School
9.3. Combined provision of indoor courts
Because schools in the district have established some regular bookings for community use, they have been
accepted as “supporting the wider network of indoor court provision” for this report. The table below shows that
school indoor courts make up 70% of the total district network, which is significantly higher than the national average
of 56%.18.
Table 11 Combined provision of indoor courts in the district
Area Number of council courts Number of school courts Total number of courts
Wanganui 3 7 10
9.4. Benchmark of current indoor provision
The table below shows that the WCSCT - owns indoor court facilities that equate to one court per 14,000 people.
This indicates that the district is well supplied when compared with the national average of 21,000 people per indoor
court. This analysis has not included the 1918m 2 of indoor space available at the Jubilee Stadium, which is used
by other sports users and doesn’t provide marked basketball or netball courts. The picture looks even brighter
when the high school provision in the district is compared with the national average. The district high schools provide
one indoor court for 6,000 people in the district compared to a national average of 14,000 people per court. . Put
another way, schools in the district have more than double the national average based on population.
Table 12 Benchmark comparisons of council and educational indoor courts
Total number of courts Population 1,000 people per court
Whanganui (Council owned) 3 43,400 14
New Zealand (Council owned) 216 4,470,000 21
Whanganui (High Schools) 7 43,400 6
New Zealand (Education) 311 4,470,000 14
9.5. Aquatic Pool provision (council owned)
18
Ministry of Education Facilities developed from PMIS database
Whanganui Sport & Recreation Strategy (Stage 2 Sporting Facilities): Global Leisure Group 20Whanganui District has two public swimming pools Splash Centre in Springvale Park and the Wanganui Aquatic
Centre in Whanganui East. The table below shows the dimensions of the pools and the water area provided for
public use.
Table 13 Provision of council owned pool area
Facility Pool and dimensions Pool area m2
Splash Centre Main pool 25 m x 20 500
Teaching Pool 25 x 10 250
Toddlers Pool 10.5 x 5.3 55
Leisure & Lazy River Pool 7.8 x 4.6 36
Total provision 841
Wanganui East Pool Main Pool 33m x 12m 396
Learner’s 13m x 7m 91
Toddlers 7 x 2.8 20
Total provision 507
The table overleaf provides comparison with the national average of residents per m 2 of council pools extracted
from the National Facilities Strategy for Aquatic Sports (2013). WDC-owned pools in the district provide 1348m 2 of
water space. This equates to 32 people per m 2 of water space, which is lower than the national average of nearly
47 people per m 2. This indicates that the district has a sufficient supply of water space given its population and
compares favourably with the national average.
Table 14 Comparison of council pool space provision for population
District Population Council Pool (m2) People per m2
Whanganui 43,400 1,348 32.0
New Zealand 4,422,800 94,214 46.9
The table below is based on analysis presented in the National Facility Strategy for Aquatic Sports and shows the
number of people per m 2, which should be achieved in a rural/provincial setting. Whanganui District is classified
as a provincial area, and its current level of provision of 32 people per m2 compares well with the national
benchmark of 35 people per m2 for a provincial area. If the district’s population declines as projected to 40,300 by
2031 this would lower further the number of residents per m 2 to fewer than 30. Therefore, it has to be recognised
by council that future pool provision will not be a key focus due to decreasing demands from population decline.
However, the ageing pool network will over time require investment to ensure customer expectations and levels of
service are met, particularly in terms of accessibility, water temperatures and indoor / outdoor provision mix.
Table 15 Benchmark for community pool provision in New Zealand
Regional People per m2 of pool
Urban Centre 60
Provincial area 35
Whanganui Sport & Recreation Strategy (Stage 2 Sporting Facilities): Global Leisure Group 21You can also read