UP IN THE AIR How to Solve London's Air Quality Crisis: Part 1 - Richard Howard - Trust for London
←
→
Page content transcription
If your browser does not render page correctly, please read the page content below
UP IN THE AIR
How to Solve London’s Air
Quality Crisis: Part 1

Richard Howard
About the Capital
City Foundation
The Capital City Foundation is a new research unit created by Policy Exchange
to develop policy ideas specifically for London. The focus of the Capital City
Foundation is to protect and promote the prosperity of London – while seeking to
ensure that the city is as pleasant, safe and affordable as possible for everyone that
lives or works here. The foundation aims to create workable policy ideas that can be
implemented by the city’s governing authorities.
Contents

               About the Author                                 2

               Policy Exchange’s Environment and Energy Unit    3

               Acknowledgements4

               Executive Summary                                5

           1   London’s Air Pollution Problem                   9

           2   Air Quality Trends                              16

           3   The Case for Action on Air Pollution            34

           4 Conclusions and Next Steps                        43

               Appendix 1: Overview of Methodology             44

               Appendix 2: Modelling Future Health impacts     46

               Endnotes49

Contents                                                         1
About the Author

    Richard Howard joined Policy Exchange in December 2014 as Head of the
    Environment and Energy Unit. Prior to joining Policy Exchange, Richard was
    Chief Economist at The Crown Estate, and prior to that he worked as an economics
    consultant. Richard has a wide range of research interests, in particular energy
    economics and policy, infrastructure, resource efficiency, environmental policy, and
    corporate sustainability. He has a BSc in Economics from the University of Bristol
    and a Masters in Sustainability, Planning and Environmental Policy from
    Cardiff University.

2                                                                           Up in the Air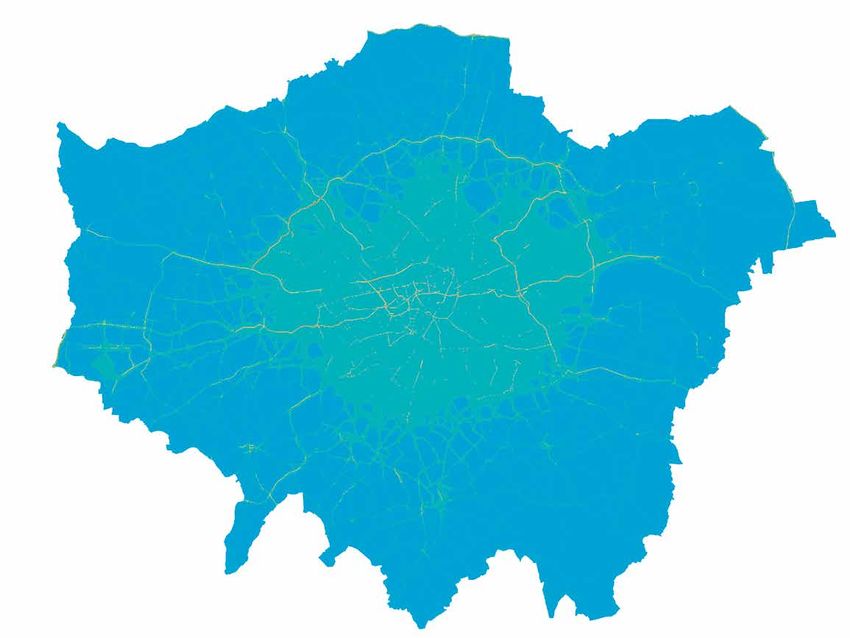
Policy Exchange’s
                            Environment and
                            Energy Unit

                            Policy Exchange’s Environment & Energy Unit conducts innovative and inde-
                            pendent policy research into a wide range of environmental, infrastructure and
                            regulatory challenges. Our objectives are to influence policy-making and to shape
                            debate. We produce publications, organise events and use the media to promote
                            our findings and policy proposals.
                                A key focus of our work is to identify ways to tackle environmental challenges
                            effectively, while minimising adverse impact on living standards. We promote
                            well-designed regulation to exploit the power of markets to achieve environmental
                            outcomes innovatively and cost-effectively.
                                If you would like to find out more about our work, please contact:

                                Richard Howard
                                Head of Environment and Energy
                                Policy Exchange
                                Clutha House
                                10 Storey’s Gate
                                London SW1P 3AY
                                Email: richard.howard@policyexchange.org.uk
                                Telephone: 0207 340 2650
                                www.policyexchange.org.uk

Policy Exchange’s Environment and Energy Unit                                                                3
Acknowledgements
This report was produced by Policy Exchange in partnership with King’s College
London. We would like to thank Drs Sean Beevers, David Dajnak and Heather
Walton and Professor Frank Kelly at King’s College London for their substantial
input into this project. We would also like to thank Trust for London, Bloomberg
Philanthropies, City of London Corporation, the Liebreich Foundation, and Calor
Gas Ltd for their generous support for this research.
Thanks also go to Simon Birkett (Clean Air in London) and Ruth Calderwood
(City of London Corporation), who kindly reviewed and commented on this report,
as well as all of those who gave their time and expertise to inform this research.
Any errors that remain, and the conclusions of the report, are the author’s own.
4 Up in the AirExecutive
Summary
In simple terms, London’s air is unhealthy to breathe, and more needs to be done
about it. Air pollution is arguably the most significant environmental issue facing
London, as well as one of the most significant public health issues. It is consistently
identified by Londoners as one of their top environmental concerns,1 and over
two thirds (69%) of Londoners think that the government is not doing enough
to tackle it.2
Air pollution is an enormously challenging issue, and has vexed policymakers
in London for centuries. As early as 1285, fumes from coal burning in London were
considered so serious that the world’s first air pollution commission was created.
Fast forward to the 1950s, and London was experiencing regular “pea soupers”,
with the Great Smog of 1952 killing around 4,000 people.3 London’s air pollution
problem is less visible than in the past, and the nature of the problem has changed,
with the coal smoke of the past being replaced by nitrogen oxides from diesel
fumes, gas boilers, and other sources.
There has been an increasing focus on the issue of air pollution by successive
London Mayors as well as Central Government. London is already taking action to
tackle air pollution on a number of fronts, for example through the Low Emission
Zone and Congestion Charge Zone, investments in the bus fleet, restrictions on
older taxis, investment in public transport, and regulations to address emissions
from construction sites and new developments. Recently, the Mayor of London has
also proposed the introduction of an Ultra Low Emission Zone (ULEZ) in 2020,
covering all vehicles in Central London. However, air pollution in London remains
well above legal limits (UK and European) and gives rise to significant health
impacts. There is a recognition that more needs to be done to tackle the issue,
and air pollution is becoming one of the key issues in the run up to the London
Mayoral elections in 2016.
This report, the first in a series of two reports on air pollution in London,
considers the moral, legal and economic case for doing more to tackle air pollution.
We show that despite the growing focus on the issue in recent years, current
and planned policies are unlikely to deliver compliance with air quality limits in
London until at least 2025. We also outline the health and economic benefits of
taking further steps to tackle air pollution. Our next report will consider specific
policy proposals in more detail.
The Case for Improving Air Quality in London
Levels of nitrogen dioxide (NO2) are well above European legal limits in large
parts of London, as well as many other parts of the UK. NO2, which arises from
the combustion of fossil fuels, causes lung irritation and increases the chance of
respiratory infections, and long term exposure has been linked to premature death.
ExecutiveSummary 5London also has high levels of particulate matter (PM), which comprises fine
particles of dust, soot and other materials. PM levels in London are now within
European legal limits, but are still above World Health Organisation (WHO)
guideline levels in most of Greater London. Exposure to PM pollution is linked
to asthma, lung cancer, and respiratory and cardiovascular diseases.
Research by King’s College London estimated that air pollution was responsible
for up to 141,000 life years lost or the equivalent of up to 9,400 deaths in London
in 2010, as well as over 3,400 hospital admissions.4 The total economic cost
associated with this was estimated at £3.7 billion. The scope for improving public
health through improving air quality is enormous: far greater than for reducing
passive smoking or eliminating road traffic accidents.5 Our analysis suggests that
if current and planned policies deliver estimated air quality benefits in full, this
would increase the average life expectancy in London by 6 months.6
Children are particularly susceptible to the effects of air pollution. Analysis
by Policy Exchange has shown that 328,000 children attend schools in London
where NO2 concentrations exceed the legal limit and healthy limit, representing
nearly 25% of all pupils in London. The most polluted schools in London
experience NO2 concentrations of nearly twice the limit. Although working age
adults are less vulnerable in their response to air pollution, their exposure can be
extremely high. Our analysis indicates that 3.8 million people work in parts
of London which are above legal limits for NO2 pollution, representing 44%
of London’s workday population. More deprived parts of London generally
experience higher levels of air pollution, although there is considerable variation.
Overall the moral case for tackling air pollution is very clear.
There is also a legal imperative to fix London’s air quality. European legislation
(the Air Quality Framework Directive) sets legal limits for key pollutants such
as NO2 and PM, based on WHO guidance. Greater London is one of 38 “zones”
across the UK that are currently in breach of NO2 limits. Failure to comply with
the limits has resulted in two court cases against the UK. In the first case, the
European Court of Justice ruled that the UK must put in place a plan to achieve air
quality standards in the “shortest time possible.” Subsequently, in April 2015, the
UK Supreme Court ordered the Government to redraft the national action plan
to ensure compliance with legal NO2 limits as soon as possible.
In response to this, Defra recently consulted on a draft plan to improve
NO2. Defra modelling, published as part of the consultation, indicates that
Greater London will not achieve compliance until 2025, although their earlier
modelling suggested that compliance would not be reached until at least 2030.
It is unclear how compliance will be accelerated, particularly since the main
proposal in the document to create a number of Clean Air Zones across the UK
is already being taken forward in London. It is clear that additional steps will be
required in order to meet the requirement of achieving air quality standards in
the “shortest time possible.”
London’s Air Quality Challenge
London’s air pollution problem is still far from solved. Progress has been made
on some pollutants, for example levels of carbon monoxide and sulphur dioxide
in London have dropped by 80% since 1996.7 There has been some progress in
reducing PM and NO2 pollution, but levels still remain high. Analysis by Policy
Exchange of data from air quality monitoring sites shows that the most polluted
6 Up in the Airparts of London have levels of NO2 nearly four times the legal limit. It is also
estimated that over 12% of London’s area was in breach of NO2 limits in 2010, with
the most affected areas being Central London, the area around Heathrow airport,
and other major transport routes.8
There has been limited progress in reducing NOx levels since the early 2000s,
both in London and in the UK generally.9 The failure to control NOx emissions
is largely due to the growth in the number of diesel vehicles, combined with the
failure of vehicle emissions standards to control emissions from diesels. Diesel cars
now make up over 50% of all new cars sold in the UK, and 36% of the total car fleet
(up from 7% in 1994), as well as being almost ubiquitous in the van, truck and bus
fleet.10 Government policy has created incentives for people to switch to diesel,
based on the CO2 advantage of diesel vehicles compared to petrol (albeit that this
advantage has now been eroded). However, diesels emit much higher quantities of
local pollutants than petrol vehicles. Research shows that despite the introduction
of progressively tighter vehicle standards (“Euro standards”), there has been
limited improvement in NOx emissions from diesels over the last 20 years.11 The
latest Euro 6 diesel cars show some improvement on previous models, but there is
still a gulf between how they perform on the road and the official Euro 6 standards.
A range of studies have shown that real world NOx emissions from the latest Euro
6 diesel cars are some 2.5 to 7 times the legal limits.12 The ongoing saga concerning
Volkswagen’s use of illegal “cheat devices” during vehicle emissions tests is an
exemplar of the failure of emissions standards. However, whilst other manufacturers
have not used cheat devices, the vast majority of diesel cars still fail to match up
to emissions standards on the road, particularly in urban driving conditions. By
contrast, the evidence suggests that the latest Euro VI standard for heavy goods
vehicles and buses has led to a significant reduction in NOx emissions.13
The most recent air quality projections for London (which formed part of the
evidence base for the ULEZ proposal) show that even with the current suite of
policies, London is unlikely to achieve compliance with air quality limits by 2025.
Indeed, the models show that 42sq km of London (an area equivalent to the size of
Westminster and Camden combined) would still be above legal limits in 2025. In
this scenario, the health impacts of air pollution would be significantly reduced, but
not eliminated completely.
Moreover we have identified a number of risks to the current approach to
modelling air quality and emissions:
• There is a risk concerning the vehicle emissions factors used in current models,
in that the models may overstate the benefits of moving to Euro 6. As described
above, diesel cars have failed to match up to Euro standards in practice. This is a
crucial assumption, since the ULEZ policy is designed to promote a shift to low
emission vehicles.
• The models also do not fully reflect the ongoing growth in decentralised
power generation across London, including Combined Heat and Power (CHP).
Decentralised energy is being promoted both by national government and
the GLA, and there is now 195MW of CHP capacity across London (ranging
from small units in homes to large units in industrial premises). Projections
show that gas combustion in buildings could be responsible for 48% of NOx
emissions by 2025 in Central London.14 There is a risk that measures to
promote decentralised energy could increase local NOx emissions.
• There are additional uncertainties relating to emissions from construction
vehicles and equipment, and specialist vehicles such as refrigerated vans.
ExecutiveSummary 7Overall this implies that current air quality projections should be treated as
a best case scenario, and progress may well be slower. A programme of additional
policies will be required in order to fully address London’s air pollution problem.
Next Steps
In the next stage of this project we will consider a range of possible policy options
to address London’s air quality challenge. These will be modelled quantitatively,
identifying the benefits in terms of reduction in emissions and improvements in air
quality and health, as well as indicative costs.
8 Up in the Air01 London’s Air
Pollution Problem
Introduction
In 2012, Policy Exchange produced a report, Something in the Air,15 on the problem
of air pollution. The report highlighted the significant health effects and economic
costs associated with air pollution. It recommended a range of policies to improve
air quality, as follows, several of which have since been taken forward:
• Reducing or removing exemptions from the congestion charge for small
diesel cars, which come under the CO2 emissions threshold but cause local
air pollution;
• Introducing a surcharge for diesel vehicles under the Vehicle Excise Duty regime;
• Ensuring that the Renewable Heat Incentive does not support the deployment
of biomass technologies in cities;
• Ensuring that smoke control and air quality management rules are not
weakened to promote renewable energy in homes and businesses;
• Developing a network of Low Emission Zones for locations where NO2 limit
values are being breached;
• Testing differential parking charges based on the emissions level of the vehicle;
• Carrying out further testing of pollution suppression methods;
• Retrofitting buses with pollution filtering systems, rather than replacing them;
• Introducing a Low Emission Zone around Heathrow airport.
In this follow up project we look more specifically at the problem of air
quality in London, parts of which experience the worst air pollution in the UK.
The project will be delivered in two stages. This first report sets out the context
in terms of the scale of the air pollution problem in London, and is structured
as follows:
• Chapter 1 provides an introduction and policy context;
• Chapter 2 provides information on current air quality and emissions in London,
plus projections of future air quality based on current and planned policies;
• Chapter 3 sets out the case for taking action on air pollution on health and
inequality grounds;
• Chapter 4 provides a summary and initial conclusions;
• Appendix 1 provides an overview of King’s modelling methodology;
• Appendix 2 provides further details on the future health impacts of air pollution.
A subsequent report will consider possible policies to improve air quality in
London, and their potential cost and impact. Both reports are being delivered
by Policy Exchange in partnership with researchers at King’s College London’s
Environmental Research Group.
London’s Air Pollution Problem 9What is Air Pollution?
“Air pollution” is an umbrella term applied to many different airborne substances,
as summarised in Table 1.1. As shown, pollutants can lead to severe health and
environmental effects both at a local level and over a wide area (this is explored
further in Chapter 3):
Table 1.1: Local Air Pollutants16
Pollutant Key sources of emissions Health/environmental effects
Particulate matter Transport (exhaust, tyre and brake Linked to asthma, lung cancer, respiratory and
Typically referred to as wear), combustion, industrial cardiovascular diseases, infant mortality and low
particles under 10µm processes, construction and birth weight.
in diameter (PM10) and demolition, natural sources. The smallest particles are of greatest health
fine particles less than Also created by interaction of other concern (e.g. PM2.5).
2.5µm in diameter pollutants. PM exposure can lead to growth stunting or
(PM2.5) mortality in plants.
Black carbon (a component of PM) contributes
to global warming.
Nitrogen oxides Transport, combustion. Exposure to NO2 can cause lung irritation,
(NOx), including decrease lung function, and increase chance
nitric oxide (NO) and of respiratory infections. Long term exposure
nitrogen dioxide (NO2) is associated with low birth weight babies and
excess deaths.
NO and NO2 are precursors to formation of
Ozone, and acid rain.
NOx can be deposited into fresh water and land,
harming biodiversity in sensitive sites.
Sulphur dioxide Combustion (particularly coal) and Causes irritation of lungs, nose and throat, and
(SO2) road transport. exacerbates asthma.
Precursor to formation of smog.
Forms acid rain, which damages freshwater
environments, soils and vegetation.
Ozone (O3) Formed by reaction of hydrocar- Harms lung function and irritates respiratory
bons, NOx, and Volatile Organic system. Can increase incidence and severity of
Compounds in sunlight. asthma and bronchitis. Long term exposure can
lead to cardiorespiratory mortality. Acts as a
powerful greenhouse gas. Stunts plant growth.
Carbon monoxide Road transport (particularly petrol), Headaches, nausea, dizziness, affects lung
(CO) combustion, industry. performance.
CO arises from incomplete Precursor to formation of Ozone.
combustion.
Benzene (C6H6) Evaporation and combustion of Cancer, leukemia.
petroleum products.
Heavy metals (e.g. Combustion, industrial processes. Nausea, diarrhoea, abdominal pain, irritation
arsenic, cadmium, of eyes, nose, throat, and lungs, brain and
lead, and nickel) kidney damage, asthma, respiratory diseases,
lung cancer.
10 Up in the AirThis report focuses on NOx/NO2 and PM pollution. As explored below, NO2
pollution presents the greatest challenge in a London and UK context, and remains
above legal and healthy limits. Historically, PM has also been a significant problem
in urban areas, and whilst emissions have reduced, it still leads to significant health
effects (see Chapter 3). The other pollutants listed above have historically been
an issue, but emissions have now substantially reduced, and are within legal limits.
For example, at UK level sulphur dioxide emissions have fallen by 94% since 1970,
carbon monoxide emissions have fallen by 80% since 1970, and lead emissions
have fallen by 98% since 1990.17
Policy Context
European and UK Air Quality Legislation
The UK is legally bound by a series of European Directives concerning air pollution
and air quality. The European Commission has set an objective to “achieve levels of
air quality that do not give rise to significant negative impacts on human health or
the environment”, and accordingly has developed a substantial body of legislation.18
This commenced with the Air Quality Framework Directive (1996) which
described how air quality should be assessed and managed. Subsequent directives
established standards for a range of pollutants including nitrogen dioxide, sulphur
dioxide, ozone, particulate matter, and heavy metals. The most recent directive in
2008 consolidated existing legislation into a single directive, and was transposed
into English law by the Air Quality (Standards) Regulations 2010, with equivalent
regulations in Scotland, Wales and Northern Ireland.
Table 1.2 Summary of Air Quality Standards in England19,20
Pollutant Concentration Averaging Introduction of Permitted WHO guidelines
(limit value) period limit value exceedances
each year
Nitrogen dioxide 200 µg/m3 1 hour 1st January 2010 18 As per EU limit values
(NO2)
40 µg/m3 1 year 1st January 2010 n/a As per EU limit values
Particulate 50 µg/m3 24 hours 1st January 2005 35 As per EU limit values
Matter (PM10) (time extension
granted to 2011)
40 µg/m3 1 year 1st January 2005 n/a 20 µg/m3
Fine particles 25 µg/m3 1 year 1st January 2015 n/a 10 µg/m3
(PM2.5)
20 µg/m3 1 year 1st January 2020 n/a 10 µg/m3
Standards are set in the form of legally binding “limit values” which Member
States must comply with (Table 1.2). Standards are expressed either in the form of
an annual average concentration, or as a restriction on the number of “exceedances”
over shorter time periods. Crucially, compliance is only reached when the whole
of a zone falls within the limit value.21 Failure to comply with the air quality limits
London’s Air Pollution Problem 11ultimately can lead to a significant fine (e.g. up to £300 million per year22), which
in this context would be handed down from UK Government to the Greater
London Authority and London Boroughs. In addition to the limit values, the EU
has set an exposure reduction target for urban background PM2.5, which translates
into a target concentration of 11μg/m3 for the UK in 2020.23
The standards set under this legislation are largely based on health-related
evidence and guidelines from the World Health Organisation (WHO).24 It is
notable that in the case of PM, the EU limit value has been set at a higher level
(i.e. less stringent) than suggested in WHO guidelines, suggesting that there will
be health effects even if the European limits are met.
The UK has complied with limit values for sulphur dioxide, lead, benzene
and carbon monoxide for some time. In the case of PM10, the UK failed to
meet limit values by the original deadline of 2005, which led to the European
Commission bringing forward legal action against the UK,25 as well as the UK
applying for a time-extension to 2011. Greater London was the final part of UK
to achieve compliance with the daily and annual limit values for PM10, which it
did for the first time in 2012.26 Greater London is compliant with the current
limit value for PM2.5, but currently looks set to breach the tighter limit value
being introduced from 2020 onwards.27
However, the UK faces a much greater challenge in meeting limit values for
NO2. When NO2 limits came into force in 2010, there were 40 “zones”28 or parts
of the UK which were non-compliant (one of which was Greater London). In
2011, Defra applied for a time extension to 2015 with an aim to meet NO2 limits
“as soon as possible”. However, the plans drawn up at that time showed that many
zones would not reach compliance until 2020 or 2025, and that Greater London
(along with two other zones) would not reach compliance until at least 2030.29
The latest data from Defra shows that 38 zones still exceeded limit values for NO2
in 2013 (including Greater London).30 Separately, Defra confirmed that 194 Local
Authorities exceeded NO2 limit values in 2013.31
The UK is not alone in failing to meet air quality standards, with more than
half of the EU Member States currently under infringement procedures for at least
one pollutant.32 Research has shown that London ranks 15th out of 36 major global
cities in terms of overall air quality – behind many other European cities such
as Stockholm, Vienna and Berlin, but ahead of others such as Madrid, Warsaw,
Rome, Munich and Milan.33 The same study showed that relative to other cities,
London has a particularly bad NO2 problem, with similar levels of NO2 as cities
such as Shanghai and Beijing, which are amongst the worst cities globally in terms
of overall air quality.
The failure to comply with NO2 limits resulted in two court cases against the
UK government concerning its air quality plans. In the first case, the European
Court of Justice ruled that the UK must put in place a plan to achieve air quality
standards in the “shortest time possible”. Subsequently, in April 2015, the UK
Supreme Court ordered the Government to redraft the national action plan for
nitrogen dioxide (NO2) by 31st December 2015, as well as zonal action plans
(including for Greater London), to ensure compliance with legal NO2 limits as
soon as possible.34
In response to this, Defra released and consulted on a draft plan in September
2015. This outlines a package of measures including a national network of Clean
Air Zones in major cities by 2020 (akin to the London Ultra Low Emissions Zone),
as well as a host of local measures. The draft plan has been criticised by air quality
12 Up in the Airgroups such as Clean Air in London and ClientEarth for being “inadequate”. A central
criticism is that the document is essentially a “plan for a plan by others”, passing
responsibility for compliance with NO2 limits to Local Authorities without any
new powers or resources.35 Another concern raised is the extent to which Defra’s
plan has met the requirement to achieve air quality standards in the “shortest time
possible”. Defra modelling, published as part of the consultation, indicates that
most zones will not achieve compliance until 2020, and 2025 in Greater London.
However, in the case of Greater London, it is unclear which of the measures
identified are new, particularly given that London is already planning to introduce
a “Clean Air Zone” in the form of the Ultra Low Emission Zone (discussed below).
Chapter 2 of this report sets out more detailed modelling for the Greater London
area (produced by Tf L, GLA and King’s College London) which suggests that
London will fail to reach compliance by 2025 based on current and committed
policies. Moreover, monitoring data shows that London roadside NO2 levels have
not improved significantly in recent years. There is a clear mismatch between this
and Defra’s modelling.
Either way, it appears that under current plans it will take at least 10 years to
bring air quality within legal limits, and significant additional effort will be required
to reach compliance “as soon as possible”. Indeed, ClientEarth, who brought the
Supreme Court case in the first place, are threatening new legal action unless the
plan is improved.36
Vehicle Emissions Standards
The EU has introduced a set of emissions standards (“Euro Standards”) which
regulate emissions from new petrol, diesel and gas vehicles. These standards are
denoted by Euro 1 – 6 for cars and light goods vehicles, and Euro I – VI for heavy
duty vehicles. The standards have introduced progressively tighter limits for both
PM10 and NOx emissions from all vehicle types.
Table 1.3: Euro Emissions Standards37
Petrol car (g/km) Diesel car (g/km) Heavy Duty
vehicles (g/kWh)
NOx PM10 NOx PM10 NOx PM10
Euro 1 (1992) 0.97* - 0.97* 0.140 Euro I (1992) 8.00 0.36
Euro 2 (1996) 0.50* - 0.70* 0.080 Euro II (1996) 7.00 0.25
Euro 3 (2000) 0.15 - 0.50 0.050 Euro III (2000) 5.00 0.13
Euro 4 (2005) 0.08 - 0.25 0.025 Euro IV (2005) 3.50 0.02
Euro 5 (2009) 0.06 0.005 0.18 0.005 Euro V (2008) 2.00 0.02
Euro 6 (2014) 0.06 0.005 0.08 0.005 Euro VI (2013) 0.43 0.01
* For Euro 1/2 the limit values related to NOx + Hydrocarbon emissions (i.e. unburnt fuel).
London’s Air Pollution Problem 13In theory, the introduction of these limits should reduce emissions as vehicles are
replaced with newer, less polluting models. However, as discussed in Chapter 2, this
has not turned out to be the case to date, as “real-world” emissions have not reduced in
line with standards and even the newest vehicles have emissions well above legal limits.
These standards, and their effectiveness, are particularly important in a London
context, since some of the key policies being implemented in London (e.g. the Low
Emission Zone and Ultra Low Emission Zone, described below), rely on this
system to categorise and charge vehicles.
Greater London
Air quality in London has been a key policy issue for a very long time. As early as
1285, fumes from coal burning in London were considered so serious that the world’s
first air pollution commission was created. A Royal Proclamation in 1306 attempted
to ban the burning of coal in London – ultimately unsuccessfully since there were no
economic alternatives.38 The health effects of smoke in London were recognised as
early as the 1600s.39 Fast forward to the 1950s, and London was experiencing regular
“pea soupers”, with adverse weather conditions trapping acute levels of smog in
the city. It is thought that the Great Smog of 1952 may have killed 4,000 people.
Again the situation was so bad that it led to new legislation, this time in the form of
the 1956 Clean Air Act, which led to the phase out of burning coal in London.40
Much more recently, air pollution has been a significant focus of the Mayor of
London under both Ken Livingstone and Boris Johnson. The Mayor has a legal
responsibility under the Greater London Authority Act (1999) to develop an Air
Quality Strategy to achieve European air quality standards and objectives (described
above). The London Mayor has control (either directly or through London Boroughs)
of many policies related to air quality, such as transport and development planning.
The first Mayor’s Air Quality Strategy in 2001 introduced a raft of proposals
including: the creation of the Congestion Charge Zone, a feasibility study for
a Low Emission Zone, investment in public transport, grants for low emission
vehicles, and measures to target emissions reductions in buses, taxis and HGVs.41
Even so, it was clear at the time that the proposed measures would not be sufficient
to meet NO2 or PM10 limits.42
The Low Emission Zone was eventually introduced in 2008. Under the scheme,
heavy duty vehicles that do not comply with certain Euro standards (Euro IV for
HGVs, buses and coaches; and Euro III for vans, minibuses and pickups) must
either be retrofitted to reduce emissions, or face a charge of £100–200 per day to
drive in the Low Emission Zone. The scheme covers most of Greater London and
operates 24 hours per day. Cars and motorbikes are not covered by the scheme.
The Mayor’s Air Quality Strategy was updated in 2010 to include the following
additional policies:43
• Support for the uptake of low emission electric and hydrogen vehicles;
• A scrappage scheme for older vehicles, and grants for retrofitting older vehicles;
• An age limit for black cabs (15 years) and private hire vehicles (10 years). This
has retired more than 3,000 taxis since it was introduced in 2012;
• Investment in cleaner hybrid and hydrogen buses with 1,700 hybrids on the
road by 2016;
• Retrofitting 1,000 older buses, and retiring 900 of the oldest buses and
replacing them with Euro VI buses;
• Investments in public transport such as Crossrail, electrification of the rail network,
tube network upgrades, Cycle Superhighways and the Cycle Hire scheme;
14 Up in the Air• Best practice guidelines to reduce emissions associated with construction and
demolition sites;
• A requirement for new developments to be “air quality neutral”;
• Emissions limits for biomass and Combined Heat and Power (CHP) boilers;
• The RE:NEW and RE:FIT programmes to improve energy efficiency in homes,
commercial buildings and public buildings;
• Investments in “green infrastructure” including tree planting and green roofs;
• The Mayor’s Clean Air Fund, with £5m of funding to target innovative
pollution reduction measures, such as dust suppressants, green walls and other
green infrastructure, and a no engine idling campaign across central London.
The strategy stated that the measures would be sufficient to achieve PM10 limit
values by 2011, but that it would not deliver a sufficient improvement in NO2 to
meet legal limits. Boris Johnson has stated that he wants London to be compliant
with NO2 legal limits by 2020 at the latest,44 and subsequently proposed two other
major policies to tackle air pollution:
• A new Ultra Low Emission Zone (ULEZ) is proposed to be introduced in
2020, covering the same area as the Congestion Charge Zone, and operating
24 hours per day. All vehicles (including cars, motorcycles, buses, taxis, HGVs)
will have to either comply with specific emissions standards, or pay a daily
charge (in addition to charges under the Congestion Charge and the Low
Emission Zone). Diesel vehicles meeting Euro 6 standards, and petrol vehicles
meeting Euro 4 standards, will be exempt from the charge. There will also be
an exemption for historic vehicles, plus a three year exemption for residents
of the ULEZ area.
• The GLA has introduced a policy concerning Non-Road Mobile Machinery
(NRMM) which comprises vehicles and equipment used on construction
sites such as cranes, diggers, diesel generators, and smaller equipment such as
chainsaws and hedge-trimmers.45 NRMM is a significant source of PM10 and
NOx emissions. As of September 2015, NRMM equipment used in London will
be required to meet specific Euro emissions standards, with tighter standards
applied within a “Central Activity Zone”, and less stringent standards applying
to major development sites in the rest of Greater London. The policy contains
exemptions in cases where equipment is only used intermittently, or where
compliant equipment is not available in sufficient quantities. The standards
applied in London will be tightened from 2020 onwards.
Summary
The key findings from this Chapter are as follows:
• Improving London’s air quality is a significant, long-running and
complex challenge.
• London is currently in breach of legal and healthy limits for NO2 pollution,
and PM10 and PM2.5 levels remain above health guideline levels.
• Exposure to high levels of NO2 and PM can cause a wide range of serious
health conditions.
• London has put in place a large number of policies to address air pollution,
however based on current plans it appears that air quality will not come within
legal limits until at least 2025, and perhaps later.
• London has a legal duty to reach compliance with NO2 limits in the shortest
time possible.
London’s Air Pollution Problem 1502 Air Quality Trends
This Chapter provides a review of data on air quality in London – identifying
trends for key pollutants such as NOx and PM. This is largely based on two key
sources of information:
• Air Quality Monitoring Data. This data is derived from the London Air
Quality Network (LAQN), a network of over 100 air quality monitoring sites
located around London. This is the most reliable source of information on air
quality, based on actual measurements on the ground. However this dataset
only provides a partial picture. By its nature it is backward looking, and is
limited by the number of monitoring sites. It provides data on the overall
concentration of pollution at monitoring sites, rather than emissions from
individual sources.
• London Atmospheric Emissions Inventory and Air Quality Modelling.
We also present modelled estimates for air quality and emissions in 2010,
2020 and 2025 across all of London. These estimates are taken from an
interim update to the London Atmospheric Emissions Inventory, which
was developed by Transport for London, GLA, and King’s College London,
as part of the assessment of the Ultra Low Emission Zone. This represents
the most up to date set of models for air quality in London. Unlike the
monitoring data, this dataset provides estimates for air quality and emissions
for all locations in London (down to 20 metre by 20 metre resolution), and
also provides additional information such as the emissions from different
sources. The projections for 2020 and 2025 reflect the projected impact of
all current and committed policies (i.e. those identified in Chapter 1). It is
important to note that this information is based on modelled estimates, which
whilst calibrated to current measurements, are based on a large number of
assumptions. A number of issues have been identified with the projections,
as discussed later in this chapter. Whilst these issues do not undermine the
modelling results entirely, they do mean that the results should be interpreted
with a degree of caution.
Recent Trends in Air Quality
The overall trend in air quality in London has been mixed over the past two
decades, with more progress on some pollutants than others. Figure 2.1 provides
summary data from the London Air Quality Network for concentrations of SO2,
for roadside locations in inner and outer London (denoted by “RSInner” and
“RSOuter”), urban background readings (“BG Outer” and “BG Inner”) and for
the sensor at Marylebone Road (“MY1”), one of the most polluted locations
in London. As shown, there has been a sharp decline in sulphur dioxide (SO2)
concentrations since 1998 at all locations (Figure 2.1).
16 Up in the AirFigure 2.1: Trend in Measured Concentrations of sulphur dioxide (SO2)46
30
25
20
SO2 (µgm-3)
15
10
5
0
1998 2000 2002 2004 2006 2008 2010 2012 2014
MY1 RSOuter BGOuter
RSInner BGInner
However, there has been relatively less progress in tackling NO2 concentrations
(Figure 2.2). NO2 concentrations at roadside locations in Inner London have
remained largely static since the early 2000s, and remain well above the legal limit
of 40 µg/m3. This is consistent with data for the UK as a whole, which shows
that there has been limited improvement in NO2 concentrations since around
2002.47 Whilst there has been a significant improvement in NO2 concentrations
at Marylebone Road, other locations have seen persistently high levels of NO2.
For example the average NO2 concentration at Oxford Street in the 12 months to
August 2015 was over 150 µg/m3 – nearly four times the legal limit.48
Levels of PM10 have seen some improvement since 2004, with the worst
locations such as Marylebone Road coming within the European limit since 2013.
However, PM10 concentrations are still well above WHO guideline levels (20 µg/m3)
at roadside locations in London.
Figure 2.2: Trend in Measured Concentrations of nitrogen dioxide (NO2)49
150
100
NO2 (µgm-3)
50
0
1998 2000 2002 2004 2006 2008 2010 2012 2014
MY1 RSOuter BGOuter
RSInner BGInner
Air Quality Trends 17Figure 2.3: Trend in Measured Concentrations of Particulate
Matter (PM10)50
50
40
PM10 (µgm-3)
30
20
10
0
2004 2006 2008 2010 2012 2014
MY1 RSOuter BGOuter
RSInner BGInner
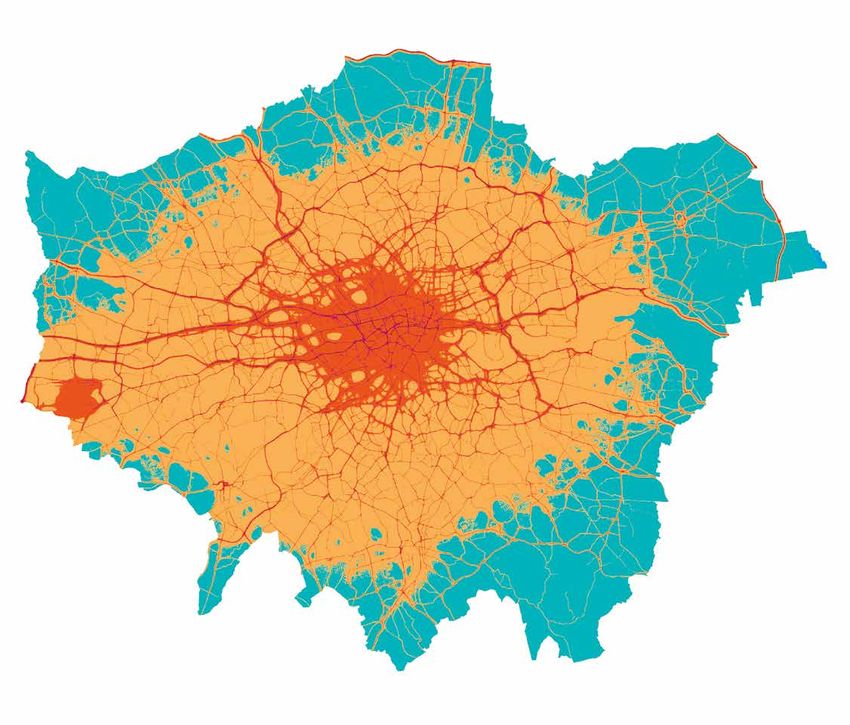
The air pollution problem in London is geographically concentrated in certain
areas. As shown in Figure 2.4, the annual NO2 concentration limit of 40µg/m3 is
exceeded in most of Central London, as well as around Heathrow and major roads
around London. Indeed, Policy Exchange analysis shows that 12.5% of the total
area of London51 currently exceeds the limit value for NO2 – a total of 292 sq
km. Within this, an area of 14 sq km exceeds the limit value by more than a factor
of two (i.e. >80µg/m3). The maps relate to the year 2010, but as shown above there
has been relatively little change in pollution concentrations since this time.
Figure 2.4a: Modelled Concentrations of NO2, 201052
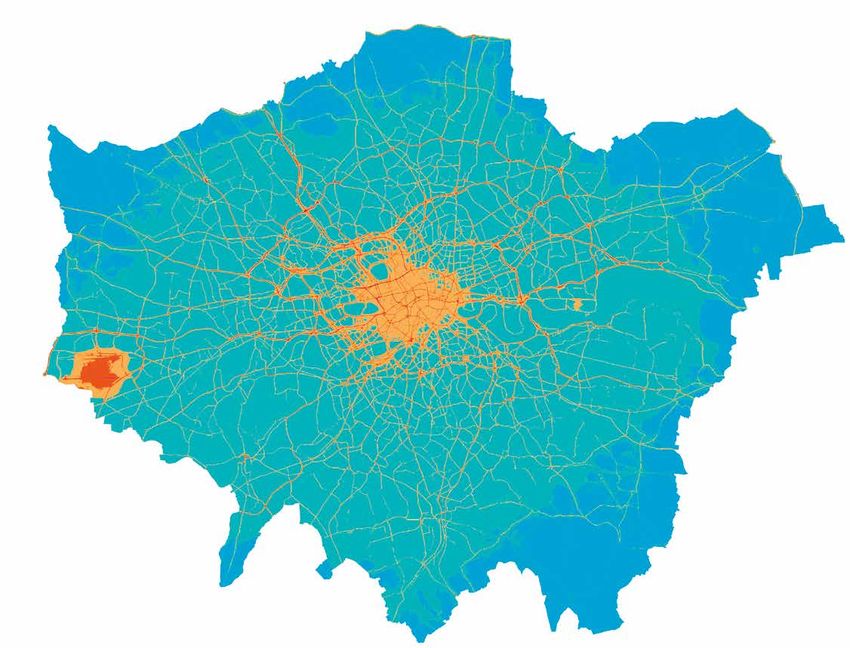
2010 NO 2 Annual Mean (µg m-3)Figure 2.4b Modelled Concentrations of PM10, 2010
2010 PM10 Annual Mean (µg m-3)
19–20
20.1–30
30.1–39.9
40µg m-3 EU limit value
40–60
60.1–80
80.1–83
0 2.5 5 10
Kilometres
The picture is very different in terms of PM10 concentrations. The majority of
the Greater London area (88%) has an annual average PM10 concentration below
the European limit value (40µg/m3), but above WHO guideline levels (20µg/m3),
with the remaining 12% falling below WHO guideline levels. Again, the impact
of road transport can be identified on the maps – with the highest concentrations
found close to major roads.
Why the Lack of Progress on NO2?
As outlined in Chapter 1, there are now numerous policies in place aimed
at tackling air pollution in London. However, the data above shows that
there has been limited progress on NO2 pollution in recent years. This is due
to the increasing trend towards diesel vehicles in the UK fleet; combined
with the systematic underperformance of diesel vehicles against emissions
performance standards.
“Dieselisation” of the Vehicle Fleet
There has been a rapid and significant shift towards diesel vehicles in the UK in
recent years, as in many other European countries. In 1994, there were 1.6 million
diesel cars on the road in Great Britain, making up 7% of the total fleet. Diesels
increased from 18% of all new cars sold in 2001, to over 50% from 2011. There are
now 10.7 million diesels on the road, making up 36% of the total fleet.53 A similar
growth in diesel vans and light goods vehicles has also taken place, where diesels
went from 51% of the total fleet in 1994, to 96% in 2014.
Diesels have been promoted heavily by successive Government since the 1990s,
on the basis that they achieve greater fuel efficiency and lower CO2 emissions and
are therefore preferable on climate change grounds. The greater fuel efficiency of
diesels provides an economic advantage, but this has been increased further through
Air Quality Trends 19government policy. In 2001–02 the UK began taxing vehicles according to CO2
emission rates. Cars with lower carbon dioxide (CO2) emissions fell into cheaper
Vehicle Excise Duty (car tax) bands, which gave diesels a further cost advantage,
and contributed significantly to the subsequent “dash for diesel”. This incentive was
effectively removed in the Summer 2015 budget, since from 2017 almost all new cars
will pay a standard VED rate.
In addition, legally binding EU-wide CO2 emission targets for manufacturers
gave them added incentives to bring lower emission vehicles to the market. The
combination of these factors has meant that diesels have been a more economic
option overall for motorists, despite costing slightly more up front, particularly for
drivers who do a lot of miles.
Whilst diesels have been favoured for CO2 reasons, they emit far higher
emissions of NOx and PM than equivalent petrol vehicles. For example, under the
Euro 3 emissions limits introduced in 2000, the limit value for diesel cars (0.5g/km)
was more than three times that of petrol cars (0.15g/km), and this disparity was
maintained under Euro 4 and Euro 5. Moreover, as discussed in the next section,
diesel cars have systematically failed to achieve the stated emissions limits in
practice, whereas petrol cars generally have not. Barry Gardiner MP, the shadow
energy minister, has acknowledged that the policy to promote diesels under
Gordon Brown’s government was a mistake, with a lack of evidence at the time
on the air quality impact of diesels.54
The switch to diesel has resulted in CO2 savings. Research shows that the
impact of UK consumers switching from petrol to diesel cars from 2001 onwards
has been a saving of 0.4 megatons (Mt) of CO2 and 1 million barrels of oil.55
However, the CO2 advantage associated with diesels has now been eroded, with
diesel and petrol cars now achieving similar CO2 emissions per km (126.5g
CO2/km for petrol, compared to 124.9g CO2/km for diesels).56 Therefore, the
Government’s original rationale for supporting diesel is no longer valid in any
case. Moreover, research suggests that if the climate change impact of black carbon
emissions (a component of particulate matter) from diesels is taken into account,
then this more than offsets the CO2 saving.57
Failing Emissions Standards
Compounding the trend of “dieselisation” of the fleet is the fact that diesel
vehicles have failed to perform in line with Euro emissions standards in practice.
Researchers at King’s College London undertook testing of over 80,000 vehicles
at roadside locations in 2011.58 This found that there had been little or no
improvement in terms of NOx emissions from diesel cars, vans, HGVs or buses over
the preceding 20 years, although it identified a significant improvement for petrol
cars (see Figure 2.5, “remote sensing data”). The study estimated that Euro 5 diesel
cars in practice emit over 1.1g of NOx per km – more than five times the Euro 5
emissions limit of 0.18g/km, and more than even the Euro 1 limit of 0.97g/km.
These findings were confirmed in a more recent study by the same
authors, which showed that Euro 5 diesel cars perform no better in terms of
NOx emissions than pre-Euro 1 vehicles.59 A range of other studies have come
to similar findings, for example a study by the European Joint Research Centre
concluded that petrol cars largely perform within Euro emissions limits, but
diesel cars have emissions 4 to 7 times higher than the limits, and showed little
improvement between Euro 3 and Euro 5.60
20 Up in the AirFigure 2.5: Real World Performance of Vehicles, by Euro
Classification61
petrol car diesel car diesel LGVs
2.5 1.2 2.0
2.0 1.0
1.5
0.8
1.5
0.6 1.0
1.0
0.4
0.5 0.5
0.2
Euro–0
Euro–1
Euro–2
Euro–3
Euro–4
Euro–5
Euro–6
Euro–0
Euro–1
Euro–2
Euro–3
Euro–4
Euro–5
Euro–6
Euro–0
Euro–1
Euro–2
Euro–3
Euro–4
Euro–5
Euro–6
NOx (g km-1)
rigid HGV urban bus
4 14
12
3 10
Emission factors
8 current UK factors
2 HBEFA (2010)
6
remote sensing data
1 4
2
Euro–0
Euro–1
Euro–II
Euro–III
Euro–IV
Euro–V
Euro–VI
Euro–0
Euro–1
Euro–II
Euro–III
Euro–IV
Euro–V
Euro–VI
Euro classification
NOx emissions consist of a mix of nitrogen dioxide (NO2) and nitrogen oxide
(NO). NO2 can lead to significant health effects, and is therefore of the greatest
concern. NO itself is much less harmful but can oxidise in the air to form NO2.
Research has shown that the mix of NO2 and NO in diesel exhaust has changed
over time, with an increase in NO2 emitted directly (known as “primary NO2”).
The proportion of NOx which is primary NO2 increased from 10–15% for Euro
3 vehicles, to 30% for Euro 4/5 diesels, and up to 60% for Euro 4/5 diesels with
larger-engines.62 Given that overall NOx emissions from diesels have not reduced
(up to Euro 5), this means that primary NO2 emissions actually increased in
practice, despite the introduction of progressively tighter Euro standards. This is
consistent with the fact that roadside NO2 concentrations have remained high,
whilst urban background concentrations have decreased (see Figure 2.2).
The failure of Euro standards to control emissions is in large part due to vehicle
testing regime, which has a large number of weaknesses that vehicle manufacturers
have been able to exploit. Vehicle manufacturers are required to test new vehicles
to demonstrate that they have met the prevailing standards. But the independence
of the European testing regime has been called into question, since carmakers
generally oversee and conduct the tests themselves.63
Air Quality Trends 21The tests are currently performed in laboratory conditions, and it has been
argued that they do not adequately represent real world driving conditions
– particularly urban driving conditions.64 The test cycle is “unrealistic and
undemanding”, with cars able to accelerate slowly under relatively low engine loads,
and therefore fails to represent real-world driving conditions.65 Also, some of the
main technologies used to control emissions from diesels (e.g. Diesel Particulate
Filters and Selective Catalytic Reduction) are influenced by operating conditions,
and perform less well in the stop-start traffic conditions found in cities. A report
for the RAC Foundation, commenting on the performance of these technologies,
stated that: “in this slow speed, stop start operation, the control technology did not reach
a sufficiently high temperature to operate at maximum efficiency for much of the time.”66
Moreover, vehicle manufacturers have employed a range of increasingly
sophisticated strategies simply to pass the test itself, leading to an increasing gap
between test figures and actual world performance. In the main these strategies are
legal, exploiting loopholes and weaknesses in the test regime, such as disconnecting
the alternator, stripping out excess weight, testing at high temperatures, and taping
up seams and removing wing mirrors to improve aerodynamics.67 However, some
manufacturers have gone further still. Volkswagen has recently admitted to using
illegal means to cheat emissions tests.68 This relates to an engine used in 11 million
diesel vehicles sold globally between 2009 and 2015, 1.2 million of which are
thought to have been sold in the UK, which equates to more than 10% of the entire
diesel car fleet in the UK.69 VW has now said that all 1.2 million cars will need to
be recalled,70 although it remains unclear what impact this will have in terms of
the performance or emissions of these cars.
These issues are linked to the wider issue of vehicle performance figures not
matching up with reality. For example, it has been shown that in the case of fuel
efficiency and CO2 emissions, the gap between official figures and real world
performance has grown from around 10% in 2002 to around 35% in 2014.71
A key question going forward is whether the Euro 6 standard will fare any
better than previous standards. Euro 6 has a far more explicit focus on reducing
NOx than the previous Euro standards, which focused more on reducing PM
emissions. Evidence on the performance of Euro 6 vehicles is relatively scarce, since
the standards have only just been introduced. The evidence that exists shows that
although Euro 6 has led to an improvement, NOx emissions from Euro 6 diesels are
still well above limits. For example, a study by the Transport Research Laboratory
identified that a sample of Euro 6 diesels had NOx emissions of 2.5 times the Euro 6
limit, although this was still a 65% reduction on Euro 5 performance.72 Several other
independent studies have shown that emissions from Euro 6 diesel cars are 2.5 to 7
times higher than legal limits in practice.73 One study of Euro 6 diesel cars showed
that real-world emissions of NOx were 7 times the emissions limit for Euro 6 on
average, and of the 15 cars tested only one met the Euro 6 standard.74 In the same
study, the worst performing car exceeded the Euro 6 limit by a factor of 25 times.
Whilst the performance of Euro 6 diesel cars is highly questionable, there is
evidence of some improvement with Euro VI heavy duty diesel vehicles. Recent
analysis by Tf L showed Euro VI trucks achieving a 77% reduction in real world NOx
emissions compared to Euro V trucks, and a 98% reduction for Euro VI buses.75
This is due to a significant improvement in NOx emissions at lower speeds, which is
particularly important in the context of urban driving conditions.76 If the estimated
savings from Euro VI are delivered in full, this would mean that new Euro VI buses
and HGVs would have lower NOx emissions than many Euro 5 diesel cars.
22 Up in the AirFigure 2.6: Comparison of Euro V versus Euro VI NOx Emissions over a
Range of Road Speeds77
25
20
NOx g/km
15
10
5
0
0 10 20 30 40 50 60 70 80 90
Speed / kph
Euro V rigid 18 tonne HGV London driving
Euro VI rigid 18 tonne HGV London driving
The issues with the vehicle testing regime could potentially be overcome
through the introduction of a new test protocol to better reflect real world driving
conditions. The Euro 6 regulations propose the introduction of a new Real-world
Driving Emissions (RDE) test, which will use a portable emissions testing system
fitted to cars on the road to better simulate real world driving conditions. Until
recently there was still uncertainty about when the RDE tests would be introduced,
but in the wake of the Volkswagen emissions scandal, the European Parliament
has decided that the RDE test will be implemented from 2017.78 There has been
an ongoing debate about the exact RDE standards that will be applied. Carmakers
have been calling for a “conformity factor” of 5 to be applied, which would mean
that real world emissions up to five times the legal limit would still be permissible
under the new RDE test.79 This is little better than current Euro 6 performance,
hence NGOs have been calling for the original NOx limit of 0.08g/km to be applied
(i.e. a “conformity factor” of 1).80 The European Commission recently agreed that
the “conformity factor” should be set at 2.1 for new models from September 2017
(for all new vehicles by September 2019), and for this to be further tightened to
a conformity factor of 1.5 for new models by January 2020 (by January 2021 for
all new vehicles).81 This means that current models, including those which do not
conform to the Euro 6 standard in practice, can be sold until September 2019. This
has been criticised by NGOs as still being too weak and letting car manufacturers
off the hook.82
Sources of Air Pollution
This section provides data on the key sources of emissions, which is helpful in
order to further understand the air pollution problem. The following data is mainly
drawn from the emissions models which underpinned the development of the
ULEZ policy. Whilst this is the most detailed set of emissions models currently
available for London, there are some identified issues with the modelling approach
as discussed throughout this chapter, which mean that the models are likely to
underplay the importance of road transport emissions.
Air Quality Trends 23It is worth noting first that there is a link between the emissions produced
in an area and the local concentrations; however certain forms of pollution can
travel greater distances than others. Analysis by the GLA suggests that 25% of PM
pollution in Greater London is attributable to sources within the city, and 75%
to sources outside the city. By contrast, NO2 is a far more localised problem, with
82% of London’s NO2 pollution generated within the city and only 18% brought
in from elsewhere.83 This suggests that policies to tackle air pollution will need both
a national and local focus.
Turning to emissions produced within the Greater London area, 45% of total
NOx emissions are from road transport (Figure 2.7). Within this, the principal
sources are diesel cars, HGVs, petrol cars, and buses. Other important sources
of NOx emissions within London are domestic gas (13%), non-domestic gas
(8%), and rail (8%). Another significant source is Non Road Mobile Machinery
(NRMM) which includes vehicles and equipment used on construction sites such
as cranes, diggers, diesel generators, and small equipment.
This pattern is somewhat different to the UK as a whole. Defra’s recent
consultation on a new air quality strategy suggests that around 80% of NOx
emissions across the UK relate to transport, and attributes one third of road
transport emissions to diesel cars. This suggests that national level policies may
need to be modified slightly in a London context to reflect other important
sources of pollution.
Figure 2.7: Breakdown of NOx Emissions in Greater London in 2010,
by Source84
Rail River
Other 8% 1%
1%
NRMM
10% Taxi
2%
Diesel Car
Industry 11%
7%
Non-TfL HGV
Road Transport Bus and 11%
45% Coach 2%
Gas: Van
Non- 5%
Domestic
8% Gas:
Domestic Petrol Car TfL Bus
13% 7% 7%
Motorcycle
0%
Aviation
7%
The breakdown of NOx emitted in Central London is somewhat different to
Greater London as a whole, with non-domestic gas combustion playing a far more
significant role (33% of NOx emissions in Central London as opposed to 8% in
Greater London). Road transport contributes a similar proportion of overall NOx
emissions overall, although with a different mix of vehicle types: buses, coaches,
HGVs and taxis85 cause a large proportion of road emissions in Central London,
whilst private cars are less important (compared to Greater London as a whole).
Aviation, domestic gas, rail, and industry also play a less significant role in NOx
emissions in Central London than they do in Greater London.
24 Up in the AirYou can also read