Communication, mainstream media, and Twitter: A summative content analysis of the concepts surrounding the COVID-19 pandemic during 2020 - Western ...
←
→
Page content transcription
If your browser does not render page correctly, please read the page content below
Volume 15 Issue 1 2021

 Communication, mainstream media, and
 Twitter: A summative content analysis of the
 concepts surrounding the COVID-19 pandemic
 during 2020
 Ray Archee
 Western Sydney University

 Abstract
 For most of 2020, the entire world was subjected to daily breaking news, television forums, health
 announcements and references to risk about the coronavirus. Australians have been varyingly warned,
 given instructions, locked down, and unlocked down. Rates of infection, death tolls, social
 restrictions and vaccines were major topics of conversation with people from all walks of life. The aim
 of this paper is to identify and explain the main concepts on Twitter surrounding the pandemic during
 its peak in Australia. Using English language text data surrounding the coronavirus from the Twitter
 platform, the most popular themes are identified from April to September 2020. Summative content
 analysis of the data is accomplished using Voyant-tools software for each month. The main
 conceptual contexts are then discussed and interpreted in terms of the corpus, mainstream news
 media analysis and relevant scholarly research findings.

 Introduction
 There is a substantial similarity between the current COVID-19 pandemic and the Spanish Flu
 pandemic of 1918 when 500 million people were infected – representing one third of the world’s
 population – and is estimated to have taken 50+ million lives. Comparatively, in both 1918 and most
 of 2020, there were no effective drugs or treatments. In 1918, citizens were ordered to wear masks
 and schools and businesses closed down, anticipating similar policies in today’s lockdowns. The
 Spanish Flu was caused by the H1N1/A virus, now known as the common flu. Most people today have
 been affected by the influenza virus, but do not die because of effective antibiotics to treat secondary
 infections and inherited immunity (Yu, X. et al., 2008). However, in 2017, an estimated 1200
 Australians died of influenza as opposed the current Australian COVID-19 death toll of about 900.

 In 2003, the SARS outbreak in Asia caused both health and economic problems, revealed public and
 governmental fears, and exposed some inadequacies of risk communication at the time. The actual
 risk of contracting SARS during the 2003 crisis had a large effect on provision of health services, but
 it was negative public perception which allegedly caused the majority of economic and societal
 impacts (Knobler, et al., 2004). The decrease in public confidence in health measures resulted in an
 increase in panic responses by the public, leading to a variety of community behaviours. These
 effects were generated when health risk communication messages were too weak or extreme, or
poorly communicated, or when they contradicted other sources of official public messages. Similar
public relations consequences have been identified for successive disease outbreaks such as the
2009 H1N1 outbreak (Teasedale & Yardley, 2011) and the 2015 MERS coronavirus outbreak (Kim, et
al., 2017) in the Middle East.

Given contemporary reach of international media reports, and 24/7 social media sharing, the 2020
COVID-19 pandemic is probably the most viewed, most shared, and most extensively covered ‘event’
affecting all of humanity since WWII (The Economist, 2020). At the end of December of 2019, most
countries witnessed the intermittent media coverage of a disease linked to Wuhan, China that later
became a pandemic. The first recorded Australian case occurred on January 25 – a man who flew in
from Guangdong province in China. In the UK (on January 29) a Chinese tourist was the first case,
and USA on (January 20) it was a local citizen returning from Wuhan. All three governments decided
to cautiously play a game of ‘wait and see’ but responded differently to the early signs of the
pandemic. When most English-speaking countries began experiencing soaring COVID-19 cases, the
UK announced an early national lockdown from March 23 to May 28, with Australia closing its borders
on March 20 and imposed whole state lockdowns from March 30. The situation was decidedly
piecemeal in the USA – in March only a few states introduced stay-at-home orders, and the US closed
its borders to non-essential travel a month later, on April 20. In contrast to the UK, the US did not
introduce a nation-wide lockdown, instead allowing individual states to decide on the extent of
restrictions, such as business closures, non-essential services, wearing of masks, and physical
distancing.

A more recent World Health Organisation report on Critical Preparedness, Readiness and Response
Actions for COVID-19 Interim Guidance (November 4, 2020) specified four transmission scenarios for
responding to the situational aspects of communities, cities, states and countries. It offers guidelines
that specify emergency responses, risk communication strategies, surveillance, and contact tracing
for different scenarios. The scenarios are: 1. no cases; 2. sporadic cases; 3. clusters of cases; 4.
community transmission. These stages vary greatly within various countries around the world, with
many nations still experiencing large numbers of cases and unacceptable death rates. Thus, the early
research activity surrounding the uncategorised responses was not only permeated with a sense of
urgency to find a treatment or vaccine, but was also energised with attempts to describe, analyse and
understand the human conditions and reactions to this infectious disease. Traditional media and
public health messages, government laws, organisational and community responses were all being
examined by researchers worldwide. Over 40,000 articles can be found on Google Scholar for the first
six months of 2020 using the single search term ‘coronavirus’. The earliest medical research
surrounding the novel coronavirus described and warned about a new disease that had the hallmarks
of a global pandemic (Fan, Zhao, Shi & Zhou, 2019; Xiao, Bang & Kang, 2020).

Social media has become the preferred alternative to mainstream media for young adults (Shearer,
2017) and thus should be interrogated to show global effects of the pandemic. Social media permits
unique insight into human reactions and allows for searching and recording of worldwide messages
that can be analysed in a variety of ways. Around 83 percent of US journalists use Twitter to both
peruse the news, and to post breaking news ahead of news sites, while Facebook only has 40 percent
of journalists judging it as most valuable (Muck Rack, 2019). All 100 of the top US newspapers utilise
a Twitter account (The Bivings Group, 2016), and Twitter now calls itself a ‘news app’ as opposed to a
social media one (Griffin, 2016). These figures indicate that traditional media have infiltrated the social
media news cycle, and vice-versa. Many Twitter users receive a daily email comprising a custom
digest of curated news articles from around the globe, similar to subscribing to a newspaper or
magazine. This digest is unrelated to who one follows, or who is following the user. Breaking news
journalism is a significant subset of the tweets on Twitter (Hermida, 2010; Bentivegna & Marchietti,
2018) and other social media platforms that allow news to be reposted. Citizen journalists, amateur
photographers, and domestic consumers of news constitute another genre of social media user who
repost from mainstream media sources.

Literature Review
In terms of the research literature, searching for the word ‘COVID-19’ predominantly yields medical
research that is not the chief focus of this paper. However, if one uses two terms, the popular term
‘coronavirus’ and ‘social media’ to search for research articles, the number of peer-reviewed
academic reports diminishes quickly. For the first seven months of 2020, on the ProQuest database
there were only 42 articles with these two keywords in the abstract, and 249 from Google Scholar.
Close inspection of the Scholar papers often revealed a medical focus as opposed to a social media
analysis. A prime reason for this relative lack of research on social media and the pandemic is the
challenging aspect of accumulating large amounts of unstructured social media messages. However,
Australian research using the Twitter platform, can be found in the very early pandemic studies (e.g.
Bruns, 2020).

There are several categories of research article surrounding social media data analysis of the
coronavirus. Social media search indexes (e.g., the Chinese search engine, Baidu, and the messaging
app, WeChat) were supposedly found to be accurate predictors of new cases of coronavirus for 2019
(Qin, et al., 2020) and 2020 (Wang, et al., 2020). The use of these social media platforms gave health
authorities a two-week head start over traditional methods of disease detection.

Warnings about the spread of misinformation and distortion of facts, in other words ‘fake news’, led
the World Health Organisation (WHO) to also declare the disease an ‘infodemic’ as much as a
pandemic (WHO, 2020a; The Lancet, 2020). Kouzy, et al. (2020) sampled Twitter tweets on February
27, 2020 from 11 popular hashtags and categorised tweets according to content and tone. Sixty-six
percent of 673 tweets originated from individual or group accounts, followed by journalists (16.5%).
Serious tweets (91.2%) were by far the largest genre, followed by informational tweets (81.4%) and
humorous tweets (6.1%). The most worrying statistics were that 24.8 percent of all the sampled
tweets contained misinformation and 8.6 percent contained unverifiable information, or speculation.
The authors, however, do not fully explain how they made these judgements. Misinformation or ‘fake
news’ is reiterated by several other researchers who inspected samples of social media text and
photographs (O’Connor & Murphy, 2020; Pulido et al., 2020).

Mental health problems have been found to have increased markedly due to people’s association with
social media during the period of the pandemic (Gao, et al., 2020). Social media are indicted as
sources of mental distress, including fear and anxiety, snake-oil treatments, conspiracy theories
(Khan, et al., 2020), xenophobia and racism against people of Asian descent, and fake news (Ho,
Chee & Ho, 2020). Medical advice to combat infection such as physical distancing, self-isolation,
quarantine, and social and economic troubles, and misinformation (especially on social media) has
been found to be major causative factors of abnormal sadness, fear, frustration, feelings of
helplessness, loneliness, and nervousness (Ahorsu et al., 2020). In extreme cases, these factors may
trigger suicidal thoughts, attempts and, in some cases, tragically suicide (Mamun & Ullah, 2020).

Paradoxically, such mental health problems might prove to be assuaged by social media because
social media messages have been evaluated as an overall positive communication medium and
recommended over media such as email as being a faster way of disseminating information from
medical authorities and to physicians (Eghtesadi & Florea, 2020; Castadi, et al., 2020). A similar
recommendation came from researchers who found that the Chinese messaging service, WeChat, can
provide excellent transmission of pandemic information with two caveats: 1. The quality of the
content needs to be high; and 2. The content must be important to the users (Ma, Deng & Wu, 2020).
Early sentiment analysis of two major hashtags on Twitter – #coronavirus and #COVID-19 – has found
that positive tweets (51%) outweighed neutral (34%) and negative tweets (ca. 14%) showing the value
of Twitter to spread good news (Bhat, et al., 2020). By contrast, a more recent study of Indonesian
Twitter sentiment found that neutral tweets (93%) far outweighed positive (6%) and negative (0.7%)
tweets (Fahmi & Ramadhan, 2020). Kaur & Ranjan (2020) took a different approach and plotted
sentiment over 21 days in India, finding that overall negative tweets occurred on only three of the
total days sampled. National findings can be seen to be highly diverse and specific from country to
country, but few studies have focused on global social media responses as a whole.

There is a definite need for ongoing communication research before, during and after a pandemic, in
order to understand global impacts including loss of life, impacts on the health system, economic
shutdown and anxiety induced by inadequate health information (Lurie, Manolio, Patterson, Collins, &
Frieden, 2013), especially as media responses to emerging infectious diseases both in Australia and
overseas seem to over-emphasise risk, and project worst case scenarios (Holland & Blood, 2013).

Twitter is probably the most research-accessible social media platform, and openly invites
researchers to use the platform in its Developer Agreement and Policy stating: “Twitter loves
developers” including researchers (see https://developer.twitter.com/en/developer-terms/agreement-
and-policy). The aim of this paper is to ascertain and explain the main concepts on Twitter from April
to September 2020 found in the collected tweets that formed a corpus of messages.

Method
Content analysis is a research method that has found wide usage in health studies and education
from the latter part of the 20th century. Early justifications of content analysis often focused on its
qualitative vs quantitative benefits. However, rather being seen as a single research method, content
analysis can be grouped into three distinct approaches: conventional, directed or summative. Hsieh
and Shannon (2005, p. 1277) state:
The major differences among the approaches are coding schemes, origins of
codes, and threats to trustworthiness. In conventional content analysis, coding
categories are derived directly from the text data. With a directed approach,
analysis starts with a theory or relevant research findings as guidance for initial
codes. A summative content analysis involves counting and comparisons, usually
of keywords or content, followed by the interpretation of the underlying context.
This paper uses the summative approach to understand the main concepts and themes found in
Twitter messages. The first stage was data collection of six months’ worth of tweets that related to
the search terms, ‘coronavirus’ and ‘COVID-19’. Using the Voyant-tools text analysis website, a
summative content analysis was performed on the corpus of tweets yielding tables of concepts
ranked by popularity for each month and the ability to easily locate such concepts within their month-
based sentence contexts.
The method then attempts to elaborate upon, explain, interpret and make sense of the discovered
concepts and themes by examining their contiguous contexts. Thus, each of the concepts is not only
exemplified by Twitter samples, but also explained in terms of the concurrent risk communication, and
health announcements supplied by Twitter news coverage and mainstream media.
The author employed a piece of custom software written by a colleague that exploited the Twitter API,
allowing custom searches to be performed. Entitled ‘TwitterSearch’, the software was located on a
NeCTaR cloud server and was accessed via a website interface. Tweets could be collected using
keywords, authors, or hashtags and could be searched at any time of day. Advanced retrospective
keyword searches from the Twitter interface were also executed in the early months of the pandemic.
The two search terms, ‘coronavirus’ and ‘COVID-19’ were employed to search Twitter. Other language
translations of the virus were not searched, because the returned tweets would be written in
languages other than English and beyond the scope of this article. Other search terms such as SARS-
CoV-2 (the name of the virus) were omitted because they were not as commonplace. As time has
passed, the search term ‘COVID’ has become more popular than all others, but this was not true in
early 2020. ‘COVID-19’ (the name of the syndrome that the virus causes) was more used in the
medical academic literature. The tweets once found were stripped of all meta-tags such as author,
hashtag and date and filed as weekly csv files for later analysis. All duplicate tweets were removed,
but quoted text was left intact. No re-tweets were collected. All that has been analysed is the text
content of the messages without any identification of authors, hashtags, locations, or specific dates.
Human ethics approval guidelines precluded this kind of identification in order to protect authors’
privacy and to assure the anonymity of all tweets. Non-identification of quotes from the corpus was
also part of the ethics protocol and was accomplished by slightly changing words from their originals
when cited in this article. This ensured that original tweets would not be able to be easily identified.
Each monthly file was uploaded to Voyant-tools.org website, six separate times representing each
month and yielding a corpus from April through to September 2020 in six separate webpages that
could be compared and contrasted. All the monthly files were then uploaded to a single Voyant-tools
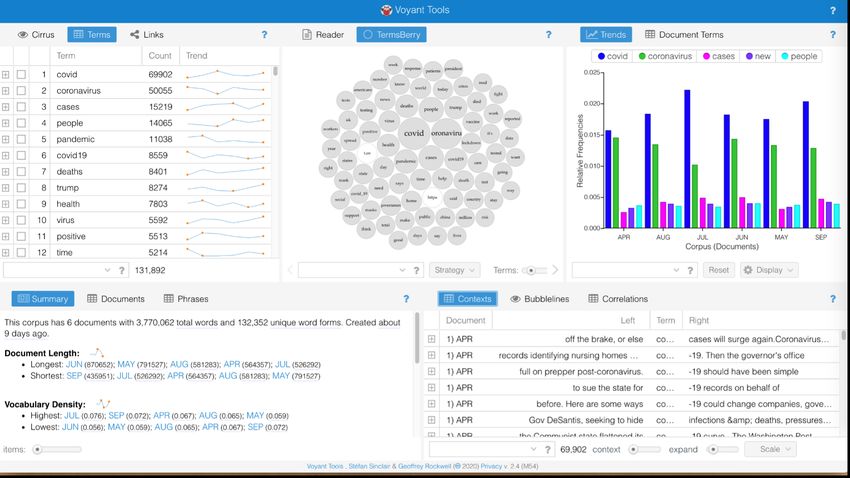
website yielding a single corpus for the entire six months (see Fig 1). Voyant-tools comprises several
tools that have been used to make sense of the corpus surrounding the pandemic. Such analytical
tools include concept clouds, summaries, readers, collocations, time series, correlations and other
text analysis processes. The results of these tools can then be utilised in order to understand the
corpi from the standpoint of Twitter’s authors and audiences. The most basic tool, ‘Terms’, ranked
frequencies of words and was used to determine the popularity of concepts. The tool, ‘Contexts’
allowed concepts to be exemplified within whole sentences.
The output of the entire Twitter corpus is shown in five default panels on the Voyant-tools website.
Each panel can be exchanged for different tools or enlarged in its own window for more extensive
analysis (see Figure 1). The URLs for each window are permanent ones and can be bookmarked for
future research.Figure 1: Screenshot of the entire Twitter corpus submitted to Voyant-tools.org
Results
There were 3,770,062 words in the six-month corpus and 103,566 tweets according to Voyant-tools
summary. Table 1 depicts the most popular ten concepts, excluding the search terms, that users used
in the six-month period. The five concepts, cases, people, pandemic, deaths and Trump were the
overall most commonly used concepts for the six months and were discussed in 50 percent of the
entire corpus of tweets for this period.
Rank Apr-Sep 2020
1 Corona/Covid-19, 119,957
2 cases, 15,219
3 people, 14,065
4 pandemic, 11,038
5 deaths, 8,401
6 Trump, 8,274
7 health, 7,803
8 world, 4,768
9 news, 4,72010 help, 4,662
11 lockdown, 4,300
Table 1: Most popular concepts and frequencies related to COVID-19 and coronavirus for period
Apr-Sep, 2020 on Twitter
The monthly summary of the six-month Twitter corpus can be viewed in Table 2 that shows how the
most popular five concepts, excluding ‘coronavirus’ and ‘COVID-19’ are remarkably consistent over
this time period. The table reveals the ranking and the actual number of instances that the concept
was used for each month. Monthly totals are somewhat approximate because collected tweets were
filed weekly beginning every Monday (EST) and thus some months were shorter than others in terms
of collected days. However, the most popular concepts did not appreciably change from month to
month, especially for the concepts in bold type – ‘cases’, ‘people’, ‘pandemic’, ‘deaths’ and ‘Trump’.
Rank Apr May Jun Jul Aug Sep
1 Corona/Covid, Corona/Covid, Corona/Covid, Corona/Covid Corona/Covid Corona/Covid,
18,516 26,099 30,359 19,111 20, 644 15,486
2 people, 2,062 people, 2,970 cases, 4324 cases, 2549 cases, 2429 cases, 2,055
3 pandemic, cases, 2,488 people, 3,456 people, 1812 people, 2061 people, 1,704
1,685
4 cases, 1,444 pandemic, pandemic, pandemic, pandemic, pandemic,
2,285 2,543 1522 1748 1,255
5 Trump, 1,215 deaths, 1,883 deaths, 1,897 deaths, 1063 deaths, 1417 deaths, 1,138
6 health, 1,196 Trump, 1,809 health, 1.889 Trump, 1058 Trump, 1361 Trump, 1,120
7 deaths, 1.003 health, 1,448 Trump, 1711 health, 1008 health, 1358 health, 904
8 help, 896 lockdown, day, 1268 positive, 989 positive, 1141 vaccine, 683
1,266
9 time, 867 virus, 1,194 positive, 1256 day, 792 vaccine, 941 positive, 648
10 home, 847 time, 1,143 time, 1164 vaccine, 724 day, 798 test, 626
11 world, 776 world, 1,87 world, 1162 mask, 691 time, 758 day, 609
Table 2: Most popular concepts and frequencies related to COVID-19 and coronavirus for Apr-Sep, 2020 on Twitter, by month
Note: Yellow-highlighted concepts of the ‘mask’ and ‘vaccines’ became more prominent at the end of the periodThe concept of positive ‘cases’ affecting ‘people’ was the barometer of the health problem that
confronted us all according to the media, government and health announcements, and have become a
regular concern for all citizens across the world. Coronavirus cases became the bête noir of the news
and Twitter reporting in the early months of the pandemic. The concept of ‘deaths’ was a function of
the number of cases since the more cases that a society had, then obviously the more deaths that
occurred. Here are some examples of how the concepts appear in context:
The number of new cases per day in the US appears to be peaking (April 2020)
If people are not serious about Covid-19, what can be done? (May 2020)
Really recent information can be really helpful during this pandemic. (July 2020)
The USA has less than 5% of the world’s population but over 22% of the deaths from
coronavirus (September 2020)
It is not immediately clear why these significant preoccupations do not appreciably change. A
possible explanation of this finding comes from propaganda research. Rebello, et al., (2020) found
predictable social media effects with Chinese, Iranian, Russian and Turkish state-controlled news
outlets that targeted French, Spanish and German Twitter and Facebook users. The state-backed
media outlets spread misinformation and propaganda, reaching tens of millions of users and could be
detected in subsequent social media posts as creating chaos, but also endowing the governments of
origin as victorious managers of the disease. Such propaganda seems to have been very successful
for these nefarious news outlets. In a similar fashion, risk communication from reliable health
agencies and mainstream media could have beneficently persuaded citizen audiences to tweet the
same preoccupations over the six-month period. Additionally, the Twitter corpus contains the regular
tweets of working journalists, news organisations, health agencies, and other media stakeholders
(Moon & Hadley, 2014), all of whom may have submitted the same set of concepts surrounding the
pandemic for six months.
The concept of ‘cases’
From the beginning of the pandemic, most of the world has been exposed to daily media briefings
about the number of new coronavirus cases and the number of deaths being recorded in their country,
state or province. This was a worldwide phenomenon, and in Australia, usually included those
countries that were experiencing high rates of infection as comparisons. From February 2020, in
Western countries with a free press, citizens were bombarded through a range of news outlets by
daily statistics that were seen to be growing worse over time.
The Twitter corpus reveals not only the dangers of coronavirus cases but also confusion and
misinformation about how these cases were tested, discovered, and recorded:
Why did the WHO say people could get re-infected? (May 2020)
More fakery with virus data: If the same person is tested three times and is eventually
positive, my state counts it as three separate cases. This is padding the numbers. (May
2020)
The CDCs stats show that in Ohio only 173 people have died from COVID-19. But our official
Ohio Department of Health numbers are 1,019. (May 2020)
Trials to develop a treatment state that cases where the infection was not confirmed by a
test, may now be counted. (May 2020)
The slogan of ‘flattening the curve’ became a mantra in Australia and many other countries. However,
the concept or the ‘curve’ or ‘flattening the curve’ is a negligible one in the Twitter landscape,
appearing as the 680th most popular term in the April corpus, when Australian media had been
constantly displaying line graphs and explaining the significance of the curve. Overall, only 326
(0.003%) instances of the 103,000 tweets, mentioned the word, ‘curve’. A possible reason for this
apparently trivial interest by Twitter in the midst of daily reports about the curve is that most users
merely understood the basic fact that a steep line graph is worse than a gradual line graph (seeDebecker and Modis, 2021). The following tweets (from April) show flattening the curve has been
simplified to equate with number of cases, and do not capture the steepness of the line graph over
time, signifying infection rates that will overwhelm health services if allowed to keep accelerating.
We are in this together and need to all do our part to flatten the curve
New Zealand has crushed the covid-19 curve with just one death
The curve inside prisons is not flattening – reported cases have tripled over the last seven
days.
New York has 778 new deaths, but overall we are flattening the curve, he says
A flattened curve is not a symmetrical curve and this means that deaths could continue for a
long time
Some people think that covid-19 and flattening the curve is over, but they should work in a
hospital for 10 hours
Additionally, there was a fundamental problem that is not highlighted by most Twitter users and
commentators alike – the number of cases found in any one day depended not only on how many
people have the disease, but on the rate of testing for that particular day (Richardson & Spiegelhalter,
2020; Omori, Mizumoto & Chowell, 2020). These two news tweets from May 2020 were not debated or
discussed by the Twitter community:
The Washington-based NPR media organisation broadcast that a state governor was
reluctant to open businesses unless testing rates were dramatically increased.
The UK Telegraph announced that Britain had been secretly flying 1000s of coronavirus tests
to America … as problems were reported in UK laboratories.
The Twitter corpus shows just 33 tweets that considered ‘testing rate/s’ from April to September.
Such testing rates varied considerably from day to day, country to country and time of the week (e.g.,
weekend testing is usually low). For example, if only a few tests were conducted on a single day, then
announcing zero positive cases is unreliable. USA testing rates lamentably varied from under 10,000
tests to over 260,000 tests per day from March 18 to May 7, yielding totally inaccurate rates of
infection (Schneider, 2020). During a pandemic, there is a strong positive correlation between number
of tests conducted and coronavirus cases found per day. A valid representation of cases would be to
divide the COVID-positive tests by the number of tests per day to produce a percentage. Using raw
figures to depict the infection curve often yields biased results (see Demirhan, 2020).
A negative explanation for these misunderstandings harkens back to previous critical research around
risk communication, when it was found that authorities overly used a range of statistical techniques to
portray the trajectory of risk in order to persuade the general public that drastic measures were
necessary (Zigmund-Fisher et al., 2007). Presenting a simple line graph that skyrockets upwards was
an elegant explanation for what was occurring around the world, thus obliging citizens to seriously
respond to health guidelines. Epidemics and pandemics certainly needed addressing, but saving lives
is not necessarily accomplished by flattening the curve – it only means that the same number of
infections should be experienced over a longer time period. Debecker and Modis (2021) address
poorly understood characteristics of flattening the pandemic curve from 25 countries most affected
by the pandemic in mid-May 2020. Their most startling finding was that the number of infections
increased as the curve was flattened in some countries.
Historically, the infection curve of COVID-19 that most health authorities stressed at the beginning of
the pandemic, was not a newly introduced concept. The curve of infections was also used to describe
the Spanish Flu epidemic of 1918-19, and has become a textbook standard method of charting the
ongoing spread of a disease’s effects upon human beings (Taubenberger & Morens, 2006). Infection
line graphs are a standard way to comprehend the aggressive spread of any disease over time,
however, graphs and tables can easily be distorted and used for a variety of reasons. In the case of
the COVID-19 curve, adding the number of daily tests to the depiction of the disease may have beencounterproductive to public health needs of ordinary people. The concept of the curve may simply
have been public health rhetoric to persuade citizens to follow ensuing safeguards such as social
distancing, washing of hands and wearing of masks.
Table 3 from health.gov.au in December 2020, shows the cases of the virus, with no mention of the
number of tests that were carried out to produce the cases. Tables like these were commonplace in
many countries whether the figures were daily, weekly or monthly.
Table 3: Covid-19 statistics
The concept of ‘deaths’
The concept of ‘deaths’ was a much discussed and distressing issue in the Twitter corpus for the
entire six months with the threat of dying also being reported by mainstream media from the very
beginning of the pandemic. Number of deaths from the virus was still being reported in Australia at
the end of 2020 as opposed to the notion of ‘flattening the curve’. The background context to this
concept mainly comprises the regular statistics of coronavirus deaths around the world and within
Australia. This daily occurrence may have led to increasing feelings of anxiety and apprehension for
many Australians. The Twitter corpus provides some evidence of the fearfulness experienced by
ordinary people, but the measurement of this anxiety is challenging to estimate in the corpus because
of broad number of synonyms used. Totalling the frequencies of most anxiety and fear-related words
generates the following table:
Apr-Sep 2020 Frequencies
fear 1406worried 356
anxiety 227
afraid 214
scared 232
panic 274
anxious 67
terrified 50
nervous 40
fearful 26
alarmed 26
depressed 29
TOTAL 2947
Table 4: Summated frequencies of fear and synonyms
Note: This total places fear and its synonyms as about the 50th overall ranked concept
The sample tweets below demonstrate the expressed fear of death surrounding the virus. The fear is
not only personal, but often refers to other people: family members, communities, and whole
countries.
I am actually terrified at how many people are going to die from this disease (June 2020)
There is this fear lingering in society, in people’s minds, in my parents minds (May 2020)
We are afraid of this contagious disease covid-19 (June 2020)
Warning, panic – mass uses of hand gels could create superbugs (August 2020)
Covid-19 is an example of how we Indians are ignoring the problem – I am scared of dying
(June 2020)
Canadians have all developed fear of COVID-19 (May 2020)
The situation in Australia was rather different to most of the world with fewer than 1000 deaths
caused by COVID-19. As a comparison, the number of people who died from the seasonal flu in 2017
was higher at 1255 deaths, and fatalities related to smoking every year is 15 times higher (see Cancer
Council, cancer.org.au). But few people are discussing ordinary influenza or banning cigarettes on
Twitterbecause of death rates.
In December 2020, the number of official deaths in Australia was 908, out of 27,923 official cases
producing a death rate of 3.25 percent. However, COVID-19 blood tests performed on a range of de-
identified, ordinary blood samples in Sydney show a remarkably higher number of missed positive
cases during the first lockdown period in Sydney (Gidding, et al., 2020). If we add estimates of these
undiagnosed cases, then the new estimated current death rate for Australia is closer to 0.92 percent
of all actual positive cases compared to the WHO’s estimate of 0.1 percent for seasonal influenza.
The main difference between COVID-19 and many other dangerous diseases was the intense and
unrelenting media coverage. The media sets the agenda in terms of what is important, and how to
think about this agenda (McQuail, 1987; Moccata & Hawley, 2020). If the coronavirus was constantly
being discussed in the media (including social media) then the public would also see the virus as
highly important (Wahl-Jorgensen, 2020). The state-wide lockdowns in Australia convincedAustralians that coronavirus is a serious threat to life and that it was spreading throughout the
community. After the lockdowns, Australians were allowed to leave the house, but we were reminded
of the threat of death because of the social distancing, masks and sign-in processes in shops,
institutions, pubs and restaurants. Constant reminders were broadcast on TV, radio, the internet, at
work, or out in the community. We were also needing to make regular safety decisions about our
family members, friends, and colleagues as possible recipients or contagious sources of potential
premature mortality.
The concept of ‘Trump’ and COVID-19
The Trump administration’s response to the pandemic was one of disinformation – denial and blame –
and much criticised by mainstream media (Wilson, 2020) and Twitter users themselves. Trump was
also an author on Twitter with a significant personal count of messages throughout the pandemic,
numbering 20 or more per week. Trump tended to reassure his audience, saying that everything was
under control and that the pandemic would pass under his stewardship.
Conversely, whenever Trump is mentioned within the corpus, the sentiment was almost always
negative. Very few Twitter users congratulated Trump for his handling of the pandemic. The tweets
about Trump were critical and scathing, blaming him for poor leadership. Here is a selection of
criticisms from the corpus:
He wants us to inject ourselves with bleach. No, I do not believe him. (April 2020)
Trump says he will not approve COVID-19 package without TAX Cut that offers ZERO relief
for 30M unemployed (May 2020)
I believe that Trump will now attempt to blame these protests for the spread of the virus
(June 2020)
Has Donald Trump apologized to the families of 130,000 people who died unnecessarily?
(July 2020)
So the president is never going to have a coronavirus response plan? (August 2020)
Trump should be tried by the UN for crimes against humanity. (September 2020)
There are exceptions to negative tweets about Trump in the corpus. Here is one tweet that suggests a
conspiracy theory to oust Trump as president:
Was calling the disease a pandemic, a fraudulent deep state fear mongering plot to remove
Trump? (September 2020)
Both the international and domestic media have reported most of the Trump administration’s
misguided decisions that have produced one of the world’s worst examples of risk communication
and led to the tragic number of deaths across America that is still continuing in 2021. Some US polls
had predicted that Trump’s use of Twitter as a platform of invective, fabrication, and half-truths, would
cost him the next election (Shepard, 2019). Baccini, Brodeur & Weymouth (2021) estimate that Trump
most probably would have won the 2020 election if the COVID-19 rate had been 5 percent lower. Even
with four years of significant polarising behaviour, regular confrontations, outright sexist and racist
conduct, scandals and impeachment ordeals, Trump still won more votes in 2020 (excluding Biden) –
over 74 million – than any other candidates in the history of American polling before the 2020
election. If the pandemic did not arrive in 2020, then the Trump administration may have been re-
elected (Parker, Dawsey, Viser & Scherer, 2020; Youde, 2021).
The concept of the ‘mask’
Although not appearing at the top of the monthly corpus tables, from the very beginning of the 2020
pandemic the wearing of masks has been a much debated and ambivalent precaution to avoid the
spread of infection in health announcements around the world (Cheng, Lam & Leung, 2020). In the
corpus, the word ‘mask’ ranks about 40th in terms of frequency overall, but was 11th in July. Thecontextual background to the wearing of masks was one of confusion and disbelief because of the
contradictory recommendations that were released around the world by various government and
health authorities.
During the Spanish Flu pandemic of 1918, the wearing of masks and physical distancing were the two
mainstays of public health responses. The guidelines mandated the wearing of masks and staying a
safe distance from other people – probably the only treatments that actually worked in 1918, but this
not what occurred in 2020. At the start of the pandemic in Australia, health announcements
recommend against the wearing of masks to decrease infection rates. On 16 March 2020 the
Australian Dept of Health stated ‘… masks are not currently recommended for use by healthy
members of the public for the prevention of infections like coronavirus.’ The same thing occurred with
early WHO recommendations, and also UK and US health announcements. Paradoxically, the wearing
of masks for some Australians was not only a part of their culture to protect themselves from traffic
fumes and industrial pollution, but also necessary during the early 2020 bushfire smoke crisis. The
mystery was that a mask might not protect against a disease, but can a mask increase the risk of
infection? The early warnings against the use of masks would have been logically baffling to many
people at the beginning of the pandemic.
These Twitter messages typify some of the confusion surrounding the wearing of masks:
We still don’t know if face masks in the community effectively work (April 2020)
Two black men said that they were kicked out of Walmart for wearing protective masks (April
2020)
Masks are ineffective because govt have made us so afraid of going out, masks are now
intended as a crutch to help us cope. We are being played (May 2020)
To all nurses: distancing rules and use of face masks should also apply when you are
amongst fellow nurses or other staff (May 2020)
In July, the Australian health agencies then officially changed their minds and did an about face
saying that face coverings are not only an acceptable precaution but mandated under certain risky
conditions (Vic Dept of Health & Human Services, July 19, 2020). Grocery stores then began to
recommend the wearing of masks for all its customers. In many parts of Australia, masks were
compulsory in order to attend a doctor’s surgery, a hospital or a nursing home. This sudden change in
policy remains questionable.
One possible reason for this change in public policy is a conspiracy theory that appears to have some
academic and media support (Feng, et al., 2020; Lopez, 2020; Wetsman, 2020). The early anti-mask
guidelines may have been a way of conserving existing personal protective equipment (PPE) that was
running critically low in most countries because China, the main supplier of this equipment, was also
experiencing drastic shortages. Western governments may have predicted that if the pandemic was to
escalate then creating a lack of PPE by recommending masks would result in panic buying and
shortages, similar to shortages of toilet paper in grocery stores. Without the masks, doctors and
nurses would be denied protection and inevitably fall sick with the virus, while the general public
hoarded vast amounts of PPE. Such equipment could also experience massive increases in price if
demand exceeded supply. Governments could find that they were unable to afford the price-gouged
masks, gowns and gloves for their frontline workers. The problem with this gambit is that, if true,
Western governments were possibly increasing the risk of infection for members of the general public,
in order to protect their healthcare workers. Many people probably began losing trust in their
government, the WHO and healthcare authorities at this point in time. The wearing of masks was
problematic for some Twitter users before the worldwide change of policy:
Large gatherings have destroyed the logic about wearing masks and social distancing. (June
2020)
Why are people still wearing masks? Are they the same people who trust in the WHO? (June
2020)
… protestors in Brisbane were nearly all wearing masks … the dismissal of masks as
protection against Covid-19 was appalling. (June 2020)According to the ABC, then US presidential contender, Joe Biden, made a point of wearing a mask from May 26, 2020 (see https://www.abc.net.au/news/2020-05-26/joe-biden-first-public-appearance- in-two-months/12285690). He then continuously delivered speeches with a mask covering his face, making his voice muffled and unclear. On Twitter, the word, ‘mask’ became a more significant concept in July probably due to Biden’s visually signalling that masks were useful to wear, and also because Donald Trump began to espouse the same ethic, albeit reluctantly. The medical community also realised that the virus could be spread through minute aerosols from just talking and breathing, so the mask went from protecting uninfected persons to preventing infected people from spreading the disease. Masks had a dual purpose and people did not need the more expensive N95 type masks – they could simply use surgical masks, or even home-made ones. However, it is unclear if the public fully understood the science that predicted that there might exist non-symptomatic carriers of the disease and that a mask should be worn to protect others (not the wearer) in public gatherings (Kolstoe, 2020). The concept of ‘vaccine’ At the beginning of the pandemic, this concept was grounded in the belief that only a vaccine would allow the coronavirus to stop spreading but that effective vaccines were not yet developed, not tested and not approved for use. This concept became an increasingly important idea in the last three months of Twitter corpus reflecting the mainstream media and Twitter user speculation of new vaccines from independent companies. The sentiment was mixed, with optimism, caution and apprehension apparent in the corpus: Prior to November 2020, the main hope for countries with soaring infection rates, and second waves had been the potential arrival of a trustworthy vaccine that would protect the population and signify an end to the devastation that COVID-19 had caused. This scenario was possibly the only hope for the USA which had 4 of the world’s population but an estimated 25 percent of the confirmed cases of coronavirus – the numbers could be much higher because testing kits have been a problem for American health agencies. The UK and various parts of Europe, and Asia have also been experiencing second and third wave lockdowns and stay-at-home orders, while some parts of the world – Vietnam, New Zealand, Australia, and Iceland – have come close to taming the disease. As can be seen from the cited tweets, the issues surrounding the vaccine are not only those espoused by anti-vaxxers, but also relate to timing and distribution, safety issues and the gradual recognition that a vaccine would not be a panacea for the disease. From the very beginning of the pandemic a COVID-19 vaccine was discussed by the media as being the only certain solution the oncoming pandemic. The WHO reported on dozens of possible vaccination start-ups as early as March 26, 2020, most which were in pre-clinical stages of development (see https://www.who.int/blueprint/priority-diseases/key-action/Novel_Coronavirus_Landscape_nCoV_ Mar26.PDF). Reports followed anticipating a possible vaccine in early 2021 and reminding us that such vaccines normally take an average of 10 years to develop (Le, et al., 2020). The existence of unknown side-effects due to such rapid development has become anxiety-producing for many people, especially those who are not infected (Robertson, et al., 2021). On December 8, 2020, the rollout of the Pfizer/BioNTech vaccine began in the UK, but sadly this was not the end of the virus and its effects, as many might have believed. Elderly, at-risk people living in nursing homes, the staff that care for them and frontline hospital workers were the first to obtain the new vaccine in the UK, from the 800,000 doses that were ready to be used. Apart from low temperature storage problems of the Pfizer vaccine, and distributing vast numbers of doses, the main problem is still how long will a vaccine’s protection actually last? The simple answer is no-one really knows. The same is true of the other recently announced vaccines as well. The scenario might be that the COVID-19 vaccines will not give 100 % protection and may not last more than six months, leading to the same situation as the flu vaccine that needs to be taken annually for people to be protected. It is also unlikely that all people will agree to take the vaccine meaning that the virus will be still be active in the community, just like seasonal colds and influenza that affect us every year (Tedros, 2020). While it may take a year to vaccinate the entire world, there are still questions to be answered about whether all children will need the to be treated, or even if all nursing home staff will need to have the vaccination. Side-effects of the new vaccines will also be a stumbling block to mass immunisation. In April 2021, vaccines are the number one debated Covid concept in the mainstream media and will probably remain so for the remainder of the year. Final thoughts
As previously stated, in 2016, Twitter was the first of the social media platforms to change its identity
from a social media app to a news app, perhaps as a strategic move to enhance its popularity. From
its early beginnings of sharing ideas, photos and videos, Twitter now has more news organisations
and journalists represented on its platform than any of the others. Twitter is by far the most news-
friendly and research-friendly of all the social platforms. Twitter is also predominantly a real-time
platform for breaking news about sports, politics, pandemics or any other item of interest, with word
limits that require short and snappy posts that perfectly suit the headlines and photographs of
traditional news stories (Neuberger, Hofe & Nuernbergk, 2014). Unlike Facebook and most other social
media apps, Twitter is often described as hybrid broadcast communication medium analogous to
mainstream media (Cha, Benevenuto, Haddadi & Gummadi, 2012). The fact that so many mainstream
journalists have adopted Twitter as their breaking news medium of choice only reinforces this view of
Twitter as a broadcast medium for certain topics.

Thus, by surveying the concepts on Twitter surrounding the coronavirus, this paper may have also
been simultaneously analysing the mainstream media contributions to the pandemic’s discussion. It
could be the case that Twitter’s COVID-19 concepts simply mirror those of the mainstream media in
many ways. As early as 2013, research found that Twitter covered most of events as found in
newswire providers and can be faster at delivering breaking news (Petrovic, et al., 2013). This would
suggest useful follow-up research to this paper.

Limitations of the study
A major limitation of this paper’s data collection methods was that only English language tweets were
collected and analysed. This was due to the fact that the author did not have the resources to
translate Chinese, Russian, Indian or other languages into English for standardised content analysis.
It could be the case that non-English language tweets could have resulted in differently ranked
concepts, which would have necessitated extended summative analysis. The global website, Our
World in Data (https://ourworldindata.org) has collected a myriad of ongoing statistics on most
countries since the pandemic began. The results show the huge range of effects of coronavirus on all
of the participating countries. Such a multiplicity of effects could easily have led to a range of
individual pre-occupations, if county of origin was identified in the corpus. Unfortunately, this was not
possible, and this paper’s findings need to be understood with this caveat in mind.

However, what is largely missing from the English language Twitter discussion is the fact that the
disease has had a mysterious origin and acted differently to any other disease that humanity has
faced before. These particular characteristics of the novel coronavirus are probably its most worrying
features, and the ones that have produced the most fear and anxiety around the world. This fear of
the unknown is rarely directly expressed by either the media reports or by the Twitter corpus. Fear of
unknown diseases however does evolve over time as research into the disease becomes more
sophisticated and the world relaxes into resigned acceptance. The ultimate acceptance of the
Spanish Flu over time will probably recur with COVID-19.

While the UK experienced second and third wave lockdowns, and Australia experienced infection
clusters since September 2020, a constant unknown has been the number of non-identified positive
cases in the community at any one point in time – so-called false negatives. This is perhaps the major
stumbling block for all Australians and their leaders. There is also confusion over the classification of
positive COVID-19 tests. The least problematic cases are those patients who acquired the infection
overseas from a known source; a slightly more problematic source are ‘locally acquired’ infections
from a known source. But the most problematic cases are labelled ‘community transmission’ where
the sources are completely unknown. Early studies from Wuhan estimated that the infection rate was
1.40 to 6.69, meaning that for every identified case there would be a median of 2.79 unidentified
cases in the community (Meehan, et al., 2020). This figure fluctuates according to country, and
researcher, but is not always reported by the media or Twitter. Nature Research (December 21, 2020)
reported that 90 percent of positive cases were missed in France during their early lockdown,
accounting for their subsequent waves after restrictions were eased. NSW figures may be comparable
because of unidentified cases with no symptoms (Scott, August 2020). The concept, ‘transmission’
however is ranked a low 450th concept in the Twitter corpus indicating lack of understanding about
the ramifications of the different acquisition scenarios.

Missed cases might never be identified – these infected people recover by themselves and may never
be the wiser. Such people do not need to be hospitalised but may infect a new cohort of patients.
This process could be occurring in so-called hot spots, where testing regimes tend to increase
markedly, thus revealing these otherwise missed cases. Health department frustration over unknown
contact tracing may simply be that these new cases are revealed by greater testing. The problem is
that the exact figure of missed cases is unable to be accurately detected, unlike the positive cases,
so we may never be able to eradicate the virus and Australia will continuously experience cycles of
localised outbreaks, sudden blame and anxiety, state government border closures, social restrictions
and area lockdowns, but ensuing community improvement to a precarious normalcy.

The devastation of the 1918 Spanish Flu arguably ended after about two years without a vaccine or
effective medical treatment (Martini, Gazzaniga, Bragazzi & Barberis, 2019). At that time, affected
people either died or developed immunity. This might be one endgame scenario for COVID-19.
Another is the optimistic prospect of global mass vaccination for 2021. As the USA Fox News
(December 11, 2020) network stated, ‘such is life’ – this might be the only thing we can expect for the
future.

References
Ahorsu, D.K., Lin, C., Imani, V., Saffari, M. & Griffiths, M.D. (2020). The Fear of COVID-19 Scale:
Development and Initial Validation. International Journal of Mental Health Addiction (2020).
https://doi.org/10.1007/s11469-020-00270-8.

Arpaci, I., Alshehabi, S., Al-Emran, M., Khasawneh, M., Mahariq, I., Abdeljawad, T., & Hassanien, A. E.
(2020). Analysis of Twitter data using evolutionary clustering during the COVID-19 pandemic.
Computers, Materials, & Continua, 65(1), 193-204. doi: http://dx.doi.org/10.32604/cmc.2020.011489.

Australian Govt Dept of Health (2020). COVID-19 Frequently asked questions.
https://www.health.gov.au/sites/default/files/documents/2020/03/coronavirus-covid-19-frequently-
asked-questions_3.pdf.

Baccini, L., Brodeur, A., & Weymouth, S. (2021). The COVID-19 pandemic and the 2020 US
presidential election. Journal of Population Economics, 34(2), 739-767.

Bentivegna, S., & Marchetti, R. (2018). Journalists at a crossroads: Are traditional norms and
practices challenged by Twitter? Journalism, 19(2), 270-290.

Bhat, M., Qadri, M., Beg, N. U., Kundroo, M., Ahanger, N., & Agarwal, B. (2020). Sentiment analysis of
social media response on the Covid-19 outbreak. Brain, Behavior, and Immunity, 87, 136–137.
https://doi.org/10.1016/j.bbi.2020.05.006.

Bivings Group (n.d.). The use of Twitter by America’s newspapers.
https://blog.thebrickfactory.com/pdf/twitter_study_final.pdf.

Bruns, A. (2020). ANALYSIS: News Sharing in Times of Corona. Available from
https://research.qut.edu.au/dmrc/2020/03/24/analysis-news-sharing-in-times-of-corona/.

Castaldi S, Maffeo M, Rivieccio BA, et al. (2020). Monitoring emergency calls and social networks for
COVID-19 surveillance. To learn for the future: The outbreak experience of the Lombardia region in
Italy. Acta Biomed. 91(9-S), 29-33. doi:10.23750/abm.v91i9-S.10038.

Cha, M., Benevenuto, F., Haddadi, H., & Gummadi, K. (2012). The world of connections and
information flow in twitter. IEEE Transactions on Systems, Man, and Cybernetics-Part A: Systems and
Humans, 42(4), 991-998.

Cheng, K. K., Lam, T. H., & Leung, C. C. (2020). Wearing face masks in the community during the
COVID-19 pandemic: altruism and solidarity. The Lancet,
https://www.thelancet.com/journals/lancet/article/PIIS0140-6736(20)30918-1/fulltext.

Davis, M., Stephenson, N., & Flowers, P. (2011). Compliant, complacent or panicked? Investigating
the problematisation of the Australian general public in pandemic influenza control. Social Science &
Medicine, 72(6), 912-918.

Debecker, A., & Modis, T. (2021). Poorly known aspects of flattening the curve of COVID-19.
Technological Forecasting and Social Change, 163,120432.
https://www.sciencedirect.com/science/article/pii/S0040162520312580.

Demirhan, H. (2020, April 16). More testing will give us a better picture of the coronavirus spread and
its slowdown. The Conversation, Available from https://theconversation.com/more-testing-will-give-
us-a-better-picture-of-the-coronavirus-spread-and-its-slowdown-135698
Doherty, B. (2020, April 2). The 90-day lockdown: NSW police can enforce home isolation until at least
the end of June, The Guardian. https://www.theguardian.com/australia-news/ 2020/apr/02/the-90-
day-lockdown-nsw-police-can-enforce-home-isolation-until-at-least- end-of-june

Eghtesadi, M., & Florea, A. (2020). Facebook, Instagram, Reddit and TikTok: A proposal for health
authorities to integrate popular social media platforms in contingency planning amid a global
pandemic outbreak. Canadian Journal of Public Health, 111(3), 389-391. doi:
http://dx.doi.org/10.17269/s41997-020-00343-0.

Fahmi, A., & Ramadhan, I. (2020). Analisis sentiment masyarakat selama bulan ramadhan dalam
menghadapi pandemi COVID-19. Journal Informatika dan Sistem Informasi (JIFoSI), 1(2), 608-617.

Fan, Y., Zhao, K., Shi, Z. L., & Zhou, P. (2019). Bat coronaviruses in China. Viruses, 11(3), 210.

Feng, S., Shen, C., Xia, N., Song, W., Fan, M., & Cowling, B. J. (2020). Rational use of face masks in
the COVID-19 pandemic. The Lancet Respiratory Medicine, 8(5), 434-436.

Fox News (2020, December 11). Such is life: In coronavirus wards, death is a foe but a fact. Available
from https://www.foxnews.com/health/in-coronavirus-wards-death-foe-but-fact.

Gao, J., Zheng, P., Jia, Y., Chen, H., Mao, Y., Chen, S., Wang, Y., Fu, H., & Dai, J. (2020). Mental
health problems and social media exposure during COVID-19 outbreak. PLoS One, 15(4).

Gidding, H.F. et al (2020). Seroprevalence of SARS-CoV-2-specific antibodies in Sydney, Australia
following the first epidemic wave in 2020 (preprint). Medical Journal of Australia, 11, November 2020.
https://www.mja.com.au/journal/2020/seroprevalence-sars-cov-2-specific-antibodies-sydney-
australia-following-first.

Griffin, A, (2016, April 29). Twitter changes itself from a social network into a news app. The
Independent. Available from https://www.independent.co.uk/life-style/gadgets-and-tech/news/twitter-
changes-itself-social-network-news-app-a7006696.html.

Hermida, A. (2010). Twittering the news: The emergence of ambient journalism. Journalism Practice,
4(3), 297-308.

Ho, C. S., Chee, C. Y., & Ho, R. C. (2020). Mental health strategies to combat the psychological
impact of COVID-19 beyond paranoia and panic. Annals of Academy of Medicine Singapore, 49(1), 1-
3.

Holland, K., & Blood, R. (2013). Public responses and reflexivity during the swine flu pandemic in
Australia. Journalism Studies, 14(4), 523-538.

Hsieh, H. & Shannon, S. (2005). Three approaches to qualitative content analysis. Qualitative Health
Research. 15. 1277-88. 10.1177/1049732305276687.

Khan, K.S., Mamun, M.A., Griffiths, M.D. & Ullah, I. (2020). The mental health impact of the COVID-19
pandemic across different cohorts. International Journal of Mental Health Addiction (2020).
https://doi.org/10.1007/s11469-020-00367-0.

Kaur, R., & Ranjan, S. (2020). Sentiment Analysis of 21 days COVID-19 Indian lockdown tweets.
International Journal of Advance Research in Science and Engineering, 9(7), 37-44.

Kim, K. H., Tandi, T. E., Choi, J. W., Moon, J. M., & Kim, M. S. (2017). Middle East respiratory
syndrome coronavirus (MERS-CoV) outbreak in South Korea, 2015: epidemiology, characteristics and
public health implications. Journal of Hospital Infection, 95(2), 207-213.

Knobler, S., Mahmoud, A., Lemon, S., Mack, A., Sivitz, L., & Oberholtzer, K. (Eds) (2004). Learning
from SARS: Preparing for the Next Disease Outbreak. Online documents downloaded from
https://www.ncbi.nlm.nih.gov/books/NBK92462/pdf/Bookshelf_NBK92462.pdf

Kolstoe, S. (2020, July 15). Does your face mask protect you or other people? The Conversation.
https://theconversation.com/does-your-face-mask-protect-you-or-other-people-142612.

Kouzy, R., Jaoude, J.A., Kraitem, A., El Alam, M.B. El; Karam, B.; Adib, E.; Zarka, J.; Traboulsi, C.;
Akl, E.W. & Baddour, K. (2020). Coronavirus goes viral: Quantifying the COVID-19 misinformation
epidemic on Twitter. Cureus, 12(3) e7255.
You can also read