Using a human-centred design approach to develop a comprehensive newborn monitoring chart for inpatient care in Kenya
←
→
Page content transcription
If your browser does not render page correctly, please read the page content below
Muinga et al. BMC Health Services Research            (2021) 21:1010
https://doi.org/10.1186/s12913-021-07030-x

 RESEARCH                                                                                                                                            Open Access

Using a human-centred design approach to
develop a comprehensive newborn
monitoring chart for inpatient care in
Kenya
Naomi Muinga1,2,3*, Chris Paton4,5, Edith Gicheha6, Sylvia Omoke2, Ibukun-Oluwa Omolade Abejirinde7,
Lenka Benova3, Mike English2,4 and Marjolein Zweekhorst1

  Abstract
  Introduction: Job aids such as observation charts are commonly used to record inpatient nursing observations. For
  sick newborns, it is important to provide critical information, intervene, and tailor treatment to improve health
  outcomes, as countries work towards reducing neonatal mortality. However, inpatient vital sign readings are often
  poorly documented and little attention has been paid to the process of chart design as a method of improving care
  quality. Poorly designed charts do not meet user needs leading to increased mental effort, duplication, suboptimal
  documentation and fragmentation. We provide a detailed account of a process of designing a monitoring chart.
  Methods: We used a Human-Centred Design (HCD) approach to co-design a newborn monitoring chart between
  March and May 2019 in three workshops attended by 16–21 participants each (nurses and doctors) drawn from 14
  hospitals in Kenya. We used personas, user story mapping during the workshops and observed chart completion to
  identify challenges with current charts and design requirements. Two new charts were piloted in four hospitals
  between June 2019 and February 2020 and revised in a cyclical manner.
  Results: Challenges were identified regarding the chart design and supply, and how staff used existing charts.
  Challenges to use included limited staffing, a knowledge deficit among junior staff, poor interprofessional
  communication, and lack of appropriate and working equipment. We identified a strong preference from participants
  for one chart to capture vital signs, assessment of the baby, and feed and fluid prescription and monitoring; data that
  were previously captured on several charts.
  Discussion: Adopting a Human-Centred Design approach, we designed a new comprehensive newborn monitoring
  chart that is unlike observation charts in the literature that only focus on vital signs. While the new chart does not
  address all needs, we believe that once implemented, it can help build a clearer picture of the care given to newborns.
  Conclusion: The chart was co-designed and piloted with the user and context in mind resulting in a unique
  monitoring chart that can be adopted in similar settings.
  Keywords: Human-centred design, Nursing care, Newborn, Inpatient, Documentation

* Correspondence: nmuinga@kemri-wellcome.org
1
 Athena Institute, VU University Amsterdam, Amsterdam, Netherlands
2
 KEMRI/Wellcome Trust Research Programme, Nairobi, Kenya
Full list of author information is available at the end of the article

                                         © The Author(s). 2021 Open Access This article is licensed under a Creative Commons Attribution 4.0 International License,
                                         which permits use, sharing, adaptation, distribution and reproduction in any medium or format, as long as you give
                                         appropriate credit to the original author(s) and the source, provide a link to the Creative Commons licence, and indicate if
                                         changes were made. The images or other third party material in this article are included in the article's Creative Commons
                                         licence, unless indicated otherwise in a credit line to the material. If material is not included in the article's Creative Commons
                                         licence and your intended use is not permitted by statutory regulation or exceeds the permitted use, you will need to obtain
                                         permission directly from the copyright holder. To view a copy of this licence, visit http://creativecommons.org/licenses/by/4.0/.
                                         The Creative Commons Public Domain Dedication waiver (http://creativecommons.org/publicdomain/zero/1.0/) applies to the
                                         data made available in this article, unless otherwise stated in a credit line to the data.
Muinga et al. BMC Health Services Research (2021) 21:1010 Page 2 of 14
Background duplication of efforts [17, 18], fragmentation [8, 19],
The global under 5 mortality rate has declined to 38 per non-use or suboptimal use and ‘improvisation’ of docu-
1000 live births in 2019 from 76 in 2000, with nearly half mentation, such as the use of ‘scraps’ (of paper) for
of these deaths in newborns [1]. Many countries are handover [20]. Nurses in general, and particularly those
working toward the Sustainable Development Goal in neonatal care units, spend a large proportion of their
(SDG) 3.2 target of reducing neonatal mortality to 12 time documenting care [21, 22]. Considering that health
per 1000 live births [2]. In sub-Saharan Africa, the new- facilities, especially in low- and middle-income coun-
born mortality rate remains high at 27 deaths per 1000 tries, are already short-staffed, the burden of document-
live births in 2019 [1]. Most of these deaths are caused ing might be eased by well-designed job aids or charts.
by preventable and treatable illnesses, such as preterm For observation charts to facilitate the provision of qual-
birth complications, birth asphyxia, pneumonia, congeni- ity care and highlight core clinical care activities, they
tal anomalies, diarrhoea, and malaria, emphasizing the should be designed to meet the needs of their different
need to strengthen health systems [3]. Furthermore, the users, whether to document providers’ actions or to gain
percentage of births occurring in health facilities, includ- information on what has (or has not) been done for the
ing hospitals, has been increasing rapidly with the move patient. Additionally, such charts should: i) consider pro-
toward Universal Health Coverage (UHC) [4]. Hospitals viders’ working context, ii) promote professional stan-
also now provide intensive neonatal care and need to be dards for quality care, and, iii) minimize the burden of
well equipped to provide care for small and sick new- documentation activities.
borns, whether born on-site or referred [5]. Research from both high- and low- and middle-
income settings has shown that vital signs are often
Inpatient newborn nursing care poorly documented in observation charts. Detection of
As part of efforts to reduce neonatal mortality, high deteriorating physiological signs in hospitalized patients
quality, round-the-clock care for newborns who can is suboptimal either because of poor chart design [23] or
spend many days in the neonatal unit is required [6–8]. poor understanding of why vital signs are measured and
While newborn care is often planned by a multidisciplin- documented [24, 25]. However, little attention has been
ary team, nurses are the primary caregivers. They have paid to the design of inpatient monitoring charts [26]
the greatest patient contact, placing them at the heart of and their contribution to the completeness of documen-
information generation and archiving, which is necessary tation and quality of care.
for continuity of care and team communication [9]. For
sick newborns, documenting vital sign observations, feed Documentation of nursing care in Kenya
and fluid prescription and monitoring, and weight gain In Kenya, nurse administrators reported that documentation
are particularly important to provide critical information of nursing care remains a challenge [17]. Specifically for new-
for communicating, intervening, tailoring treatment, and borns - a vulnerable group of patients - poor documentation
improving mortality and morbidity outcomes [8, 10]. of care also limits the use of routine data for quality improve-
ment [27], making it a priority area for improvement. Re-
Documentation of newborn care cently, the need was identified in hospitals in Kenya for
To facilitate documentation of nursing care, nursing ob- better tools to document newborn nursing observations that
servations may be recorded using job aids, which are would facilitate rapid, accurate, and informative communica-
tools to help structure, standardize, and facilitate work tion between nurses and other professionals as a key part of
processes. The function of job aids is to extend cognitive improving the quality of care [8].
capacity by removing extraneous details in the care
process, resulting in simplified procedures or tasks. They Objective
minimize the need for reliance on memory to document In this article, we describe the progress and outcomes of
details of nursing actions and plans [11]. Examples of a process aimed at improving the documentation of
job aids include rounding checklists used in intensive newborn care within a network of hospitals in Kenya, in-
care units [12], structured forms for recording patient volving nurses and other professionals and applying an
observations (such as the pediatric admission record, − adapted Human-Centred Design (HCD) approach to the
PAR) [13], patient safety checklists [14, 15], and forms design process. This article also fills a gap identified in a
guiding patient handover between staff shifts [16]. recent scoping review that found limited detailed litera-
ture on the application of HCD projects [28].
Design of charts for documenting nursing care
Poorly designed or inadequate job aids may have the op- Human-Centred design approach
posite effect, increasing mental effort and failing to meet Human-Centred Design (HCD), “is an approach that
the needs of the users, resulting in problems such as puts human needs, capabilities, and behaviour first, thenMuinga et al. BMC Health Services Research (2021) 21:1010 Page 3 of 14
designs to accommodate those needs, capabilities, and the process is described sequentially, it was cyclical: partic-
ways of behaving.” ([29] Pg 14).. The approach seeks to ipants reflected upon earlier suggestions and revised them
engage stakeholders, understand the context, explore so- with subsequent in-workshop chart tests and feedback
lutions, test them, and implement them in a cyclic from piloting and as contextual issues became clearer. Fig-
process. It is also founded on the premise that those ure 1 illustrates the design process with the activities and
who face a problem every day are likely to hold the key outputs in each phase. We did not develop the blue-sky
to its solution [30]. concepts in Bowen’s process as our time with participants
Historically, the Human-Centred approach, which en- was limited; it was not a problem because the aim was to
compasses various design approaches such as design develop a product that improves on existing charts.
thinking and user experience design, has been applied by Under the HCD approach, various design methods can
businesses to design products, restructure work environ- be applied to achieve the overall goal of placing the user
ments and build a better understanding of clients [31, at the core of the design. In our design workshops, we
32]. The approach has most commonly been used to adapted the scrum methodology based on Agile software
create interactive user interfaces in software develop- development principles, which are usually used to de-
ment, where usability is a critical factor of design [33]. velop software in iterative and incremental cycles to
More recently, this approach has been applied in the de- quickly produce a minimum viable product (MVP) that
sign of sustainable malaria interventions [32, 34] and so- can be tested (steps 3–6) [37]. Additionally, we used
cial innovations [28, 31]. Paper-based monitoring charts Lean User Experience (LeanUX) concepts, focusing on
are interfaces for health workers and may form tem- understanding the user, the context, and how the prod-
plates for electronic medical records, lending themselves uct is used through personas and user story mapping
to applying similar design approaches. (step 1) as well as designing with the user [38]. Participa-
tory design activities and the scrum methodology
The adapted human-Centred design allowed us to develop and test the product as we went
The Human-Centred Design applied in this research is along, rather than accept a final product early on. We
adapted from the design processes of Boyd et al. [35] (six- adapted these concepts to suit our setting, such as by
stage) and Bowen et al. [36] (five-stage). We used a 6-step pre-identifying personas likely to use the chart based on
process in two phases: design and piloting (Fig. 1). Phase previous experience in hospitals, before the short work-
one began by understanding the monitoring experience shops. We also used an adapted form of journey maps
and exploring ideas on how to address the challenges [39] or user story mapping [40] together with a guide to
identified. Next, we focused on practical proposals given understanding the monitoring task and its challenges.
the context and developed these ideas together with the
stakeholders, nurses, and doctors, resulting in version 1 Methods
charts. In phase two, we included the prototyping and Setting
changing phases of Boyd’s process; we piloted and adapted This study leverages an established Clinical Information
the charts based on feedback, leading to version 2. While Network for Newborns (CIN-N) comprising 20 county
Fig. 1 Chart design processMuinga et al. BMC Health Services Research (2021) 21:1010 Page 4 of 14
referral hospitals located in Nairobi, the Central, Eastern, piloting phase. These notes were used together with per-
and Western parts of Kenya. CIN-N is a partnership be- sonas, and journey maps to inform chart design at all
tween researchers, the Kenya Ministry of Health, and stages. Workshops and feedback sessions were all con-
paediatricians, providing a research database of patient- ducted in English.
level data from all neonatal admissions upon discharge
[41–43]. Collected data include clinical presentation, im- Phase one – understanding the user needs, goals and
mediate treatment, and discharge information and are context and tool design
intended to improve the use of information in policy Before the workshops, the study team obtained uncom-
and practice. This study complements the aims of the pleted and completed de-identified monitoring charts
CIN-N by developing observation charts for document- from a selection of newborn units within the CIN-N to
ing vital signs, tracking feed, and fluid prescription and identify existing charts used for monitoring, to under-
administration, contributing to better tracking and mon- stand how they were filled, and the challenges encoun-
itoring of inpatient neonatal care within and across hos- tered in using them.
pitals. The hospitals in the network do not have
neonatal intensive care units; their annual range of in- Understanding the user needs, goals, and context
patient volume was 322 to 3788 in 2019. The newborn
unit staff comprises 1–7 paediatricians or a neonatolo- Personas Personas are fictional characters based on re-
gist per hospital and 7–21 nurses (administrative and search or real-world experiences that represent user
clinical). Previous work has reported a median ratio of 1 types that might interact with a product [45]. Personas
nurse to 19 babies [44]. Other staff included student guide designers to articulate user demographics, needs,
nurses, medical officers (clinically qualified but no and behaviours; they include a sketch that personalizes
specialization), medical officer interns, clinical officers the description. In workshops 1 and 2, we used personas
(non-physician clinicians), clinical officer interns, and to understand user needs, experiences, behaviours, and
nutritionists. All hospitals received students from nearby goals. In groups, workshop participants identified docu-
training facilities. mentation challenges and described three pre-identified
We conducted three workshops with 16–21 partici- personas: a nurse providing round-the-clock monitoring
pants each between March and May 2019 in phase one care, a clinical officer, and a medical officer intern, who
(Table 1). The participants, senior nurses and paediatri- were staff most likely to admit babies [46] and therefore
cians drawn from 14 CIN-N hospitals, were purposely likely to write a feed and fluid prescription (Table 1).
selected as managers of neonatal wards who could de- Each group discussion was facilitated by a member of
cide what chart designs would suit their context. We the study team with experience working in newborn
also received feedback from other health professionals in units as a paediatrician or nurse, and another with ex-
the four piloting hospitals that were on duty on the day perience using HCD to design products. Facilitators
of the pilot visit. Detailed field notes and meeting sum- played a facilitator-participant role even though their
maries were maintained during the workshops and primary task was to help workshop participants
Table 1 Summary of workshops in phase one
Workshop Workshop tasks Participants(no) Dates and duration Outputs Number of CIN-
N hospitals
represented
Workshop 1 • Identifying challenges with Senior nurses March 2019 • Problem 13
Focus on nursing tasks: current monitoring charts (20) Duration: 3 h list
feed, fluid, and vital signs • Describing personas (nurse and Setting: part of a CIN-N meeting • 2 Personas
monitoring clinical officer) with related agenda • Design
• Exploring design solutions to a ideas
new chart
Workshop 2 • Describing personas (medical Paediatricians April 2019 • Problem 14
Focus on feed and fluid officer intern) (16) Duration: 3 h list
prescribing task • Describing feed/fluid Senior nurses (4) Setting: CIN-N dedicated ses- • 1 Persona
prescription task Medical Officer sion at Kenya Paediatrics Associ- • Design
(1) ation conference ideas
Workshop 3 • Describing the process of Senior Nurses May 2019 • Process 12
Focus on chart content monitoring feeds and fluids and (16) Duration: 1.5 days flow
identifying challenges Setting: dedicated chart design diagram
• Designing 1st prototype workshop • Monitoring
• Testing prototype using charts –
scenarios version 1Muinga et al. BMC Health Services Research (2021) 21:1010 Page 5 of 14
articulate their ideas; we believe this contributed to open were encouraged to think about them critically and
discussions during the workshop. agree on their use, bearing in mind possible (mis)-inter-
pretation. Each group then explained their design ideas
User story mapping In workshops 2 and 3, participants to the others in a plenary session to reach a consensus
described the monitoring process in scenarios (Table 2) on the fields captured and to identify any missing items.
using a guide developed by the study team to help them The study team members then developed two moni-
articulate how the personas would document care given toring charts: a) a standard monitoring chart for babies
to newborns by adapting user stories and journey maps. requiring 3–6 hourly checks and b) an intensive moni-
Working in three groups, workshop participants re- toring chart for babies requiring more frequent checks
corded what they required for the monitoring task and (not for use in the Neonatal Intensive Care Unit
documentation (e.g. charts, reference materials, equip- (NICU)), incorporating all workshop information. Fi-
ment), where they got it, where they recorded informa- nally, workshop participants used the three scenarios
tion, who it was aimed at, how it was used, and any (Table 2) and the prototype monitoring chart to fill in a
other challenges they encountered. Two tasks served as 48-h admission episode. This activity enabled them to
examples: a) feed and fluid prescriptions written by the identify where improvements were needed and to
clinical team, and b) monitoring tasks performed and visualize a completed chart.
documented by nurses. The categorisation of babies re- During the design sessions, participants were provided
flects the level of dependency of neonatal inpatients that with the personas and reminded to keep in mind the
was specified as part of efforts to standardise neonatal user they were designing for and their context. Con-
care and determine the frequency of nursing tasks (8). stantly referring to the personas and contextual realities
Three scenarios (Table 2) were designed to provide helped the participants to reflect on whether suggestions
participants with situations they might typically encoun- were feasible as the charts were revised (steps 3–5).
ter in the ward, including when the chart would be used
and by whom: i) Category A baby – sick and requiring Phase two -piloting and changing
close monitoring, ii) Category B baby – more stable, re- The two newly developed charts (standard monitoring
quiring 3–6 hourly monitoring, and iii) a senior nurse chart and intensive monitoring chart – version 1) were
who reviews the care provided to several babies. piloted in four CIN-N hospitals (Three county and one
tertiary hospital) between June 2019 and February 2020,
Designing together which volunteered to pilot the chart after workshop 3.
We explored design ideas in all workshops by asking Additionally, one nurse implemented version 1 of the
participants to visualize an ideal chart (steps 2–3). In chart in her ward even before the piloting sessions began
workshop 3, the participants (nurses) were provided with and reported that staff were happy to use it. The tertiary
sample monitoring charts from hospitals within the net- hospital had separately embarked on a project to update
work, private hospitals in Kenya, and newborn units out- their existing charts and saw this as an opportunity to
side Kenya (UK, Malawi, and India). Only nurses use a systematically developed chart. Using the version 1
participated as the design workshop was combined with chart as a starting point, we adapted the charts to the
a communication training to use nurses’ time efficiently. contextual realities of the pilot sites (e.g. a chart for the
In the three groups, participants focused on specific sec- Neonatal Intensive Care Unit (NICU) in the tertiary
tions of the chart: 1) biodata and vital signs monitoring hospital).
plus assessment, 2) feed monitoring, and 3) fluid moni- The four newborn units received 25 copies of each
toring. Facilitators helped participants identify and agree chart and nurses made additional copies to ensure all
on which items were important to capture, and on ap- babies had a new chart to replace the usual charts. The
propriate field types for each item, for example, where senior nurses who had attended the workshops first ex-
Yes/No fields could be implemented, or a limited num- plained to the staff how to use the charts, before distrib-
ber of choices and which choices. Where there were uting them. After 1–2 weeks of use, we conducted a
well-known and accepted abbreviations, participants total of eight site visits to pilot hospitals to receive
Table 2 Scenarios used in phase one
Scenario 1: Monitoring 1 Scenario 2: Monitoring 2 Scenario 3: Senior nurse review
(student/less experienced nurse) (student/less experienced nurse)
Category A baby weighing 1.3 kg who is on Category B baby weighing 1.7 kg who is on A senior nurse who will do a handover to an
intravenous fluids; the nurse is to check the nasogastric tube feeding; the nurse is to check expert colleague of a Category A baby
baby and chart the fluid intake/output/vitals etc. the baby and chart feeding/output/vitals etc. at including the progress in terms of input/output,
at 3 pm 3 pm vital signs monitoring, and other careMuinga et al. BMC Health Services Research (2021) 21:1010 Page 6 of 14
feedback. Each lasted 45–90 min, attended by staff who The challenges are generally related to chart design
had used the charts, including the senior nurse, student and supply, but also to how charts were used or handled,
nurses, and where available, clinical officers, medical of- limited staffing, a knowledge deficit particularly among
ficers, and the paediatrician on duty. We also collected junior staff, poor interprofessional communication
10–12 de-identified completed charts from each site to within teams/shifts, and lack of appropriate and working
observe them and we used the information gathered as equipment(for example a working pulse oximeter or cor-
discussion points with the staff. We followed up with rect size of the cannula). Some workshop participants re-
the sites through telephone calls to the nurses in charge ported that mothers were involved in feeding babies and
and data clerks to discuss any issues arising from using filling feed monitoring charts.
the new charts. The proposed changes were discussed Our observations of filled charts revealed various chal-
within the study team and implemented in the next ver- lenges: i) differences in combination and order of fields
sion of the charts (step 6), repeating in a cyclical manner across hospitals, ii) different ways of filling the same field
which resulted in one comprehensive chart- version 2 by individuals across forms and hospitals, iii) limited
(Fig. 1). We presented the chart design and piloting pro- space to write values, iii) inadequate fields on forms
gress to the wider CIN-N during two meetings (June leading to improvisation, and iv) multiple forms to fill
2019 and November 2019) and received feedback from the related information. Additionally, workshop partici-
other senior nurses, paediatricians, and health record in- pants through personas and user story mapping identi-
formation officers. fied challenges such as i) multiple forms for the same or
Lastly, at the request of the senior nurses and to sup- related information, ii) a mismatch between equipment
port less experienced health workers, we developed a calibration and charts, iii) difficult to fill graphs or plain
colour-coded information sheet, using input from seven charts, iv) poor inter-professional communication, v)
neonatal care experts and published references (47, 48) knowledge deficits among junior staff and vi) a mis-
in March 2020. This information sheet covers normal match between the order of fields and how tasks are ex-
and out-of-range values for vital signs (temperature, re- ecuted. The nurses reported that the order of items in
spiratory rate, pulse, oxygen saturation, and blood sugar) the charts did not follow the order of the tasks they im-
and identification of respiratory distress (see Additional plemented. For example, they may take vital sign mea-
file 1: Appendix 1). Hospitals were asked to use the in- surements before giving feeds or fluids while most
formation sheet as a guide and would need to define charts listed feed/fluids before vital signs. They also felt
which actions their health professionals should take if that for proper feed and fluid monitoring, prescription
out-of-range values are encountered. The experts also information should be on the same chart as monitoring
provided feedback which was incorporated into version information, while prescriptions were often in doctor’s
2 of the chart. notes or treatment sheets (workshop 1). Doctors echoed
the nurses’ suggestions to have everything on one chart
Results but worried it might be too detailed (workshop 2) and
Phase one – understanding user needs, goals and context said they would consider adopting such a chart if well
and tool design designed. Interestingly, one nurse claimed that their
Understanding challenges with old charts and the monitoring chart was perfect. Doctors mentioned that
monitoring process (personas and story mapping) the treatment chart was not adequately designed to
The study team examined filled sample charts from the document feed or fluid prescriptions but was optimized
hospitals and engaged workshop participants using for drug treatment. Tables 3 and 4 present these
methods from the HCD approach such as personas and challenges.
an adapted form of user story mapping, to understand The adapted user story mapping in workshops 2 and 3
challenges with monitoring and chart design. revealed that the monitoring process occurred in two
The primary persona developed was nurse Fiona, often stages. First, the feed and/or fluid prescription task in-
alone or with one or two other colleagues in the ward, volved calculating the prescription and writing it in the
caring for up to 50 babies. Clinical Officer John and doctor’s notes and/or treatment sheet. Second, the pa-
Medical Officer Intern Thomas were also identified as tient monitoring task based on the baby’s condition gen-
personas writing the feed and fluid prescriptions as well erally followed five steps: identification of the correct
as reviewing information documented by nurses on the patient, clinical assessment, administering feeds and/or
monitoring charts. Both personas undertook many tasks, fluids, writing findings and actions on the chart, and
such as patient care, attending meetings, writing reports, reviewing documentation.
and documenting care. Their common goal was to pro- From workshops 2 and 3, it emerged that the feed/
vide best-practice care to all babies admitted in the new- fluid prescription was written multiple times by the doc-
born units within the time available. tor (in the doctor’s notes as well as the treatment sheet)Muinga et al. BMC Health Services Research (2021) 21:1010 Page 7 of 14
Table 3 Challenges with the monitoring task and charts
Challenge Description and examples
Challenges relating to chart design
Multiple charts Participants reported that several charts exist in the wards that collect similar information leading to
duplication of information and possibly transcription errors.
Current charts that collect feed/fluid prescription and observation data include:
1. Fluid chart
2. Feed chart
3. Weight chart
4. Temperature chart – Respiratory rate, Oxygen saturation, pulse
5. Treatment sheet - feed/fluid prescription
6. Doctors notes – feed/fluid prescription
7. Nursing cardex – may have vitals as well as other notes
* In some hospitals, the feed chart also has vital signs
Different ways of filling the same fields Different ways of filling the same fields make it difficult to interpret what has been recorded and
compare between health workers or hospitals; for example, where one uses a plus sign to indicate
urine output, could it be interpreted to mean more urine was present? Or, where a tick is used, does
that imply the presence of urine in the baby’s diaper or that urine output was assessed?
Improvisation due to missing fields Inadequate fields on forms leading to improvisation; for example, users adding additional columns on
the chart or writing over space designated for other fields.
Difficult to fill charts Limited space to write values – small boxes for filling pulse on temperature charts
Current temperature graphs are difficult to fill
A mismatch between units on charts and Example: temperature scale in Fahrenheit while thermometers show the temperature in centigrade
available equipment
Different charts to write related Participants felt that for proper feed and fluid monitoring, prescription information should be on the
information same chart as monitoring information as opposed to having the prescription in the doctor’s notes or
the treatment sheet.
Charts do not support workflow The charts were not designed to support the order nurses follow while carrying out their tasks. For
example, they typically bundle tasks; take vital signs measurements before giving feeds or fluids while
some charts listed the feed/fluids before the vital signs.
General monitoring challenges
Interprofessional communication Poor interprofessional communication was reported as a challenge to monitoring by both nurses and
doctors as well as between junior and senior professionals within the cadres.
Knowledge deficit Both doctors and nurses felt that less experienced health workers such as interns lacked knowledge in
prescribing (particularly for low birth weight babies) and identification of problems (for example out of
range values) possibly due to their limited experience.
Staff shortage Nurses felt that staff shortage was a barrier to the proper documentation. Related to this, some
hospitals reported that mothers were involved in feeding babies and filling feed monitoring charts
Charts shortage The participants reported an inadequate supply of charts
Misplaced charts Nurses reported that in many cases, monitoring charts would either be placed at the bedside or at the
nursing station in a pile which sometimes led to charts being misplaced.
and then transcribed to the monitoring sheet by the clinicians and nurses (workshops 2 and 3) felt that less
nurse. The nurse translates the doctor’s prescription into experienced health workers such as interns lacked know-
an actionable plan. For example, the doctor writes a fluid ledge in prescribing and identifying problems (for ex-
prescription for 24 h, but the nurses need to calculate ample out of range values), likely due to limited
how much is required 6-hourly or 8-hourly based on experience. This was aggravated by the lack of proper
equipment available or work plan; some paediatricians communication between cadres and fear of reporting
likened this dilemma to a broken telephone where infor- problems, identified in all workshops.
mation gets distorted each time it is passed on to the
next person. The user story mapping in workshop 3 un- Designing together The nurses and paediatricians
covered the challenges encountered during monitoring. wanted one chart to capture vital signs, assessment of
Nurses noted that problems (for example out of range the baby and feed and fluid prescription and monitoring.
values) are recognized through the review of separate They suggested that the chart should have a biodata sec-
charts (Table 3), but the recommended action might be tion above and a notes section below. Nurses in work-
documented in the nursing notes; they considered this shop 3 also felt that all staff needed to take responsibility
time-consuming and overwhelming. Additionally, both or ownership of their care by signing the documentationMuinga et al. BMC Health Services Research (2021) 21:1010 Page 8 of 14
Table 4 Challenges with current vital signs, feeds and fluids after each bundle of tasks; apparently, nurses sometimes
monitoring forms used in newborn units within CIN-N organized care by splitting tasks, whereby vital signs and
assessment were done by one person, and feed and fluid
monitoring by another. The decision to have each nurse
sign for their bundle of tasks as opposed to one nurse
signing for all tasks and thereby assuming responsibility
was preceded by a discussion on adopting primary care
nursing as a model. In this model, a single nurse is iden-
tified as the point of contact during the entire patient
stay; that nurse accepts responsibility for all care pro-
vided [49]. However, this model is not widely imple-
mented in the hospitals represented, so the nurses
agreed that each nurse should sign for his/her tasks.
Both nurses and doctors suggested that the chart should
span several days, especially as printing and paper sup-
plies are limited. Lastly, to reduce the time spent on
writing, the chart should include fixed options. The
charts were designed to fit A4 size paper, landscape
orientation, and printed on both sides. Implementing
these new charts would imply that hospitals could re-
duce the number of pieces of paper where related infor-
mation is written from seven to one. For example, the
feed and fluid prescriptions were previously written in
the doctor’s notes, treatment sheet, and feed monitoring
chart, but can now be written in the prescription section
of the monitoring chart.
Monitoring charts version 1 The study team designed
two charts to cater to the needs of babies requiring vary-
ing monitoring frequency. The standard monitoring
chart could be used over 4 days while the intensive mon-
itoring chart covered 2 days with hourly slots. Table 5
highlights the differences between the two charts and a
sample of the charts is provided in the appendices [see
Additional file 2: Appendix 2.1 and 2.2].
Phase two -piloting and changing
From the workshop discussions and piloting sessions, we
sought to understand how charts are moved from one lo-
cation to another in the ward and potential loss, a chal-
lenge identified in workshop 3. In one pilot hospital,
monitoring charts were kept at the nursing station in a
pile before use, placed by the bedside while in use, and
then inserted into the patient’s file when filled. In another
county hospital, bound booklets with all charts required
for each patient in the newborn unit were provided. Add-
itional charts were attached to the back of the bound
booklets using white elastic adhesive tape Fig. 2.
Feedback on version 1 charts
Overall, the staff at the hospital (nurses, paediatricians,
medical officers, clinical officers, interns, and students
present on the day of the visit) who had used the chart
were happy that it covered all they needed to monitorMuinga et al. BMC Health Services Research (2021) 21:1010 Page 9 of 14
Table 5 Standard and intensive monitoring chart differences
Time Frequency of monitoring Duration of one sheet of
paper
Standard monitoring Timings fixed 3 hrly for 24 h period 3hrly monitoring to less frequent Spans 4 days
chart 9 am, 12Midday, 3 pm, 6 pm, 9 pm, 12Midnight, 3 am monitoring
and 6 am
Intensive monitoring Timings fixed hourly from 7 AM to 6 AM for 24 h Flexible to monitor babies hourly if Spans 2 days
chart period needed.
on one page. Medical officers and paediatricians espe- would transfer the prescription; this did not overcome
cially noted that they previously had challenges learning the earlier-identified challenge of duplication. Addition-
what happened to the baby and the volume of feeds ally, it emerged that printing two charts and ensuring
given, now the chart allowed them to see how the baby that each baby has the correct chart would be a logistical
was progressing without having to look through several challenge. The standard monitoring chart did not offer
documents in the patient’s file. The hospital staff gave flexibility in case a baby’s condition deteriorated or if the
feedback on chart layout and suggested design improve- baby’s review differed from the fixed schedule indicated.
ments such as re-ordering fields, adding missing fields, Therefore, we merged the two charts to develop a Com-
and increasing space for feed and fluid prescription. prehensive Newborn Monitoring Chart with no fixed
There were concerns about the flexibility of the standard timings at the top to allow flexibility. The version 2 chart
monitoring chart given the fixed timings at the top. For (see Additional file 3: Appendix 3) is a 2-day chart with
feed monitoring, a paediatrician suggested asking the prescription on the left-hand side and monitoring
mothers to document the feeds they gave on the same fields on the right that can be used over 48 h if printed
chart. Nurses were concerned about how the mothers in duplex. The monitoring section on the right now had
would perceive being asked to document feeds but were a larger space to write observations.
willing to support them if the request came from a se-
nior authority, for example, the paediatrician. They sug- Reflection on the design process We set out to design
gested that mothers could use a simple chart that could a monitoring chart that we anticipated would be used by
be inserted into the patient’s file. nurses to document the care they provide to babies ad-
During the piloting sessions, we obtained de-identified mitted in the newborn unit, as they have the most fre-
copies of filled charts and observed challenges with chart quent contact with the babies. We aimed to put the
handling and staffing. In one hospital, before the chart needs of the users first and therefore adopted the HCD
was filled up, it was stuck on the baby’s cot using white approach, to understand their needs and context, co-
elastic adhesive tape, then removed and filed into the design, and pilot the charts. It emerged that the nurses
baby’s file after holes were punched at the top. Import- preferred to have all information related to the monitor-
ant information at the top of the chart was lost when ing task on one page, leading to a comprehensive new-
taping the charts on and off or when holes were born monitoring chart to be used by nurses and doctors.
punched at the top. We observed that with subsequent The approach allowed the design team and stakeholders
photocopies of photocopied charts, information on the to focus on the user to develop a context-appropriate
margins was cut off. Regarding filling the charts, one chart and identify any problems early during the design
hospital managed to perform 6-hourly monitoring, citing and pilot phases. The workshop participants demon-
staff shortages, while another had charts that were filled strated enthusiasm and confidence, suggesting design
at 3-hourly intervals. During the piloting period, they features and supporting them with illustrations from
had nursing students but explained that otherwise, they their workplaces. During piloting, nurses were eager to
could not have achieved the same level of documenta- use the chart, as demonstrated by the volunteers who
tion (during that site visit, 40 babies were admitted, and opted to test the chart in their facility even before the
three qualified nurses were on duty for 24 h). design team selected a pilot site. They were also pro-
active in printing additional copies of charts and gather-
Monitoring chart version 2 During the pilot visits, ing their staff for feedback sessions even with their busy
nurses and paediatricians emphasized the need for a schedules.
proper feed and fluid prescription section and suggested During the workshops, the study team encouraged
that a larger prescription section be added. A senior participants to consider the practicality of their sugges-
nurse suggested reducing the number of days covered by tions, bearing in mind that they were likely to have the
the chart and instead incorporating the prescription. most contact with patients. The participants also had to
The version 1 chart had a small section where the nurse consider the amount of space available on the A4 sheet;Muinga et al. BMC Health Services Research (2021) 21:1010 Page 10 of 14
more items implied less space for other items or smaller design was highly appreciated by the physicians, as they
space for values. The study team and workshop partici- could ‘see’ the baby’s progress in one location without
pants converged on practical proposals even as aspir- having to search the patient’s file for important informa-
ational proposals were made (step 2–5) throughout the tion. They were concerned about the level of detail in a
design and piloting sessions. The most documented comprehensive chart. In contrast, observation charts
items were included, leaving space for more detailed as- found in the literature, used during the inpatient stay, do
sessments or examinations in the notes section or nurs- not typically combine various monitoring tasks but only
ing Cardex, for a comprehensive picture of patients’ focus on vital signs [23, 54–56]. This makes our chart
progress. This design would also support less experi- design unique.
enced staff to remember what must be documented for If the newly designed charts are adopted, they will re-
all babies. duce the number of places where related information is
Throughout the discussions, we aimed to build consen- recorded from as many as seven to one. Additionally,
sus among participants’ differing opinions by referring to when the chart is printed on both sides of an A4 sheet,
clinical guidelines, rather than what has been the norm at one can be used for one baby over 48 h (2-6hourly),
the hospitals, to avoid propagating poor practice. For ex- which helps to reduce the number of charts to be
ample, some hospitals were routinely doing gastric aspi- printed and reduces demand on limited resources. The
rates for all babies, while others were not; the version 1 study team had anticipated re-designing several charts
chart included a row to document if aspirates were done. (feeding chart, fluid chart, and observation chart for vital
However, upon review of evidence by a paediatrics train- signs) but workshop participants emphasized that they
ing team, it emerged that regular aspirates were not bene- would prefer if all related information was in one place.
ficial [50–53]. With this evidence, the nurse managers This chart design can be adapted by other hospitals in
agreed to remove that row from the chart. In a recent low- and middle-income settings but might not be ap-
follow-up meeting, the nurses agreed that best practice propriate for high-income settings with more resources
must be encouraged through the charts, in their hospitals. available to print colour charts [57] or use electronic sys-
In our case, it was important to design for context, but tems [58, 59].
also with clinical evidence in mind. Well-designed paper-based medical records that are
acceptable to staff may improve communication and fos-
Discussion ter teamwork, generating information, and sharing for
Charts used in documenting newborn nursing care have good monitoring and quality of care. They can prepare
received little attention, resulting in the widespread use the ground for future electronic medical records [60].
of poorly designed monitoring charts. To overcome this, Charts contribute to improved documentation efficiency
we adapted and used a HCD approach to uncover chal- thereby increasing time for key clinical activities.
lenges with existing charts and the monitoring process, Harmonization of forms can ease the orientation of new
co-design and pilot a new context-appropriate chart with staff across different facilities and may promote quality
staff from hospitals participating in a clinical information gains and reduce chances of errors [61]. Current charts
network. We found a variety of charts in use within and do not facilitate staff movement between hospitals, as
across hospitals and identified challenges related to chart changing hospitals often means learning to use different
content or design features, chart handling, and limited charts. Adopting structured monitoring charts within
resources. These design challenges may hamper hospi- the CIN-N facilitates the generation of clear information
tals’ efforts to provide high-quality care to admitted on how care is provided for newborns across the net-
newborns which is a critical element in reducing neo- work and provides opportunities to identify areas of
natal mortality. quality improvement backed by data, which is a CIN-N
The workshops revealed that health workers were re- goal. We hope to facilitate building a clearer picture of
quired to write related information in multiple locations, newborn care and the provision of best-practice care, by
transfer feed and fluid prescriptions up to three times, making nursing care ‘visible’.
and write information multiple times in different charts. The involvement of mothers in inpatient newborn care
Transferring information can introduce transcription er- has been highlighted in a recent study that explored the
rors which in turn may affect the care provided. Add- nature of task-sharing [62]. However, their involvement
itionally, duplication of efforts contributes to workflow in documentation, such as, recording feeds, remains
inefficiencies in an already resource-constrained envir- largely unexplored. Nurses recommended that the
onment. It was suggested that one monitoring chart mothers be given a simple chart to record their feeding;
should capture multiple monitoring activities (vital signs, a pilot hospital received this suggestion with caution. Pa-
feed, and fluid prescription, and monitoring) likely to be tient records are legal documents and the implications
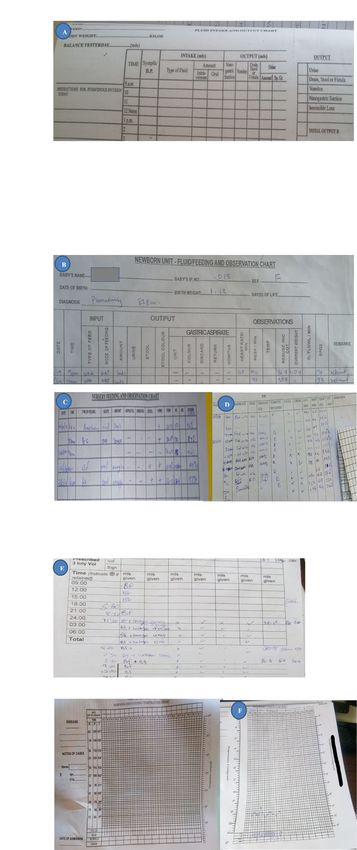
done for most babies, to be used over several days. This need clarification. Considering that task-sharing isMuinga et al. BMC Health Services Research (2021) 21:1010 Page 11 of 14 Fig. 2 General process flow of charts gaining ground as a possible solution to staff shortages, identification, the nurses reported that charts may be documentation of care by mothers could be explored to kept at the bedside during inpatient stays; piloting at understand the perceptions of both health workers and one hospital confirmed that. However, observations mothers. and discussions at pilot sites showed that white adhe- Designing a new chart does not overcome the sive was used to stick the chart to the baby’s cot, process issues, health worker shortages, lack of know- covering important information at the top and leading ledge, and skill deficiencies identified as challenges to to tears upon its removal. Identifying solutions to good monitoring. Process challenges such as how the such challenges may ease the process of implementing charts are handled in the ward and how supplies (ap- the new charts. propriate equipment and charts) are sourced and Limited evidence is emerging from high-income coun- maintained will require different solutions. They tries such as Australia that focus on designing observa- might involve an examination of how care is orga- tion and response charts [64, 65] that incorporate a nized and how this affects the care provided; ward human-factors approach. We believe that the personas managers could use this information to advocate for and user-stories embedded in the HCD approach we more resources and improve their processes. Know- adopted to develop paper-based charts was novel in our ledge or skill deficiencies can be addressed through setting. In designing the charts together with the users targeted continuous medical education as information and involving more stakeholders, we anticipate that the becomes available through filled charts and documen- process will contribute to building a sense of ownership tation audits. There is an opportunity to intervene and increasing the uptake of new structured charts to during the chart implementation period and to try to better document care. We will conduct a mixed- address issues arising as we conduct an evaluation methods evaluation to understand the uptake of charts guided by theory. One such theory is the at hospitals as well as the perceptions of health workers Normalization Process Theory, which provides a on the new charts. framework for thinking about implementation, sus- tainability, and evaluation of interventions using four Limitations main components (sense-making, engagement, collect- Nurses were only available together at one place for lim- ive action, and reflexive monitoring) to articulate how ited periods; given their already high workloads, it was interventions become assimilated into practice [63]. It impossible to hold longer workshops for extensive ex- can suggest where bottlenecks might occur, to address ploration and development of chart design. The limited the issues from the start rather than transferring time ensured a strong focus on obtaining a prototype existing routines. For example, during problem that could quickly be tested in hospitals.
Muinga et al. BMC Health Services Research          (2021) 21:1010                                                                              Page 12 of 14

Conclusions                                                                     Open Access, the author has applied a CC-BY public copyright license to any
We used a Human-Centred approach to design a unique in-                         author accepted manuscript version arising from this submission.

patient newborn monitoring chart for a network of hospitals.                    Availability of data and materials
The current monitoring charts had problems related to con-                      Data sharing is not applicable to this article as no datasets were generated
tent and a poor design hampering documentation of the care                      or analysed during the current study.
provided. Other problems were identified, related to process
                                                                                Declarations
- how care was organized in the newborn ward, lack of re-
sources (appropriate equipment, staff, and charts), knowledge                   Ethics approval and consent to participate
deficits among less experienced staff, and poor interprofes-                    At the beginning of each of the co-design workshops, study related informa-
                                                                                tion and activities were explained to all participants and verbal consent
sional communication. The newly designed chart is a com-                        gained to use meeting notes and workshop proceedings for the purposes of
prehensive monitoring chart covering feed and fluid                             describing the HCD process and outcomes. Ethical review and approval for
prescription, input, and output monitoring, and vital sign                      this approach to gaining verbal consent, without written individual informed
                                                                                consent, was granted by the Kenya Medical Research Institute (KEMRI) Scien-
monitoring, which is quite different from observation charts                    tific and Ethics Review Unit (Protocol no: KEMRI/SERU/CGMRC/161/3852) as
in the literature that focus only on vital signs. While the chart               the work reported was considered part of a quality improvement project. All
designed does not address all the issues raised, we believe                     methods were carried out in accordance with relevant guidelines and
                                                                                regulations.
that once implemented, it will facilitate building a clearer pic-
ture of the care given to newborns and in turn, facilitate the                  Consent for publication
provision of best-practice care by making the nursing care                      Not applicable.
provided ‘visible’. We will conduct a mixed-methods evalu-                      Competing interests
ation to assess the uptake of charts and documentation out-                     The authors declare that they have no competing interests.
comes build a comprehensive picture of the entire process
                                                                                Author details
and identify potential points for intervention.                                 1
                                                                                 Athena Institute, VU University Amsterdam, Amsterdam, Netherlands. 2KEMR
                                                                                I/Wellcome Trust Research Programme, Nairobi, Kenya. 3Sexual and
                                                                                Reproductive Health Group, Department of Public Health, Institute of
Supplementary Information                                                       Tropical Medicine, Antwerp, Belgium. 4Centre for Tropical medicine and
The online version contains supplementary material available at https://doi.
                                                                                Global Health, Nuffield Department of Medicine, University of Oxford, Oxford,
org/10.1186/s12913-021-07030-x.
                                                                                GB, England. 5Department of Information Science, University of Otago,
                                                                                Dunedin, New Zealand. 6Rice University, Houston, USA. 7Dalla Lana School of
 Additional file 1: Appendix 1.. Information sheet.                             Public Health, University of Toronto, Toronto, Canada.
 Additional file 2: Appendix 2.1. Neonatal standard monitoring charts
 version 1. Appendix 2.2 Neonatal intensive monitoring charts version 1.        Received: 1 March 2021 Accepted: 9 September 2021
 Additional file 3: Appendix 3. Comprehensive Newborn Monitoring
 Chart.
                                                                                References
                                                                                1. David Sharrow LH, Yang Liu, and Danzhen You on behalf of the United
Acknowledgements                                                                    Nations Inter-agency Group for Child Mortality Estimation (UN IGME). Levels
We would like to appreciate the nurses and paediatricians who took part in          and trends in child mortality 2020. UNICEF headquarters: United Nations
the workshops and the hospitals that volunteered to take part in the chart          Inter-agency Group for Child Mortality Estimation (UN IGME); 2020.
piloting. CIN-N team, Dr. Jalemba Aluvaala, Dr. Grace Irimu, Dr. Muthoni        2. United Nations. Goal 3: ensure healthy lives and promote well-being for all
Ogola, Dr. Jacquie Oliwa, and Dr. David Gathara for their support during the        at all ages: United Nations; 2015. Available from: https://www.un.org/susta
design and piloting process. We also appreciate the writing mentorship of-          inabledevelopment/health/. [cited 2020 04 June 2020].
fered by Dr. Pamela Wright. This work is published with the permission of       3. WHO. Children: reducing mortality: WHO; 2019 Available from: https://www.
the Director of KEMRI.                                                              who.int/en/news-room/fact-sheets/detail/children-reducing-mortality.
                                                                                4. Doctor HV, Radovich E, Benova L. Time trends in facility-based and private-
                                                                                    sector childbirth care: analysis of Demographic and Health Surveys from 25
Authors’ contributions                                                              sub-Saharan African countries from 2000 to 2016. J Glob Health. 2019;9(2):
ME, CP and NM designed and conducted the study. EG and SO participated              020406.
in the workshops and were instrumental in liaising with the health workers      5. Lawn JE, Kinney MV, Black RE, Pitt C, Cousens S, Kerber K, et al. Newborn
during the pilot. NM wrote the first draft of the manuscript and MZ, IOA, LB,       survival: a multi-country analysis of a decade of change. Health Policy Plan.
ME, CP, EG and SO contributed to writing and revising it. All authors               2012;27 Suppl 3:iii6–28.
approved the final version of the manuscript.                                   6. Barbosa VM. Teamwork in the neonatal intensive care unit. Phys Occup Ther
                                                                                    Pediatr. 2013;33(1):5–26. https://doi.org/10.3109/01942638.2012.729556.
Funding                                                                         7. World Health Organization. Survive and thrive: transforming care for every
This work was supported through the DELTAS Africa Initiative [DEL-15-003]-          small and sick newborn. Geneva: WHO; 2019.
an independent funding scheme of the African Academy of Sciences (AAS)’s        8. Murphy GAV, Omondi GB, Gathara D, Abuya N, Mwachiro J, Kuria R, et al.
Alliance for Accelerating Excellence in Science in Africa (AESA). DELTAS is         Expectations for nursing care in newborn units in Kenya: moving from
supported by the New Partnership for Africa’s Development Planning and              implicit to explicit standards. BMJ Glob Health. 2018;3(2):e000645. https://
Coordinating Agency (NEPAD Agency) with funding from the Wellcome                   doi.org/10.1136/bmjgh-2017-000645.
Trust [107769/Z/10/Z] and the UK government. It is also supported by a          9. Ricci SS. Essentials of maternity, newborn, & Women’s health nursing:
Wellcome Trust Senior Clinical Fellowship awarded to ME 207522/Z/17/Z.              Wolters Kluwer health | Lippincott Williams & Wilkins; 2013.
The views expressed in this publication are those of the author(s) and not      10. Moxon SG, Lawn JE, Dickson KE, Simen-Kapeu A, Gupta G, Deorari A, et al.
necessarily those of AAS, NEPAD Agency, Wellcome Trust or the UK                    Inpatient care of small and sick newborns: a multi-country analysis of health
government. This research was funded in whole or in part by the Wellcome            system bottlenecks and potential solutions. BMC Pregnancy Childbirth.
Trust (Grant numbers 107769/Z/10/Z, 207522/Z/17/Z). For the purpose of              2015;15(2):S7. https://doi.org/10.1186/1471-2393-15-S2-S7.
You can also read