Editor's Corner Steve Platnick EOS Senior Project Scientist - NASA's Earth Observing System
←
→
Page content transcription
If your browser does not render page correctly, please read the page content below
National Aeronautics and Space Administration

                                                                                                                                         the earth observer
The Earth Observer. July - August 2018. Volume 30, Issue 4.

      Editor’s Corner
      Steve Platnick
      EOS Senior Project Scientist

The year 2018 is shaping up to be another busy one for NASA’s Earth Science satellite missions. Already two
launches have taken place,1 and two more are scheduled by the end of the year—see diagram below, which
shows the plan for the NASA Earth Science fleet through 2023, and highlights the recent launches.

On June 29, 2018, NASA’s ECOsystem Spaceborne Thermal Radiometer Experiment on Space
Station (ECOSTRESS) instrument successfully launched aboard the SpaceX commercial resupply mission-15
(CRS-15) from Space Launch Complex 40 at Cape Canaveral Air Force Station in Florida. The Dragon space-
craft was successfully deployed and arrived at the International Space Station (ISS) on July 2. Once there,
ECOSTRESS was removed from the Dragon capsule via the station’s Canadarm robotic arm and installed on
the exterior of the station’s Japanese Experiment Module Exposed Facility (JEM-EF) late on July 5. Functional
testing of the instrument is now underway with science operations expected to begin in August.

In our last issue we reported on the successful launch of NASA’s Gravity Recovery and Climate Experiment
Follow-On (GRACE-FO) mission on May 22, 2018.2 By mid-June the twin GRACE-FO satellites had been
maneuvered into their operational orbit formation approximately 220 km (137 mi) apart. Engineers also
1
  NASA has actually launched three missions since January. The third was GOES-S, which NASA launched for NOAA. To
learn more about the GOES-S launch, see the Editorial of the March–April 2018 issue of The Earth Observer
[Volume 30, Issue 2, pp. 1-2—https://eospso.gsfc.nasa.gov/sites/default/files/eo_pdfs/Mar_Apr_2018_color%20508_0.pdf].
2
  The GRACE-FO launch was described in the Editorial of the May–June 2018 issue of The Earth Observer
[Volume 30, Issue 3, p. 1—https://eospso.gsfc.nasa.gov/sites/default/files/eo_pdfs/May-June%202018%20color%20508.pdf].
                                                                                                                   continued on page 2

                                                                                                  Deployed from
                                                                                                  ISS on July 13

The diagram shows current plans for the NASA Earth Science fleet through 2023, including missions in primary operations, extended
operations, implementation, and preformulation phases. It also points out the launches that have taken place since December 2017.
Image credit: NASA                                                                                                                         www.nasa.gov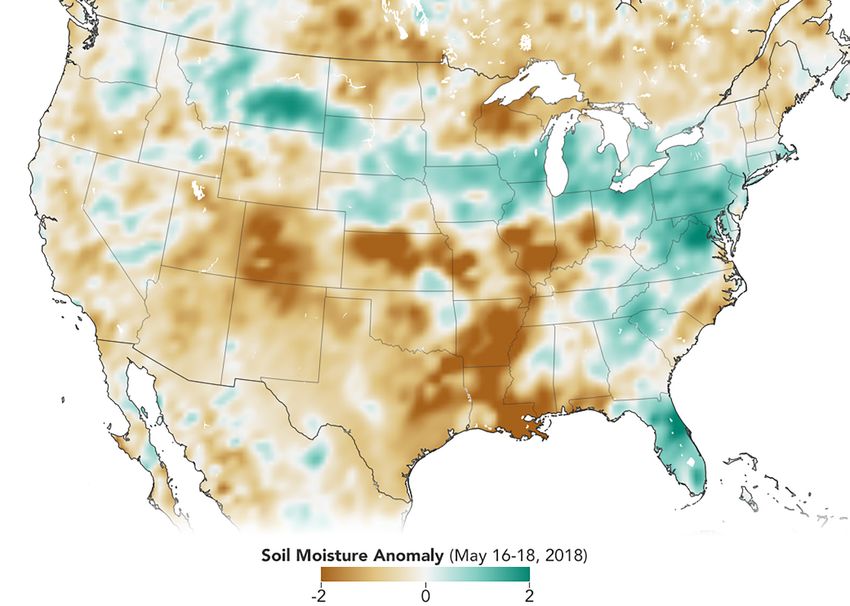
02            The Earth Observer                               July - August 2018                               Volume 30, Issue 4

editor's corner
                     In This Issue
                     Editor’s Corner                            Front Cover     In the News
                     Editorial Sidebar                                              3D View of Amazon Forest Captures Effects
                                                                                      of El Niño Drought                              19
                        “First Light” for GRACE-FO’s Microwave                      Ramp-Up in Antarctic Ice Loss Speeds Sea
                          and Laser Ranging Instruments                   24          Level Rise                                      20
                     Feature Article                                                NASA Soil Moisture Data Advances Global
                                                                                      Crop Forecast                                   22
                        NASA’s Worldview Places Nearly 20 Years
                         of Daily Global MODIS Imagery at Your                  Regular Features
                         Fingertips                                        4
                                                                                    NASA Earth Science in the News                    25
                     Meeting Summaries                                              Earth Science Meeting and
                                                                                      Workshop Calendar                               27
                        CERES Science Team Meeting Summary        9
                        Summary of the Spring 2018 NASA                         Reminder: To view newsletter images in color, visit
                          Land-Cover and Land-Use Change Science                  eospso.nasa.gov/earth-observer-archive.
                          Team Meeting                           14

                  activated both primary instruments: the accelerometers,       OCO-2 (2014); SMAP (2015); JPSS-1 (2017); and
                  which measure forces acting on the satellites other           finally, ICESat-2 (planned for 2018).
                  than gravity, e.g., atmospheric drag or solar radiation
                  pressure, and the Microwave Ranging Instruments,              The final launch planned for 2018 is the Global
                  which precisely measure the distance changes between          Ecosystems Dynamics Investigation (GEDI—acro-
                  the two satellites as they orbit Earth.                       nym pronounced “jedi,” as in Star Wars) mission. We
                                                                                reported in our last issue that GEDI has been placed
                  The “first light” images from both the MWI and the            on an accelerated track toward launch, which is now
                  experimental Laser Ranging Instrument (LRI) have              planned for November 2018, instead of May 2019.
                  been obtained—see “First Light” from GRACE-FO’s               As of this writing, the mission remains on track for
                  Microwave and Laser Ranging Instruments on page 24.           its scheduled launch from Cape Canaveral Air Force
                  The LRI is being flown as a technology demonstration,         Station in Florida via SpaceX CRS-16.
                  and initial comparisons of the data from the two types
                  of instruments show that they agree as expected. In the       In addition to the four missions that have been
                  months ahead, the GRACE-FO team will continue to              mentioned, NASA continues to experiment with new
                  fine-tune the MWI and LRI instruments, calibrate the          and innovative technologies launched on InVEST
                  satellites, and prepare for science data collection, which    CubeSats.3 On May 21, 2018, three Earth science experi-
                  is expected to begin toward the end of August.                ments were among those launched as part of the Cygnus
                                                                                OA-9 resupply payload onboard an Orbital Antares 230
                  Looking ahead, the Ice, Cloud and land Elevation              rocket. Cygnus OA-9 docked with the ISS on May 24.
                  Satellite-2 (ICESat-2) is now at Vandenberg Air Force         These three 6U CubeSats were deployed from the ISS on
                  Base in California in advance of the satellite’s launch,      July 13, and will be used to perform on-orbit technology
                  scheduled for September 12, 2018. ICESat-2 will use a         validation activities and test new measurement concepts.
                  laser altimeter to monitor changes in ice sheets, glaciers,   The Earth Science payloads are as follows:
                  and sea ice. In June, the satellite was trucked from a
                  Northrop Grumman facility in Arizona to Vandenberg.               • TEMPEST-D is a risk mitigation mission for a
                  Since then, ICESat-2 has gone through a final series of             planned constellation of Earth observation CubeSats
                  tests, including the final ground-based test of its lasers.         that will track the steps in the formation of clouds,
                  The next milestone toward launch comes in August,                   precipitation, and storms. Stephen Reising [Colorado
                  when the ICESat-2 team will transport the satellite to              State University] is the Principal Investigator (PI).
                  Vandenberg’s Space Launch Complex 2. At that point,                 To learn more, visit https://www.jpl.nasa.gov/cube-
                  United Launch Alliance personnel will attach ICESat-2               sat/missions/tempest-d.php.
                  to the Delta II rocket, which they have already begun
                  assembling. ICESat-2 will be the last satellite to launch     3
                                                                                  CubeSats are a type of nanosatellite that can be deployed
                  on a Delta II, which has been a durable “workhorse”           from standardized dispensers. They are built to standard
                  for the space industry for the past two decades, and          dimensions called units. One unit is equal to 10x10x10 cm
                  recently included several NASA Earth Science launches:        (~4x4x4 in). A 6U CubeSat can weigh up to 6.3 lbs (14 kg).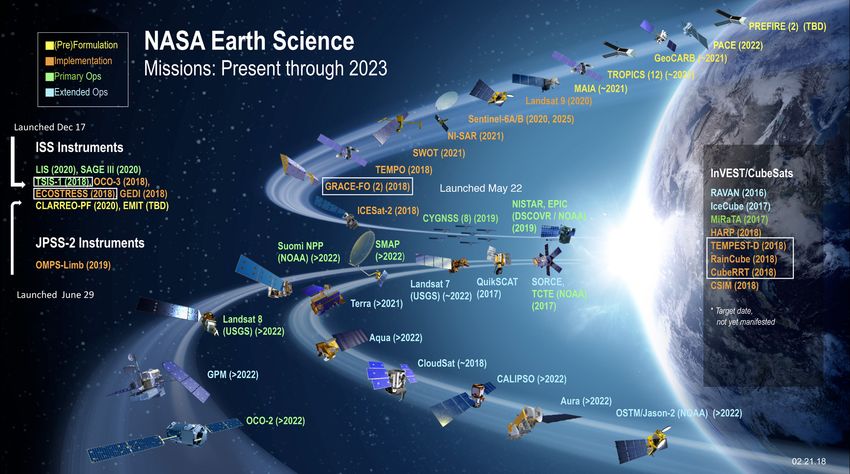
The Earth Observer July - August 2018 Volume 30, Issue 4 03
• CubeRRT will test a new signal processor to observations of the Earth’s ocean. This overlapping
editor's corner
mitigate radio interference impacting microwave time series has allowed scientists to observe and study
radiometer measurements of soil moisture, atmo- both short-lived events such as hurricanes and long-
spheric water vapor, sea surface temperature, term climate phenomena such as El Niño, La Niña,
and winds from orbit. Joel Johnson [Ohio State and the Pacific Decadal Oscillation. It also provides
University] is the PI. For more information, visit the ability to accurately monitor changes in global
https://u.osu.edu/cuberrt. mean sea level, one of the most important indicators of
human-caused climate change.
• RainCube will demonstrate the viability and
performance of a new expandable Ka-band precipi- In 2017, Jason-2 was placed in a slightly lower orbit,
tation radar that can be packaged into a volume to allowing it to collect data along very closely spaced
fit in a nanosatellite. Eva Peral [JPL] is the PI. For ground tracks, in order to provide very accurate and
more information, visit https://www.jpl.nasa.gov/ high-resolution observations of the mean sea surface.
cubesat/missions/raincube.php. This new orbit configuration will also allow geodetic
scientists to improve maps of the ocean floor, resolv-
Congratulations to the PIs and team members on ing previously unknown details of the location of
the successful launch of these CubeSats that have the seamounts and other features of the ocean bottom.
potential to expand measurement options for future
Earth Science missions. Future missions in this series include the Jason
Continuity of Service/Sentinel-6 (Jason-CS/Sentinel-6)
Our existing Earth Science missions continue to age mission, in collaboration with NOAA, the European
gracefully. In June, the joint NASA–French Space Space Agency, and EUMETSAT; and the Surface Water
Agency [Centre Nationale d’Études Spatiales (CNES)] and Ocean Topography (SWOT) mission in collabora-
Ocean Surface Topography Mission on the Jason-2 tion with CNES, the Canadian Space Agency, and U.K.
spacecraft (OSTM/Jason-2) completed its tenth year Space Agency partners.
measuring the surface height of the global ocean.
Launched on June 20, 2008, the Jason-2 satellite Finally, more than 100 science Hyperwall presenta-
continued the more than 25-year data record that began tions that were given at the NASA booth during the
with the Topex/Poseidon mission in 1992. Fall Meeting of the American Geophysical Union
(AGU) held in December 2017 are now available on
The Jason series continues to revolutionize our under- YouTube. The presentations cover the range of activities
standing of the dynamics of ocean circulation and that fall under the four divisions of NASA’s Science
global climate change. Building on the pioneering Mission Directorate—including Earth Science. For
work of Topex/Poseidon, data from Jason-1 (in orbit more information, see the Announcement on page 26
2001–2013), Jason-2 (launched in 2008), and Jason-3 of this issue.
(launched in 2016) have established an unprecedented
long-term record of consistent, continuous global
Undefined Acronyms Used in Editorial and Table of Content
COSPAR Committee on Space Research (International Council for Science)
CubeRRT CubeSat Radiometer Radio Frequency Interference Technology Validation mission
EUMETSAT European Organisation for the Exploitation of Meteorological Satellites
InVEST In-space Validation of Earth Science Technologies
JPL NASA/Jet Propulsion Laboratory
JPSS-1 Joint Polar-orbiting Satellite System-1
NOAA National Oceanic and Atmospheric Administration
OCO-2 Orbiting Carbon Observatory-2
RainCube Radar in a CubeSat
SMAP Soil Moisture Active/Passive
TEMPEST-D Temporal Experiment for Storms and Tropical Systems – Demonstration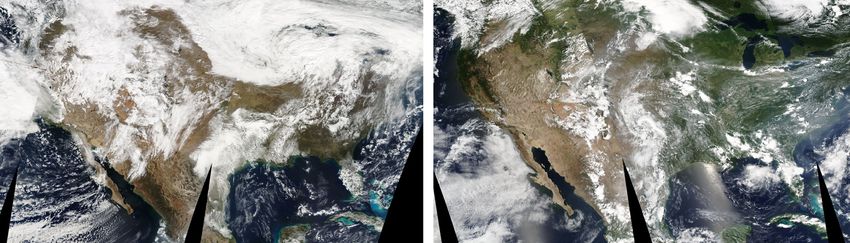
04            The Earth Observer                                     July - August 2018                                     Volume 30, Issue 4

                      NASA’s Worldview Places Nearly 20 Years of Daily
feature article
                      Global MODIS Imagery at Your Fingertips
                      Josh Blumenfeld, NASA’s Goddard Space Flight Center, joshua.c.blumenfeld@nasa.gov

                   EDITOR’S NOTE: This article was originally published on the Earthdata website—https://earthdata.nasa.gov/
                   modis-in-gibs. It has been modified for publication in The Earth Observer.

                  Argentina’s Mar                  Introduction
                  Chiquita lake is one of          Argentina’s Mar Chiquita lake is one of the largest saline lakes in the world. Along
                  the largest saline lakes         with an unusually high abundance of resident and migratory bird species in the lake's
                  in the world. Along              wetlands, another aspect that makes Mar Chiquita unique is that its water level is
                  with an unusually high           constantly changing. These extreme water level fluctuations affect not only its salin-
                  abundance of resident            ity, but also the amount of dust blowing off the lake as it periodically dries out—
                  and migratory bird               see Figure 1. For Santiago Gassó [NASA’s Goddard Space Flight Center (GSFC)/
                  species in the lake's            Morgan State University—Associate Research Scientist], the lake is a living laboratory
                  wetlands, another                for his studies into dust transport and is best viewed and studied from great height
                  aspect that makes Mar            and with years of observations—exactly the types of imagery provided by NASA’s fleet
                                                   of Earth-observing satellites.
                  Chiquita unique is
                  that its water level is          “I’m interested in dust coming out of South America,” explains Gassó. “For instance,
                  constantly changing.             Mar Chiquita shrank significantly in 2008, 2009, and 2010. [Using satellite imagery,]
                                                   I can go and check more than a decade of images and find what days were active, how
                                                   much dust [was produced], and compare activity to El Niño and La Niña years.”

                  Figure 1. This image shows
                  dust blowing off Mar Chiquita
                  on September 10, 2013, and
                  is created using data from the
                  Moderate Resolution Imaging
                  Spectroradiometer (MODIS)
                  on NASA’s Terra satellite. The
                  full-size image is available
                  at go.nasa.gov/2uGACrz for
                  interactive viewing using the
                  NASA's Worldview data visu-
                  alization application. Image
                  credit: NASA Worldview

                                                   A valuable resource for Gassó’s studies of Mar Chiquita is imagery from the Moderate
                                                   Resolution Imaging Spectroradiometer (MODIS) instrument aboard NASA’s Terra and
                                                   Aqua Earth-observing satellites. Terra was launched in late 1999 and was followed by Aqua in
                                                   2002. The two satellites have amassed a tremendous archive of imagery and data during their
                                                   more than 12,000 combined days in orbit—e.g., see Aqua/MODIS images in Figure 2.

                                                   GIBS and Worldview Provide Easy Access to Daily MODIS Global Imagery

                                                   MODIS is an extremely versatile instrument that has sometimes been called the
                                                   “workhorse” of NASA’s Earth Observing System. Its imagery is used to create a variety
                                                   of data products covering atmosphere, land, cryosphere, and ocean1 that are used for a
                                                   wide range of applications—see More About MODIS on page 6.

                                                   According to Gassó, “MODIS is the right balance of coverage, both spatially and in time.
                                                   It’s also the right combination of spectral bands. With the two sensors deployed—one on
                                                   1
                                                       See https://modis.gsfc.nasa.gov/data/dataprod/index.php for a complete list.
The Earth Observer                                       July - August 2018                                      Volume 30, Issue 4             05

                                                                                                                                            feature article
            March 21, 2003—https://go.nasa.gov/2OdGFtt                               March 24, 2010—https://go.nasa.gov/2Lla2fT

           March 17, 2012—https://go.nasa.gov/2Lm8ZfG                               March 20, 2018—https://go.nasa.gov/2OceNpN

Figure 2. These images, created using Aqua/MODIS data, show fluctuations in Mar Chiquita’s water level in 2003, 2010, 2012, and 2018, and
demonstrate how MODIS global imagery enables long-term studies of natural events or specific locations. Image credit: NASA Worldview

Aqua and the other on Terra—the whole planet is observed [almost daily] which
is a great benefit. The spatial resolution [generally 1 km (~3281 ft) but as high as
250 m (~820 ft) for Bands 1 and 2]2 is about right for detecting general features. If
you see a dust plume or a smoke plume [in a MODIS image], you can then see about
getting a higher resolution image from, say, Landsat to take a closer look.3 Worldview
[described below] makes this easy since you can overlay the Landsat orbital tracks on
the MODIS images.”

As of June 2018, all daily global MODIS imagery dating back to the operational
start of MODIS data collection in 2000 is available through NASA’s Global Imagery                           The nearly 20 years of
Browse Services (GIBS—https://earthdata.nasa.gov/about/science-system-description/                          MODIS imagery is
eosdis-components/global-imagery-browse-services-gibs). GIBS was established by NASA’s                      the longest continuous
Earth Observing System Data and Information System (EOSDIS) in 2011 and                                     daily global satellite
provides quick access to over 700 satellite imagery products covering every part of the                     observation record of
world. The nearly 20 years of MODIS imagery is the longest continuous daily global                          Earth ever compiled.
satellite observation record of Earth ever compiled.

MODIS imagery can be viewed rapidly and interactively using EOSDIS’s Worldview
visualization application (https://worldview.earthdata.nasa.gov). Worldview, which
was released in December 2011, pulls imagery from GIBS and allows users to over-
lay Earth-observing data products on top of a MODIS global base map from Terra or
2
  For some historical perspective on how this 250-m resolution that has proven so useful came
to be, refer to “How FIFE Changed MODIS” in the January–February 2017 issue of The
Earth Observer [Volume 29, Issue 1, p. 19—https://eospso.gsfc.nasa.gov/sites/default/files/eo_pdfs/
Jan-Feb%202017%20color%20508.pdf#page=19].
3
  Landsat images have 30-m (~98-ft) spatial resolution for most bands compared to the up to
250-m (~820-ft) spatial resolution of MODIS.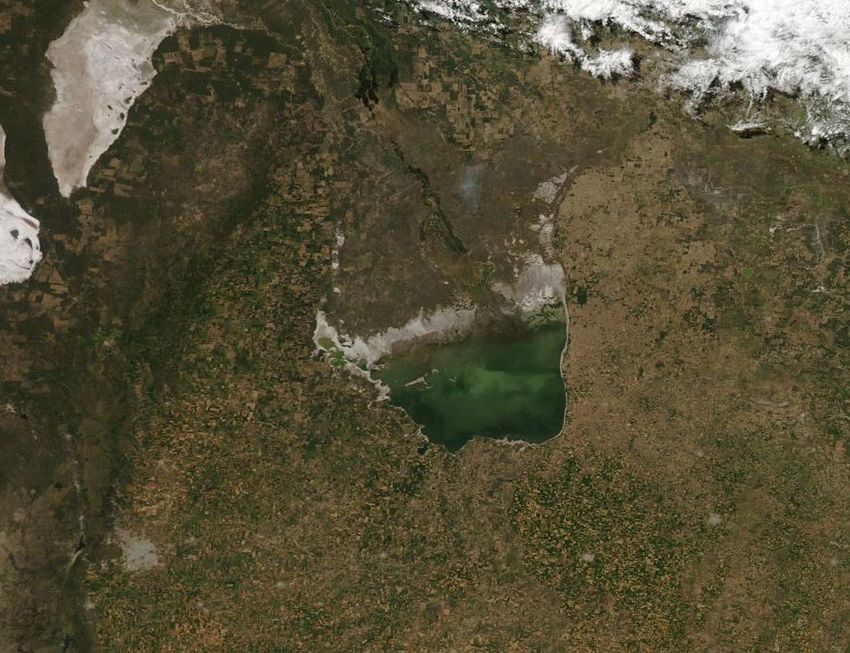
06            The Earth Observer                            July - August 2018                                  Volume 30, Issue 4

feature article
                    More About MODIS
                    Description: Medium-resolution, multispectral,
                    cross-track scanning radiometer
                    Spectral Bands: 36
                    Size: 1.0 x 1.2 x 1.6 m (~3.3 x 3.9 x 5.2 ft)
                    Mass: 229 kg (~505 lb)
                    Orbit: Sun-synchronous, near-polar
                    Orbital Height: 705 km (~438 mi)
                    Resolution: 1 km (~3821 ft) for most bands;
                    as high as 250 (~820 ft) for Bands 1 and 2.
                    Swath Width: 2330 x 10 km (~1448 x 6.2 mi)
                    Global Coverage: Every 1 to 2 days

                                              Aqua and easily create data animations. A daily global base map from data collected
                                              by the Visible Infrared Imaging Radiometer Suite [VIIRS] aboard the Suomi National
                                              Polar-orbiting Partnership [Suomi-NPP] satellite also is available dating back to
                                              November 24, 2015).4

                                              The availability of all global MODIS imagery in GIBS is the result of more than a
                                              half-decade of work involving several NASA teams. “This is the culmination of the
                                              work of hundreds of scientists and support staff keeping the satellites healthy to
                                              enable us to get these data from MODIS and create these images,” says Ryan Boller
                                              [GSFC—Worldview Project Manager]. “Having all the MODIS imagery available [in
                                              GIBS] has been a long-term goal of ours.”
                  “This is the                Near-real-time data and imagery from the Terra MODIS instrument have been avail-
                  culmination of the          able since 2001 through the EOSDIS Rapid Response system.5 The static Rapid
                  work of hundreds of         Response imagery originally was developed to meet the needs of the U.S. Forest
                  scientists and support      Service, the National Interagency Fire Center, and other federal and state users. By
                  staff keeping the           2007 the Rapid Response system had incorporated data and imagery from the Aqua/
                  satellites healthy to       MODIS instrument. As Boller notes, the advent of global mapping services like
                  enable us to get these      Google Maps created a desire for interactive imagery for any point on Earth. As a
                  data from MODIS             result, an effort to create daily global MODIS imagery was initiated in 2011 along
                  and create these            with the development of an application to allow users to easily interact with this imag-
                                              ery. “We transitioned from the static imagery of Rapid Response to interactive imag-
                  images. Having all
                                              ery provided through GIBS for viewing in Worldview,” he says.
                  the MODIS imagery
                  available [in GIBS]         The first daily global MODIS imagery base maps were available in GIBS for interac-
                  has been a long-term        tive viewing in Worldview in 2012, and daily MODIS base maps have been produced
                  goal of ours.”              ever since. This effort is a collaboration between the GIBS and Worldview teams and
                           —Ryan Boller       NASA’s MODIS Adaptive Processing System (MODAPS)—an operations group
                  [GSFC—Worldview             that was established prior to the launch of Terra for processing MODIS data. These
                                              processed data are sent for archiving and distribution to the EOSDIS Land Processes
                  Project Manager]
                                              Distributed Active Archive Center (LP DAAC), National Snow and Ice Data Center
                                              DAAC (NSIDC DAAC), Ocean Biology DAAC (OB.DAAC), and Level 1 and
                                              Atmosphere Archive and Distribution System DAAC (LAADS DAAC).6
                                              4
                                                To learn more about GIBS and Worldview, read “Seeing is Believing: EOSDIS Worldview
                                              Helps Lower Barriers for NASA Earth-Observing Data Discovery and Analysis” in the
                                              May-June 2015 issue of The Earth Observer [Volume 27, Issue 3, pp. 4-8—https://eospso.gsfc.
                                              nasa.gov/sites/default/files/eo_pdfs/May_Jun_2015_color_508.pdf#page=4]. The two tools are also
                                              discussed in the broader context of EOSDIS in “Earth Science Data Operations: Acquiring,
                                              Distributing, and Delivering NASA Data for the Benefit of Society” in the March–April 2017
                                              issue of The Earth Observer [Volume 29, Issue 2, pp. 4-18—https://eospso.gsfc.nasa.gov/sites/
                                              default/files/eo_pdfs/March%20April%202017%20color%20508.pdf#page=4].
                                              5
                                                Rapid Response is the precursor to Worldview. MODIS Subsets and Near Real-Time (Orbit
                                              Swath) Images are still available for long-term users and those with relatively slow internet
                                              access. However, Rapid Response will be replaced in the fall of 2018.
                                              6
                                                These DAACS are discussed in more detail in “Earth Science Data Operations: Acquiring,
                                              Distributing, and Delivering NASA Data for the Benefit of Society,” referenced in Footnote #4.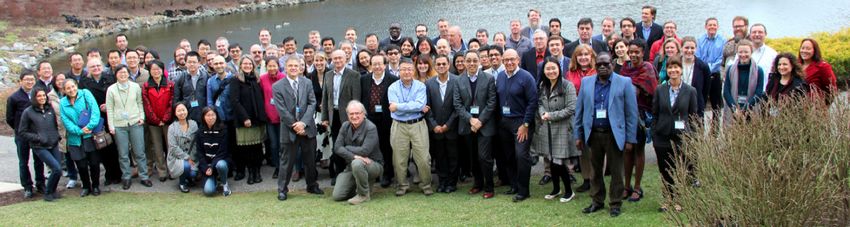
The Earth Observer                                     July - August 2018                                      Volume 30, Issue 4                07
While continuous MODIS global imagery has been available in GIBS from 2012

                                                                                                                                             feature article
to the present, until recently there was a gap in this imagery between the start of the
MODIS data record in 2000 and the start of the daily global MODIS base maps in                             “[Back] in the ‘80s and
2012. “Users said to us, ‘We know you have the source data available, and we’d like                        ‘90s, if you wanted to
to see it as imagery in Worldview,’” says Boller. The responsibility for processing the                    look at, say, clouds off
missing MODIS imagery for GIBS fell to MODAPS.
                                                                                                           the coast of California,
MODAPS Fills in the MODIS Imagery Gap                                                                      you would have to figure
                                                                                                           out the time of year
For the MODAPS team, filling in the MODIS imagery archive gap was a chal-                                  when it was best to look
lenge, especially given the volume of data involved and the processing resources avail-                    at these clouds, then
able. According to Kurt Hoffman [GSFC—MODAPS Lead Operations Analyst], the
                                                                                                           place a data request for
volume of MODIS data from Terra and Aqua required to produce GIBS imagery
for land alone was more than 3,850 terabytes (TB). (The data volume required for                           a specific window of
processing MODIS atmosphere imagery was much smaller: about 424 TB.) After                                 days when you thought
processing, MODAPS sent more than 565 TB of land imagery and about 14.41 TB                                the satellite overflew the
of atmosphere imagery to GIBS—see From Terra to Terabytes on page 8.                                       area. You would get a
                                                                                                           physical tape with these
“At first, we thought it would be about spring 2018 when we would get caught                               images and have to put
up in processing all the MODIS imagery,” Hoffman says. “We got lucky during
                                                                                                           this into the processing
this processing when an extra machine was freed up. We were able to use this extra
machine and double down on the processing. In fact, we were able to squeeze in a                           system. Only then would
third machine in the last month. Using these three machines enabled us to [process                         you know if the image
more data and] meet the pie-in-the-sky goal of finishing this processing in early                          was usable. This process
December [2017].”                                                                                          used to take from days
                                                                                                           to weeks. Now, you
Even after MODAPS finished processing the imagery, the data still had to be added                          can look at images for
to the GIBS collection. “Just ingesting the MODIS data took [the GIBS team] an
                                                                                                           days, weeks, and even
extra month, and then they had to do an analysis and assessment of the data,” says
Hoffman. “There are still a few small imagery gaps that we’re working on, but it’s just
                                                                                                           years in a matter of
one image here, one image there.”                                                                          minutes in Worldview,
                                                                                                           immediately find the
As Gassó notes, the ability to have an easily accessible historical perspective dating                     images you need, and
back almost two decades—e.g., see Figure 3—greatly facilitates research. “[Back] in                        download them for use.
the ‘80s and ‘90s, if you wanted to look at, say, clouds off the coast of California, you                  It’s fantastic!”
would have to figure out the time of year when it was best to look at these clouds,
                                                                                                                 —Santiago Gassó
then place a data request for a specific window of days when you thought the satellite
overflew the area,” he says. “You would get a physical tape with these images and have
                                                                                                           [GSFC/Morgan State
to put this into the processing system. Only then would you know if the image was                          University—Associate
usable. This process used to take from days to weeks. Now, you can look at images for                      Research Scientist]
days, weeks, and even years in a matter of minutes in Worldview, immediately find the
images you need, and download them for use. It’s fantastic!”

  Terra/MODIS, February 24, 2000—https://go.nasa.gov/2uKVIoM               Aqua/MODIS, July 4, 2002—https://go.nasa.gov/2GNZuTg

Figure 3. Shown here are the first images of the continental U.S. obtained by Terra/MODIS on February 24, 2000 [left] and by Aqua/MODIS on
July 4, 2002 [right]. Image credit: NASA Worldview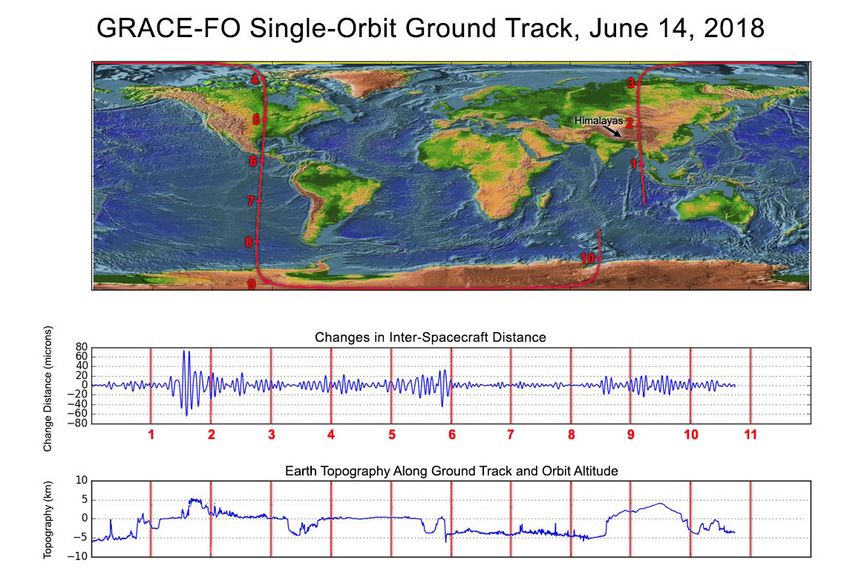
08 The Earth Observer July - August 2018 Volume 30, Issue 4
feature article
From Terra to Terabytes
A byte is the amount of storage space required for a single character of type. Moving upward in size is the kilo-
byte (KB), megabyte (MB), gigabyte (GB), and terabyte (TB). According to the My NASA Data website (https://
mynasadata.larc.nasa.gov/science-practices/data-volume-and-units) 1 TB is equivalent to about 1000 digital copies
of Beethoven’s Fifth Symphony or all the x-rays in a large hospital. NASA’s Hubble Space Telescope generates
about 10 TB of new data per year, and the total Hubble archive is currently over 150 TB in size.*
*
Hubble statisitcs cited in this sentence come from NASA’s About the Hubble Space Telescope page at https://www.nasa.gov/
mission_pages/hubble/story/index.html.
Summary
For the MODAPS, GIBS, and Worldview teams, the completion of this effort gives
MODIS users access to a tremendous resource that enables studies into our changing
planet reaching back almost 20 years, including the effects of urbanization, historic
storms and natural events, and, of course, ongoing changes to Mar Chiquita—see
Figure 4. “This is really an impressive chunk of data considering the wide range of
research scientists can use these data for,” says Hoffman.
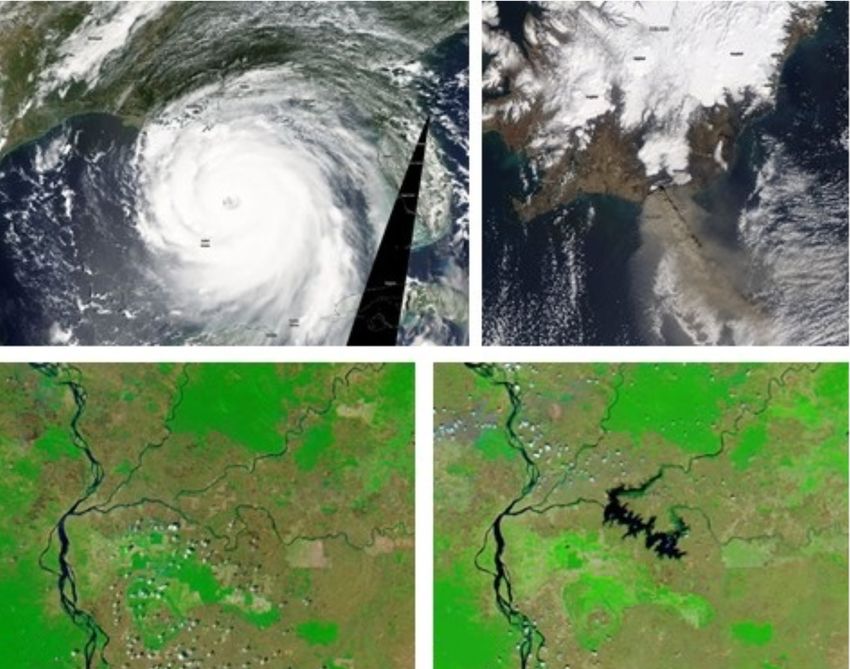
Figure 4. Now that all the
archived MODIS global imag-
ery from Terra and Aqua are
available in GIBS, users can
use Worldview to explore
historical events like Hurricane
Katrina [upper left], the erup-
tion of Iceland’s Eyjafjallajökull
Volcano [upper right], and Hurricane Katrina, Terra/MODIS, Iceland’s Eyjafjallajökull Volcano,
August 28, 2005—https://go.nasa.gov/2uxtaPE Aqua/MODIS, April 17, 2010—https://go.nasa.gov/2GinbUa
study the effects of human-
caused change, such as the
impact of the Lower Sesan 2
Dam in Cambodia [lower
image pair]. Image credit:
NASA Worldview
Lower Sesan 2 Dam in Cambodia, Lower Sesan 2 Dam in Cambodia,
Aqua/MODIS, 2014—https://go.nasa.gov/2GoyWIE Aqua/MODIS, 2018—https://go.nasa.gov/2GliR6L
Boller agrees and acknowledges that finally having all daily global MODIS imagery in
GIBS is the fulfillment of a long-standing desire—the MODIS past finally reaching
the present. “It has been rewarding to see how excited our users are when we release
new imagery or extend the imagery timeline back another few years,” he says. “Now,
to be able to go from the very start, the very first image, to the present and move
forward provides a sense of completeness and the potential for new discoveries.”
See for yourself and use Worldview to interactively explore almost 20 years of change
as observed by MODIS. 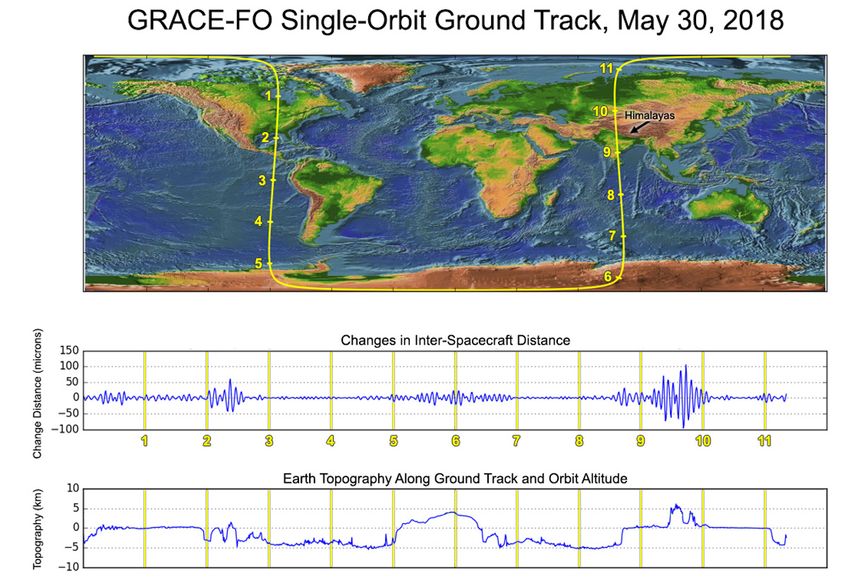
The Earth Observer                                           July - August 2018                                           Volume 30, Issue 4                   09

     CERES Science Team Meeting Summary

                                                                                                                                                          meeting summaries
     Walter Miller, NASA’s Langley Research Center/Science Systems and Applications, Inc., walter.f.miller@nasa.gov

Overview                                                                      (JPSS-1) Satellite3 launched on November 18, 2017,
                                                                              carrying CERES Flight Model 6 (FM-6) into orbit.
The twenty-ninth Clouds and the Earth’s Radiant                               He also reported that the CERES Ocean Validation
Energy System (CERES) Science Team Meeting was                                Experiment (COVE—https://cove.larc.nasa.gov) instru-
held May 15-17, 2018, at NASA’s Langley Research                              ments will be placed on Granite Island, MI (located in
Center (LaRC) in Hampton, VA. Norman Loeb                                     Lake Superior), in June 2018. These instruments will
[LaRC—CERES Principal Investigator] hosted and                                be collocated with eddy covariance measurements of
conducted the meeting. The major objectives of the                            the Great Lakes Evaporation Network (GLEN). Loeb
meeting were to:                                                              also included some CERES observations that show the
                                                                              impact of the most recent El Niño on the zonal radiation
    • review the performance of CERES instruments;1
                                                                              budget; he showed how the measurements from 2014
    • discuss data product validation;                                        through 2017 compare to those obtained between 2000
                                                                              and 2014. The shortwave (SW) flux is lower due to fewer
    • discuss the imminent reprocessing from March                            clouds in the tropical Pacific; the longwave (LW) flux is
      2016 with Collection 6.1 data from the Moderate                         higher due to increased sea surface temperature (SST)
      Resolution Imaging Spectroradiometer (MODIS);2                          and fewer clouds; and the net flux is also higher—see
      and                                                                     Figure 1.

    • discuss the path forward for the next edition of                        David Considine [NASA Headquarters (HQ)] spoke
      CERES products.                                                         about Earth Venture-Continuity (EV-C) missions, a new
                                                                              mission category identified in the 2017 Earth Science
All the presentations from the meeting are available                          Decadal Survey.4 The idea is to use these EV-C concepts
online at https://ceres.larc.nasa.gov/science-team-meet-                      to continue building upon the Program of Record, which
ings2.php?date=2018-05. Selected highlights from the                          refers to the Earth science missions already in orbit or in
presentations given at the meeting are summarized in                          development—but to do it more efficiently.
this article.
                                                                              3
                                                                                The Joint Polar Satellite System (JPSS) is our nation’s next-
Programmatic and Technical Presentations                                      generation polar-orbiting operational environmental satellite
                                                                              system. JPSS is a collaborative program between the National
On the first day of the meeting, Working Group Chairs                         Oceanic and Atmospheric Administration (NOAA) and
gave a series of programmatic and technical presentations.                    NASA. JPSS-1 has been renamed NOAA-20.
                                                                              4
                                                                                In recognition of the fact that Earth science observation in
Norman Loeb presented the State of CERES, in which                            space involves a constant tension between exploring new scien-
                                                                              tific terrain and continuing existing observations—which some-
he reported that the first Joint Polar Satellite System                       times need to last for decades to provide useful information
                                                                              about climate change—the 2017 Earth Science Decadal Survey
1
  There are currently six CERES instruments active on                         identified a category called Earth Venture Continuity, that would
four satellites: two on Terra [FM-1 and -2]; two on Aqua                      allow scientists to propose ways of continuing existing observa-
[FM-3 and -4]; one on the Suomi National Polar-orbiting                       tions (Program of Record) at lower cost. The full 2017 Earth
Partnership (NPP) [FM-5]; and one on NOAA-20 [FM-6].                          Science Decadal Survey report can be downloaded from http://
2
  MODIS flies on NASA’s Terra and Aqua platforms.                             sites.nationalacademies.org/DEPS/esas2017/index.htm.

                      SW (-0.83 ± 0.41 W/m2)                         LW (0.47 ± 0.33 W/m2)                        NET (0.39 ± 0.43 W/m2)

                                                                        Difference (W/m2)
Figure 1. The zonal mean differences between the mean top of atmosphere (TOA) fluxes from July 2014 through June 2017 (i.e., the time period of
the most recent El Niño) and the earlier period of July 2000 through June 2014 from Energy Balanced and Filled (EBAF) TOA Edition 4.0 product.
The outgoing reflected shortwave (SW) flux difference [left] is negative due to fewer clouds in the tropical Pacific, the outgoing emitted longwave
(LW) flux difference [center] is positive due to increased sea surface temperature (SST) and fewer clouds, and the net incoming flux difference [right]
is also positive. NET = S – (SW + LW), where S represents the incoming solar radiation. Image credit: Norman Loeb
10             The Earth Observer                             July - August 2018                              Volume 30, Issue 4

                    NASA’s Earth Science Division has chosen radiation         monthly mean SW flux bias was between -0.8 and 0.2
meeting summaries
                    budget measurements for the first EV-C to demonstrate      W/m2 and LW flux bias was -0.5 W/m2.
                    a technique or approach for making long term broad-
                    band measurements with the appropriate characteris-        David Kratz [LaRC] reported on impacts to the
                    tics, e.g., wavelength covered, stability, accuracy, and   parameterized surface fluxes with the change from
                    calibration requirements.                                  MODIS Collection 5 to Collection 6. The polar night
                                                                               surface LW fluxes showed the largest change. Use
                    Susan Thomas [LaRC/Science Systems and                     of MODIS Collection 6.1 is expected to reduce the
                    Applications, Inc. (SSAI)] reported steady calibration     change due to corrections to the water vapor channel.
                    trends for FM-1 through FM-5—based on on-orbit
                    calibration targets. The CERES FM-5 Start of Mission       Dave Doelling [LaRC] briefed the team on his group’s
                    Spectral Response Function (SRF) is being reevaluated      approach to converting geostationary narrowband
                    to address the difference between clear ocean and all-     imager radiances into broadband fluxes. He showed
                    sky scenes observed in intercomparison studies between     the results from intercalibrating MODIS radiances
                    the CERES instruments on the Suomi National Polar-         with several of the new Geostationary satellite images:
                    orbiting Partnership (NPP) and Aqua satellites. The        Himawari-9, Meteosat-11,5 and GOES-16. He intro-
                    updated SRF and radiometric scale difference will be       duced the MODIS and Geostationary Instantaneous
                    included in Suomi NPP Edition 2 processing.                Cloud Comparison Tool that allows matching and visu-
                                                                               alizing gridded MODIS and geostationary clouds infor-
                    Kory Priestley [LaRC] announced that the FM-6              mation for times when they are both available. This has
                    commissioning activities have successfully been            reduced the time necessary to validate geostationary
                    completed. FM-6 differed from previous CERES instru-       imager cloud algorithms.
                    ments by having a LW channel instead of a window
                    channel. Radiance measurements from the “new” LW           Dave Rutan [LaRC/SSAI] presented an analysis of
                    channel tracks favorably with the “classic” LW measure-    changes between versions of MODIS aerosol data
                    ment, which is obtained by subtracting the shortwave       and how the results obtained using the Model of
                    (SW) channel from the total channel. They are within       Atmospheric Transport and Chemistry (MATCH)
                    2% without any calibration adjustments applied yet.        change with the different inputs. Collections 6 and 6.1
                                                                               have improved coverage over Collection 5, but reduced
                    William Smith, Jr. [LaRC] showed that results from an      global aerosol optical depth.
                    updated cloud mask and retrieval algorithms applied to
                    the Geostationary Operational Environmental Satellite      Paul Stackhouse [LaRC] reported on using the ArcGIS
                    (GOES)-16 Advanced Baseline Imager (ABI) data              architecture to geospatially enable the entire Prediction
                    produced results closer to the MODIS results than the      of Worldwide Energy Resource (POWER) data archive
                    previous GOES satellites. (In January 2018, GOES-16        (https://power.larc.nasa.gov) for access to growing applied
                    became GOES East, replacing GOES-13 that had               science users. A user clicks on the map interface to
                    been serving in that capacity.) GOES-16 cloud infor-       obtain point or region data for single or multiple vari-
                    mation will now be included in the CERES Synoptic          ables. The product resolution has improved to 0.5° x
                    One-degree and Cloud Type Histogram products.              0.5° latitude and longitude for fluxes and meteorologi-
                    Smith summarized the impact of including data from         cal parameters.
                    the Crosstrack Infrared Sounder (CrIS) on Suomi NPP
                                                                               Kathleen Moore [LaRC] announced that all CERES
                    in the Suomi NPP cloud mask. The CrIS data provide
                                                                               production has migrated into CERES AuTomAted job
                    radiances at 6.7 and 13 µm—two channels that VIIRS
                                                                               Loading sYSTem (CATALYST), allowing automated
                    does not have, but MODIS does. These channels
                                                                               submission of jobs.
                    impact cloud fraction calculations mostly over snow
                    and ice surfaces in the polar night. However, including    Jeff Walter [LaRC] gave an overview of the Atmospheric
                    the data from CrIS only showed very modest improve-        Science Data Center’s (ASDC) cloud computing vision
                    ment at polar night where skill is relatively poor.        and strategy. The ASDC will be providing a highly
                    Therefore, the Science Team decided not to include         configurable, on-premise, private cloud environment.
                    CrIS data in Suomi NPP cloud processing and to work        The use of Platform as a Service (PaaS)6 for website host-
                    on other methods to improve the polar cloud fraction.      ing has already been made available.
                    Wenying Su [LaRC] investigated Angular Distribution        5
                                                                                 Himawari is the Japanese Meteorological Agency's and
                    Models (ADMs) for several stratifications of mixed-        Meteosat is the European Organization of Meteorological
                    phase clouds over the ocean. The largest improvement       Satellite’s (EUMETSAT) line of geostationary satellites.
                    came when the mixed phase is further divided into two
                                                                               6
                                                                                 Platform as a Service (PaaS) refers to a category of cloud
                                                                               computing services that provides a platform allowing custom-
                    groups. Su’s study applied the CERES Edition 2 ADM         ers to develop, run, and manage applications without the
                    using the clouds produced from Edition 4 to deter-         complexity of building and maintaining the infrastructure
                    mine the uncertainty attributed to the ADMs. Global        typically associated with developing and launching an app.
The Earth Observer July - August 2018 Volume 30, Issue 4 11
Brant Dodson [LaRC/SSAI] provided insight into Kyle Armour [University of Washington] used the
meeting summaries
scientific investigations that the Global Learning and same linear-forcing feedback framework that Zelinka
Observations to Benefit the Environment (GLOBE) discussed to look at the challenges in trying to infer
clouds and CERES dataset has supported. He noted radiative feedback from observations. There are a vari-
that 87% of the time-matched observations agreed ety of distinct radiative feedbacks governing the radia-
on the presence of clouds. Dodson also showed that tive response to warming that proves problematic when
cirrus clouds are the most prevalent cloud type seen by using observations to determine ECS. For example,
observers. This makes these ground-based observations sea surface temperature (SST) increases in the Western
most helpful because it is cirrus clouds that CERES Pacific have more global impact than a similar increase
observations most frequently miss. The information will in the Eastern Pacific—see Figure 2. The term, inferred
support work on improving algorithms. climate sensitivity (ICS), is used to cover transient
feedback. ICS can be measured from prescribed SST
Invited Science Presentations climate model runs. It is generally smaller than ECS
when evaluated in climate models and matches the
During the morning on the second day, two invited
value obtained from observations.
presenters provided insight that helps explain the
smaller equilibrium climate sensitivity (ECS)7 seen in Contributed Science Presentations
observations than those in long-duration (100-year)
climate model runs. A variety of topics were covered during the many contrib-
uted science presentations, which took place on the second
Mark Zelinka [Lawrence Livermore National and third days of the meeting. These included:
Laboratory (LLNL)] investigated time dependence of
cloud feedback on ECS using the linear-forcing feed- • methods to estimate climate sensitivity;
back framework. The ECS estimates obtained from
observations are consistently smaller than those of • approaches to understanding cloud radiative
climate models. He showed that this discrepancy can feedback;
be explained by accounting for variation in the pattern
• determination of heating rates;
of warming and cloud feedback. When the warming is
concentrated in tropical ascending regions it strengthens • validation efforts—where CERES cloud properties
low-level stability, leading to increases in low cloud cover are compared with surface and cloud observations
across the tropics. The effect is more localized when the or other satellite products;
warming is in a tropical descent region. When heat-
ing is localized to the ascent region, the cloud feedback • improvements to existing Earth Radiation Budget
is more negative than in response to uniform warm- (ERB) products; and
ing. The most recent 30 years has shown more localized
warming than the spatially-uniform greenhouse warm- • efforts to improve algorithms for future CERES
ing in models, leading to the underestimation of ECS. products.
7
The ECS refers to the equilibrium change in global mean For a summary of presentations, see the Table on
near-surface air temperature that would result from a pages 12-13.
sustained doubling of the atmospheric (equivalent) carbon
dioxide concentration.
Figure 2. The radiative response to
localized patches of warming using
the National Center for Atmospheric
Research (NCAR) Community
Atmosphere Model (CAM4) model.
A forced increase in SST in the
[W/m2K] Western Pacific [upper left], a tropi-
cal ascending region, leads to strong
TOA radiative response across the
tropics [upper right]. While a similar
SST increase in the Eastern Pacific
[lower left] has only a localized TOA
radiative response [lower right].
Image credit: Kyle Armour
[W/m2K]12 The Earth Observer July - August 2018 Volume 30, Issue 4
Table. List of Contributed Science Presentations at the Twenty-ninth CERES Science Team Meeting.
meeting summaries
Speaker [Affiliation] Summary
Continued the discussion of ECS (that began in the Invited Science
Presentations) by looking at changes in the 500-mb temperature over
Andrew Dessler [Texas A&M
climate model runs to determine ECS. This approach reduces the
University (TAMU)]
interdecadal variability and magnitude of the ECS compared to the
approach using surface temperature.
Showed that two different methods of looking at cloud forcing
Xianglei Huang [University of
produce the same broadband result but show significantly different
Michigan]
contributions from various parts of the spectrum.
Tyler Thorsen [NASA’s Langley
Matched the monthly zonal CERES observed flux anomalies by using
Research Center (LaRC)/University of
water vapor and cloud anomalies.
Washington]
Described a diagnostic tool used to determine surface and atmospheric
contributions to SW Top of Atmosphere (TOA) flux. CERES obser-
Hailan Wang [LaRC/Science Systems
vations and reanalysis broadly agree that variability in the atmosphere
and Applications, Inc. (SSAI)]
dominates in non-polar regions and variability at the surface domi-
nates in polar regions.
Compared the representation of TOA all-sky and clear-sky fluxes by
Hai-Tien Lee [University of Maryland]
three different reanalyses to Edition 4 CERES data.
Investigated the use of three indices to determine the amount of
convective aggregation in cloud objects from CERES observations.
Kuan-Man Xu [LaRC]
Consistency is better when the area of the cloud cluster is accounted
for in the index instead of just separation distance.
Used data from CERES and from the Atmospheric Infrared Sounder
Sergio Sejas [LaRC] (AIRS) on Aqua to estimate the greenhouse effect—the difference
between the LW surface flux and the outgoing LW radiance.
Provided an update on the Global Modeling and Assimilation Office's
(GMAO) efforts to develop an integrated Earth system analysis that
Mike Bosilovich [NASA’s Goddard
will have coupled atmosphere, ocean, land, and cryosphere where
Space Flight Center]
changes in one are used in the other models. His focus was on aerosol
and ocean improvements.
Identified a potential bias in SW albedo due to partially cloud-filled
Seung-Hee Ham [LaRC/SSAI]
imager pixels.
Compared heating rates between observations obtained by the
Cloud–Aerosol Lidar and Infrared Pathfinder Satellite Observations
Laura Hinkelman [University of
(CALIPSO) satellite and CERES, which operate on different spatial
Washington]
scales. The heating rate has a large peak area that leads to a high likeli-
hood of sampling the heating rate close to median, regardless of scale.
Presented results on radiative heating rate in single-layer ice clouds
Erica Dolinar [University of North
based on a dataset she developed, the CloudSat 2B-FLXHR-LIDAR,
Dakota]
and CERES–CALIPSO–CloudSat–MODIS [CCCM] dataset.
Identified what might be coherent interannual oscillations in summer-
Dong Wu [GSFC] time Arctic and subarctic TOA fluxes. The equatorward progression
has been intensifying since 2009.
Discussed the Barents–Kara Sea region as being the significant location
of Arctic warming amplification. Clouds do matter to Arctic amplifica-
Patrick Taylor [LaRC]
tion, but their indirect impact of modulating the circulation response
may be more important than the direct effect on the albedo.
Analyzed the slow 2016-17 Arctic sea ice growth season and its
connection to higher moisture intrusions. The increase in moisture led
Brad Hegyi [LaRC]
to increased downwelling of LW flux and higher surface temperature,
reducing sea ice growth.The Earth Observer July - August 2018 Volume 30, Issue 4 13
Table. (cont.) List of Contributed Science Presentations at the Twenty-ninth CERES Science Team Meeting.
meeting summaries
Speaker [Affiliation] Summary
Introduced a two-layer snow albedo model to improve radiative transfer
model results. The model uses a snow water equivalent (SWE) for the
Ping Yang [TAMU]
first layer, the effective radius that differs between the two layers, and
the black carbon internal mixing, which is the same for both layers.
Described an Advanced Very High Resolution Radiometer (AVHRR)
based Climate Data Record (CDR) of SW TOA radiative fluxes being
Tom Akkermans [Royal Meteorological developed by the Satellite Application Facility on Climate Monitoring
Institute of Belgium] (CMSAF) Project. The Earth Radiation Budget Experiment (ERBE)
algorithm to convert the imager narrowband-to-broadband and then
ADMs are applied. They are working on a 42-year record.
Described research studying the equilibrium dynamic in net radiation
Miklos Zagoni [representing himself ] at the surface and transfer of energy to the atmosphere through sensi-
ble and latent heat flux.
Evaluated fluxes using machine learning methods on CERES radi-
ances. The Artificial Neural Net produced fluxes had lower bias than
Bijoy Thampi [LaRC/SSAI]
those using the ERBE algorithm when compared to the Single Scanner
Footprint products.
Showed that CERES–MODIS Edition 4 clouds compare favorably
with Atmosphere Radiation Measurement (ARM) North Slope of
Baike Xi [University of Arizona]
Alaska ground observations. Cloud fractions are within 5% whether
compared by time of day or cloud phase (i.e., liquid or ice).
Described a new approach using the five MODIS carbon dioxide
Fu–Lung Chang [LaRC/SSAI] channels for detecting multilayer clouds. CALIPSO and Cloudsat data
are used in the multilayer algorithm validation.
Presented results of comparisons between CERES–MODIS and
CALIPSO clouds. The CERES–MODIS cloud retrieval does not
Chris Yost [LaRC/SSAI] detect too many low-level water clouds, but it overestimates the
cloud fraction when clouds are less than the 1-km (~0.6-mi) imager
pixel resolution.
Conclusion
By all accounts, the twenty-ninth CERES Science Team for Atmospheric Research (NCAR) in Boulder, CO.
Meeting was very productive. Topics covered in presen- Representatives from the Geostationary Earth Radiation
tations included ECS, cloud feedback, the Arctic, new Budget (GERB) and Scanner for Radiation Budget
radiation budget products, and improvements to algo- (ScaRab) instrument teams will be participating.
rithms. The next CERES Science Team Meeting will be
held in conjunction with the Earth Radiation Budget
Workshop, September 10-13, 2018, at National Center14 The Earth Observer July - August 2018 Volume 30, Issue 4
Summary of the Spring 2018 NASA Land-Cover and
meeting summaries
Land-Use Change Science Team Meeting
Kristofer Lasko, University of Maryland, College Park, klasko@terpmail.umd.edu
Catherine Nakalembe, University of Maryland, College Park, cnakalem@umd.edu
Krishna Vadrevu, NASA’s Marshall Space Flight Center, krishna.p.vadrevu@nasa.gov
Christopher Justice, University of Maryland, College Park, cjustice@umd.edu
Garik Gutman, NASA Headquarters, ggutman@nasa.gov
The 2018 NASA Land Cover and Land Use Change This year’s meeting was highly successful, with about
(LCLUC) program’s Science Team Meeting was held 120 participants from across the country including
April 3-5, 2018, at the Marriott Washingtonian Center, LCLUC principal investigators (PIs), research collabo-
located in Gaithersburg, MD. The meeting featured rators, post-docs, LCLUC-funded graduate students,
invited presentations, reports from the LCLUC Science researchers from the U.S. Geological Survey (USGS),
Team members funded as a part of South and Southeast NASA, and even a high school student conducting
Asia Research Initiative (SARI), as well as Synthesis LCLUC-related research at NASA’s Goddard Space
Projects from Research Opportunities in Space and Flight Center (GSFC).
Earth Sciences (ROSES) 2015 selections. Poster presen-
tations with lightning talks highlighted recent results Day One
from ongoing LCLUC-related research, including Garik Gutman [NASA Headquarters (HQ)—LCLUC
the Interdisciplinary Research in Earth Science (IDS) Program Manager; see photo below] kicked off the
Program and the New Investigator Program (NIP), meeting by stating that since the program’s inception
as well as introductions of the most recently selected over 300 projects have been funded, and socioeconomic
LCLUC-funded projects. The last day of the meeting components to land use research is one of the program’s
focused on the final results from the first round (2014) priorities. He showcased the success of the program’s
LCLUC Multi-Source Land Imaging (MuSLI) proj- regional initiatives including SARI, Northern Eurasia’s
ects (which are listed at http://lcluc.umd.edu/content/ Future Initiative (NEFI), and the Monsoon Asia
multi-source-land-imaging-musli), the status of the Integrated Research for Sustainability (MAIRS) under
Harmonized Landsat–Copernicus Sentinel-21 (HLS)
data initiative (https://hls.gsfc.nasa.gov), and future inter-
actions with the Landsat Science Team.2
1
The European Space Agency’s Sentinel missions were
developed specifically to meet the operational needs of the
Copernicus comprehensive Earth-observing program. Each
Sentinel mission is based on a constellation of two satellites
to fulfill revisit and coverage requirements, providing robust
datasets for Copernicus services. The two mentioned in this
article are Sentinel-1, a synthetic aperture radar mission, and
Sentinel-2, a land-imaging mission with resolution compa-
rable to that of Landsat. To learn more about the Sentinel
missions, visit https://www.esa.int/Our_Activities/Observing_
the_Earth/Copernicus/Overview4.
2
To read a summary of the 2017 Summer Landsat Science Team
Meeting, see the January–February issue of The Earth Observer LCLUC program manager, Garik Gutman, sets the science
[Volume 30, Issue 1, pp. 21-25—https://eospso.gsfc.nasa.gov/sites/ trajectory for the meeting, associated discussion sections, and
default/files/eo_pdfs/Jan_Feb_2018_color508_0.pdf#page=21]. lightning talks. Photo credit: Catherine Nakalembe
A group picture showing the meeting participants on the first day of the meeting, including scientists, graduate students, program managers,
collaborators, principal investigators, and other LCLUC community members. Photo credit: Kristofer LaskoThe Earth Observer July - August 2018 Volume 30, Issue 4 15
Future Earth’s Asia Initiative.3 Gutman emphasized the Earth and the United Nations International Land
meeting summaries
importance of the LCLUC program’s capacity build- Coalition. During the discussion that followed, a clear
ing activities such as training, often included before or connection between GLP and the NASA LCLUC
after LCLUC regional meetings coordinated through program surfaced. The GLP has strong linkages with
strong partnerships with SERVIR4 and SilvaCarbon,5 societal applications and benefits resulting from
space agencies such as the Geo-Informatics and LCLUC research, making a partnership with the NASA
Space Technology Development Agency (GISTDA, program very useful.
Thai space agency), and nongovernmental organiza-
tions such as the SysTem for Analysis, Research and One major part of the meeting included a series of
Training (START) program. Chris Justice [University presentations within the SARI component of the
of Maryland, College Park (UMD)—LCLUC Program LCLUC program. Krishna Vadrevu [NASA's Marshall
Scientist] spoke after Gutman's overview, and reviewed Space Flight Center (MSFC)] began with a discussion
the goals and objectives of the meeting. about the origin of the SARI program. He explained
that the concept arose from discussions following a field
Jack Kaye [NASA HQ—Associate Director of Research trip during a regional meeting in Kerala, India in 2013.
for NASA’s Earth Science Division] gave an invited Shortly after that, Vadrevu—along with other LCLUC
presentation. He recognized the good work being researchers, Ruth DeFries [Columbia University],
undertaken by the program, provided a summary of Rama Nemani [NASA’s Ames Research Center], Karen
current and upcoming NASA missions, and announced Seto [Yale University], and Dan Brown [University
that the LCLUC program will continue to receive of Washington]—consulted with Garik Gutman
funding to continue its interdisciplinary research. Kaye and Chris Justice to further develop the idea. With a
answered questions from the audience and noted that common goal, SARI leverages the research being under-
NASA is supportive of including data from interna- taken at NASA and regional institutes and universities
tional satellite assets and commercial data providers with science capacity-building activities being under-
to address Earth system science. He also pointed out taken by a large network of nonprofit organizations,
the improved capabilities of geostationary satellites universities, and programs such as NASA SERVIR.
for high-temporal-resolution monitoring of the land
surface, e.g., for land cover change relating to wild- Following Vadrevu's opening remarks on SARI, repre-
land fires, and monitoring of urban areas with frequent sentatives of 13 LCLUC–SARI funded projects gave
observations of night lights and their changes. presentations. All of the talks focused on activities in
South Asia. Specific presentation topics in this session
Ariane de Bremond [Global Land Programme included: forest change monitoring, agriculture land
(GLP)—Executive Officer] reviewed the GLP science use and food security, disease transmission, LCLUC
themes, which focus on linking sustainable land systems and armed conflict, urban growth challenges, sustain-
using modeling, monitoring, and case study syntheses able livelihoods in rural communities, drivers of forest
of specific topics, e.g., land-use conflict, land gover- plantation establishment, forest change and degrada-
nance, land-management systems, urban-rural inter- tion monitoring, consequences of changes in mangrove
action, and global sustainable development. LCLUC forests attributed to land use change such as shrimp
research is a major focus for GLP; it continues to farming expansion as well as natural processes of
nurture a network of internationally renowned scien- erosion—all with implications on carbon storage, biodi-
tists, nodal offices, and working groups, and pursues versity, and the economy; demographic change and
partnerships with many programs including Future related LCLUC, coastal zone impacts of LCLUC, and
progress in cropland monitoring with remote sensing.
3
Future Earth is a ten-year international research program
launched in June 2012 at the United Nations Conference Krishna Vadrevu highlighted that the SARI program
on Sustainable Development (Rio+20) that is intended to has been productive in recent years, citing as exam-
provide critical knowledge required to face the challenges
posed by global environmental change and to identify oppor- ples publication of a book on land–atmosphere inter-
tunities for a transition actions and several compilations of special issues of
4
SERVIR, a joint venture between NASA and the U.S. peer-reviewed journals such as Environmental Research
Agency for International Development provides state-of-the- Letters, Environmental Pollution, International Journal of
art, satellite-based Earth monitoring, imaging and mapping Remote Sensing, Journal of Environmental Management,
data, geospatial information, predictive models and science
applications to help improve environmental decision making and International Journal of Digital Earth. Following
among developing nations in eastern and southern Africa, the the presentations, Vadrevu led a discussion session,
Hindu-Kush region of the Himalayas, and the lower Mekong during which he noted that the current round of SARI
River Basin in Southeast Asia. SERVIR is not an acronym; it projects has focused on specific case studies in coun-
is derived from a Spanish word meaning “to serve.” tries such as Nepal, India, and Myanmar. However,
5
SilvaCarbon is an interagency technical cooperation program
of the U.S. government organized to enhance the capacity of broader LCLUC issues applicable to large spatial scales
selected tropical countries to measure, monitor, and report on will be needed as a focus for future projects. In addi-
carbon in their forests and other land-surface types. tion, participants agreed on the need for regionalYou can also read