DISCUSSION PAPER SERIES - Television, Health, and Happiness: A Natural Experiment in West Germany - Institute of ...
←
→
Page content transcription
If your browser does not render page correctly, please read the page content below

DISCUSSION PAPER SERIES

IZA DP No. 14721

Television, Health, and Happiness:
A Natural Experiment in West Germany

Adrian Chadi
Manuel Hoffmann

SEPTEMBER 2021
DISCUSSION PAPER SERIES

IZA DP No. 14721

Television, Health, and Happiness:
A Natural Experiment in West Germany

Adrian Chadi
University of Konstanz and IZA
Manuel Hoffmann
Stanford University and University of Heidelberg

SEPTEMBER 2021

Any opinions expressed in this paper are those of the author(s) and not those of IZA. Research published in this series may
include views on policy, but IZA takes no institutional policy positions. The IZA research network is committed to the IZA
Guiding Principles of Research Integrity.
The IZA Institute of Labor Economics is an independent economic research institute that conducts research in labor economics
and offers evidence-based policy advice on labor market issues. Supported by the Deutsche Post Foundation, IZA runs the
world’s largest network of economists, whose research aims to provide answers to the global labor market challenges of our
time. Our key objective is to build bridges between academic research, policymakers and society.
IZA Discussion Papers often represent preliminary work and are circulated to encourage discussion. Citation of such a paper
should account for its provisional character. A revised version may be available directly from the author.

 ISSN: 2365-9793

 IZA – Institute of Labor Economics
Schaumburg-Lippe-Straße 5–9 Phone: +49-228-3894-0
53113 Bonn, Germany Email: publications@iza.org www.iza.org
IZA DP No. 14721 SEPTEMBER 2021

 ABSTRACT
 Television, Health, and Happiness:
 A Natural Experiment in West Germany*
 Watching television is the most time-consuming human activity besides work but its role
 for individual well-being is unclear. Negative consequences portrayed in the literature
 raise the question whether this popular pastime constitutes an economic good or bad,
 and hence serves as a prime example of irrational behavior reducing individual health
 and happiness. Using rich panel data, we are the first to comprehensively address this
 question by exploiting a large-scale natural experiment in West Germany, where people in
 geographically restricted areas received commercial TV via terrestrial frequencies. Contrary
 to previous research, we find no health impact when TV consumption increases. For life
 satisfaction, we even find positive effects. Additional analyses support the notion that TV is
 not an economic bad and that non-experimental evidence seems to be driven by negative
 self-selection.

 JEL Classification: C26, D12, I31, H12, J22, L82
 Keywords: health, happiness, well-being, natural experiment, television
 consumption, time-use, entertainment, CSPT, ArcGIS, mass
 media

 Corresponding author:
 Adrian Chadi
 Department of Economics
 University of Konstanz
 P.O. Box 131
 Universitätsstr. 10
 D-78457 Konstanz
 Germany
 E-mail: adrian.chadi@uni-konstanz.de

 * The authors are grateful for discussions and comments by Marco Castillo, Laura Dague, Jason Lindo, Ragan Petrie,
 Cody Tuttle, and seminar participants in Aachen, College Station, Freiburg, Konstanz, Munich, and Trier, as well as
 participants of the ASSA Meeting (Philadelphia, 2018), Economics, Health and Happiness Conference (Lugano, 2016),
 EEA-ESEM Congress (Copenhagen, 2021), ESPE Conference (Barcelona, 2021), FUR Conference (Warwick, 2016),
 Spring Meeting of Young Economists (Lisbon, 2016), Workshop on Media Economics (Trier, 2021), and Workshop on
 Microeconomics (Lueneburg, 2016). Among many others who helped us with the signal calculation and the geographic
 software programs, we particularly wish to thank Alexander Goldmann, Julian Vaudroz, and Philipp Pauly for providing
 excellent research assistance. We are grateful to Andriy Achyn for his work on the digital map. For funding and support
 for the telephone survey, we are indebted to the Institute for Labour Law and Industrial Relations in the European Union
 at Trier University, and we thank, in particular, Martin Amann and Ruth Regnauer for excellent research assistance. For
 helping us to organize the telephone survey, we also thank Matthias Sand and the GESIS Leibniz Institute for Social
 Sciences. For the SOEP data access, we thank the DIW Berlin and, in particular, Jan Goebel, Florian Griese, Philipp
 Kaminsky, and Ingo Sieber for their support. We are grateful to the Konstanz Cluster of Excellence (EXC 2035) for
 hosting the SOEP remote access and, in particular, Thomas Wöhler for his support. We thank the Federal Statistical
 Office of Germany for the EVS data access and, in particular, Melanie Heiliger, and Janina Loske for their support.
 For making technical data and documentation available to us and for helping us with background information on
 Germany’s transmitter stations, we want to thank in particular Nils Eulig from the NDR and Carsten Ehlenbruch from
 Germany’s Federal Network Agency. Finally, we thank Charles Crabtree and Holger Kern for sharing the CSPT with us.
1. Introduction
 “We know today that television makes you fat, stupid, sad, and violent.”
 (Ursula von der Leyen)

Television consumption, including its modern forms accessed over the Internet, is one of the
most time-consuming daily activities worldwide. Over the lifespan, watching TV even
surpasses work under plausible assumptions.1 Since TV consumption is voluntary, one may
hypothesize that spending so much time on this activity yields large individual benefits. On the
contrary, a sizable body of research suggests that TV consumption is a threat to both individual
health and happiness (Dietz and Gortmaker 1985, Hu et al. 2003, Hancox et al. 2004, Frey et
al. 2007, Bruni and Stanca 2008, Benesch et al. 2010, Cuñado and de Gracia 2012). While TV’s
desirable consequences at the social level are discussed in education and gender research
(Gentzkow and Shapiro 2008, Jensen and Oster 2009), numerous detrimental effects of TV
consumption are also well documented, including reduced political involvement, destruction of
social capital, higher divorce rates, increased household debt, and reductions in cognitive ability
(Gentzkow 2006, Olken 2009, Chong and La Ferrara 2009, Baker and George 2010, Hernæs et
al. 2019). Consistent with these findings, and exemplified by our introductory quote from the
current president of the European Union Commission, there is a wide-held belief that television
is generally harmful. However, it is unclear whether television consumption is individually
detrimental, and if so, why do individuals watch so much television in the first place?
 The puzzling empirical contradiction of individuals engaging in an activity that could be
both socially and individually harmful is reconciled in the happiness literature as a self-control
problem, with TV watching interpreted as a case of irrational behavior (Frey 2008, 2018). In
one of the studies based on survey measures of both happiness and TV viewing, Bruni and
Stanca (2008) ask: “Why do rational people allocate their time and resources without
maximizing their well-being?” Notably, economists have used happiness data to examine
irrational choices not only on the context of television but also in other behaviors, such as
smoking, where cigarette taxes and bans have been shown to serve as self-control devices,
making smokers happier (e.g. Gruber and Mullainathan 2005, Odermatt and Stutzer 2015).2
1
 Assume that an average individual works 40 years, 250 workdays per year, and 8 hours per day. Further assume
that the same person watches 3 hours of TV per day, which is below the official numbers in many countries,
including the United States. To surpass our lifetime work estimate of 80,000 hours (=40 x 250 x 8), this fictitious
person must watch TV for 74 years; or less if the person watches more hours each day. Millions of United States
citizens born in the 1940s easily exceed that number.
2
 In other research strands, there are discussions on whether and how reported happiness may reveal individual
choices, so that such measures could be interpreted as a production input factor of preferences and, hence, are of

 2
Given the widespread interest in discussing self-control problems in economics (e.g. Laibson
et al. 1998, Frederick et al. 2002, Loewenstein et al. 2003), it is not surprising that there are also
intense discussions about policy solutions for such phenomena, reaching from asymmetric
paternalism to nudges to other types of intervention (e.g. Camerer et al. 2003, Thaler and
Sunstein 2009). However, to draw such policy conclusions in the case of television, it is
imperative to first clarify whether watching TV falls into the category of irrational behavior
with negative individual consequences. If this is not the case, and agents rationally benefit from
consuming an economic good, then social consequences are a problem of negative externalities
that can be addressed by internalizing those costs. Whereas research appears to be certain that
TV consumption is an economic bad, implying that individuals gain nothing from pursuing this
activity, there is reason to question this widely held notion, and particularly the empirical
evidence provided so far. Arguably, unhappy or unhealthy individuals may sort themselves into
higher levels of TV consumption, making it difficult for the empirical researcher to determine
whether television consumption is individually harmful with non-experimental data. While we
are not the first to recognize this possible sorting problem, we are the first to credibly address
it with quasi-representative data from a natural experiment.3 By doing so, we find evidence that
is inconsistent with the idea that television is an economic bad or that individuals behave
irrationally.
 In our study, we investigate the consequences of television consumption on happiness and
health by exploiting the occurrence of a natural experiment in West Germany. We use this
unique setting in conjunction with detailed longitudinal information on television provision,
individual time-use, and well-being measures obtained from multiple sources of data, thereby
providing credible evidence on the individual implications of TV in ways not previously
achievable. By discovering a natural experiment with unique historical facets, we add a novel

interest in itself (Benjamin et al. 2014). Evidence indeed shows that happiness is a determinant of economic choices
and behavior, be it time preferences (Ifcher and Zarghamee 2011), work effort (Oswald et al. 2015), or voting
(Liberini et al. 2017). Note that we treat the terms happiness and life satisfaction synonymously, in line with many
contributions in the field of happiness research, while we consider well-being to be a broader term that also
incorporates health.
3
 Most of the studies on health and happiness do point out that the identification of the causal effect of TV watching
is difficult and practically impossible with the empirical approaches used so far. For example, Frey et al. (2007)
mention in their study a lack of a “natural experiment” to study causality. In this context, see Kataria and Regner
(2011) for a comment on identification issues in the research on TV and happiness. In regard of health, see
DellaVigna and La Ferrara (2015) who point out that studies from outside economics typically “lack a convincing
design” to credibly determine the effects of TV. They conclude: “Surprisingly given the interest in health
economics, the evidence is limited” (p. 744).

 3
research setting to a number of studies using regional heterogeneity in media provision during
periods of implementation or expansion, such as the case of cable TV in the United States
(Gentzkow 2006, Baker and George 2010, Campante and Hojman 2013). 4 In contrast to
research in economics exploiting variation in terrestrial TV signals from West Germany
reaching into East Germany (Hyll and Schneider 2013, Hennighausen 2015, Bursztyn and
Cantoni 2016, Slavtchev and Wyrwich 2017, Hornuf et al. 2017, Laudenbach et al. 2018, Friehe
et al. 2018, 2020), we are the first to exploit the West German setup with its regional variation
in terrestrial signals of private TV, thereby studying individual behavior within a fully
developed country at the center of Europe. Arguably, it is not surprising that natural
experiments with regional variation in TV consumption rarely present findings from the
developed world. For a country like the United States, we would have to return to the mid-20th
century, when systematic surveys were far less common than they are today. Due to an overlap
of nationwide surveys in West Germany with our historical incidence, the following setup
allows us to comprehensively analyze whether TV consumption actually increases after signal
reception before we turn to its consequences for health and happiness.
 The historic natural experiment on television in West Germany starts with a de facto ban on
commercial TV until the early 1980s and, by international standards, low levels of TV
consumption with two hours per day for the average German. As a result of a Supreme Court
decision in 1981, private television became legal in Germany, and several new channels
emerged.5 Despite new technological opportunities such as cable and satellite, most citizens
could not watch any of the new programs for years due to the failure of the responsible and later
dismantled public institution (the Deutsche Bundespost) to promptly roll out private TV. In
consequence, there were several years during which commercial TV providers searched for
options other than cable or satellite to reach their potential viewership. They found a cost-
effective solution: terrestrial frequencies of public media stations that were, by chance, still
available. However, most powerful frequencies were used by public broadcasts in the late
1980s, for which the stations were originally built decades before; thus, this opportunity was

4
 For a review of different settings used in TV research to date, see DellaVigna and La Ferrara (2015). They
emphasize the significant methodological developments and list influential papers published in major economics
journals in recent years. Apart from research on TV, economists have done work on the impact of media, such as
Strömberg (2004), DellaVigna et al. (2014), Adena et al. (2015), and Yanagizawa-Drott (2014) for radio, and
Bauernschuster et al. (2014) and Falck et al. (2014) for the internet.
5
 We use the terms private and commercial TV simultaneously. While public TV in Germany is partly financed
by mandatory fees, private TV channels do not receive fees but must rely on advertising revenues and are privately
owned. For example, during our investigation period, media tycoon and later prime minister of Italy, Silvio
Berlusconi was one of the owners of private TV channel Tele5.

 4
limited. Only a few stations still had open frequencies, enabling them to send out terrestrial
signals to millions of households. Due to an earlier Supreme Court ruling, there was no
opportunity for commercial TV to expand upon pre-existing terrestrial frequencies since
transmitter stations in West Germany could only be built for public media. In consequence, a
technically limited transmitter reach created naturally emerging borders that split citizens into
receivers and non-receivers of private TV via antenna.6
 By leveraging technical data on all terrestrial stations transmitting commercial TV in
Germany, we determine broadcast signals in a precise fashion to distinguish between TV
treatment and control regions. Following recent studies on the impact of media, we use
sophisticated software based on the Longley-Rice signal propagation model to identify regions
with and without reception by considering not only technical data, such as station power, but
also geographical information, such as mountains or valleys. A major benefit of our empirical
setting is the fact that two large household studies of the German population were ongoing
during our investigation period. First, the German Socio-Economic Panel (SOEP) provides us
with detailed survey data on the situation of individuals at the time of the signal introduction,
including their county of residence. We merge our technical calculations with SOEP data at the
regional level to compare how individual behavior responds in regions where commercial TV
via terrestrial frequencies suddenly became available versus regions where it did not. We study
the implications of TV access on a set of daily individual time-use activities, allowing us to
inspect whether private TV reception increases TV consumption. The SOEP questionnaire also
contains several outcome variables of interest capturing the individuals’ overall satisfaction
with their lives and indicators for their health, including the use of doctor services and a
subjective self-assessment of health. By exploiting the data’s panel structure, we employ an
individual fixed-effects approach to examine how TV consumption changes at the individual
level due to commercial TV reception and how well-being is affected as a result of watching
more television, without any influence from time-invariant individual or regional
characteristics. Second, we merge the signal calculations with data from the German Income
and Expenditure Sample (EVS) at the municipality level.7 The EVS provides us with household

6
 The success of the TV channel RTLplus, with David Hasselhoff as the channel’s first superstar, is a testament of
an exogenously triggered increase in TV consumption, as nationwide market shares more than doubled in 1989
due to heavy TV consumption in just a few areas of the country (see Section 2).
7
 The German Federal Statistical Office conducts the EVS for various purposes, especially to inform public
policies. For example, the data are used to determine the level of social benefits paid to welfare recipients in
Germany. The EVS also has been the basis for numerous studies on savings and consumption (e.g. Fuchs-
Schündeln 2008, Friehe and Mechtel 2014).

 5
expenses on components relevant to individual health, enabling us to investigate the
consequences of TV consumption on health-related purchases.
 In line with the historical background, we find that the reception of private TV significantly
increases TV consumption. According to our time-use analysis, increased TV consumption due
to private TV may reduce time spent on housework, suggesting a substitution effect between
those two activities. For our main outcomes, we contradict previous findings on the
consequences of TV. Individual happiness improves due to TV consumption in terms of life
satisfaction, while individuals do not suffer health impairments from watching TV more often.
Television consumption does not reduce health satisfaction nor does it lead to an increase in
doctor visits. This main conclusion does not change when we inspect long-run effects in a
dynamic treatment analysis by exploiting the longitudinal nature of our empirical setup. In fact,
we can rule out negative health effects from television for a treatment period of several years.
 Our contributions are multifaceted. First, we provide a textbook example of how a negative
result from the literature is completely reversed with a credible empirical setting based on a
historical coincidence. By juxtaposing different pieces of evidence, we offer an explanation for
previous findings, which suggests there may be a self-selection of unhealthy or unhappy types
of individuals among the group of intense TV viewers. In line with this, we can confirm robust
negative associations between TV viewing and both health and life satisfaction in more recent
data from our own complementary survey from 2015 . Second, we provide a new setting for
research on the effects of TV based on a unique natural experiment that took place in a large
and fully developed Western country, allowing generalizable findings from the relatively recent
past. The setting further allows for longitudinal analyses of the long-run impacts of TV in a
time window of several years, until regional disparities in access to private TV due to terrestrial
frequencies became irrelevant. 8 Third, the data include information on possible behavioral
changes, enabling us to empirically verify whether the new opportunity to watch TV due to
technological advancements actually affected media consumption. The available time-use data
reveal how individuals re-adjust their daily activities to have more time for watching TV, which
is a novelty in the research on the causal impact of television in representative populations of
adults. Moreover, consumption data inform us about the possible effects of television on health-

8
 The rise of Germany’s No.1 private TV channel RTL ended in 1993, when market shares reached a historic peak
(see Figure A1), suggesting that the channel could not substantially benefit from further growth in viewership as
a result of increasing proliferation of cable and satellite. As receiving private TV via terrestrial frequencies became
relevant for millions of Germans throughout the second half of 1988, our setting provides us with a treatment
phase of roughly four years.

 6
related behavior. Fourth, we complement ongoing research on TV consumption with policy-
relevant findings on critical outcomes that have not received the attention that they arguably
deserve from economists. Thereby, we contribute to the debate about the impact of media on
society, which has mainly focused on the social costs and benefits, rather than the well-being
of the individual. According to our results, TV watching does not appear to be an economic
bad. Individuals seem to make a rational choice in the sense that television provides them with
a benefit. This supports the notion of individual welfare maximization. While externalities for
societies could be either positive or negative, our findings explain why, despite its possible
social costs, TV consumption is one of the most popular activities.
 The remainder of our paper is structured as follows. Section 2 illustrates the early phase of
private TV in West Germany and describes the natural experiment (with supplementary details
on the history in Appendix A). Section 3 explains the different datasets, including technical
calculations of local TV signal reach (Appendix B provides supplementary information on
technical details and checks). Section 4 presents a replication of earlier findings in the literature,
and Section 5 contains the main results, including extensions and further analyses (with
Appendix C providing more information on the EVS data and Appendix D offering
supplementary output). Section 6 discusses the findings, with a focus on television content, to
learn more about external validity. Section 7 concludes by illustrating the implications for
public policy and provides alternative interpretations of our evidence, thereby addressing
whether the proliferation of television could be seen as a success story or not.

 2. Background
The historical development of commercial TV in West Germany involves a variety of different
actors, such as media tycoons, politicians, some transmitter stations with limited reach, a TV
superstar with a speaking car and Germany’s Supreme Court. We focus in the following on the
most relevant historical aspects to understand the occurrence of a true and original natural
experiment in the center of Europe.9
 Long before the rise of commercial TV in Europe, Germans were highly skeptical of
television as a technology. Many Germans associated TV and its proliferation with the

9
 Harrison and List (2004) provide a nice and not-so-serious definition: “Natural experiments arise when the
experimenter simply observes naturally occurring, controlled comparisons of one or more treatments with a
baseline. The common feature of these experiments is serendipity: policy makers, nature, or television game-show
producers conspire to generate these comparisons.” As we document, the history of commercial TV in West
Germany appears to contain all three of these ingredients. For a timeline of events (Figure A1) and documentation
of the proliferation of TV in Germany based on excerpts from historical media reports, see Appendix A.

 7
stultification of the masses (Volksverdummung), which could explain why there was no
resistance to the legal ban of private TV for many decades. As a result of this consensus, TV
only existed in a limited form, with only a few public TV channels. In contrast to other
developed countries at the time, such as the United States, watching TV played a relatively
minor role in West German citizens’ daily lives, with two hours per day allowing for substantial
increases in TV consumption (Oltmanns 1993). The television landscape started to change
dramatically in the 1980s. Whereas the ban on private TV was based on the notion that
terrestrial broadcasting via frequencies only allowed a limited number of media offers, the
emergence of cable and satellite as alternative transmission avenues promised to dissolve this
technical bottleneck. The prospect of overcoming the scarcity of transmission avenues due to
these modern technological developments resulted in a 1981 decision by Germany’s Supreme
Court to lift the ban on private TV. Simultaneously, a new conservative federal government led
by Chancellor Helmut Kohl decided to proliferate commercial TV in Germany, which
contrasted starkly with the policies of the former social-democratic government that was poised
to protect the monopoly of public TV.
 When the first commercial TV channels debuted in Germany in 1984, only a few thousand
households were able to watch the new programs. To quickly change this, the new conservative
government tasked the Deutsche Bundespost with implementing commercial TV. However,
this public institution failed to provide new TV channels to German households in a timely
manner and was ultimately dismantled in 1994. The Bundespost focused on cable as the
preferred avenue for reaching potential TV consumers, and invested heavily in what critics
called a “billion-dollar grave”. In the late 1980s, only a minority of Germans watched private
TV via cable, and satellite TV was not yet an option. Consequently, there were several years
during which both politicians who supported private TV and officials from emerging TV
channels had an incentive to find an alternative way to reach German households. While
politicians were interested in having good relations with the media, media companies sought a
first-mover advantage in an emerging and growing media landscape in one of Europe’s most
economically relevant countries. It soon became clear that there was a simple solution:
terrestrial frequencies on public-media transmitter stations that were not yet in use.
 It was apparent, however, that powerful frequencies were extremely rare, since most of those
frequencies were in use by public media broadcasts for which the stations were built. The
stations that could be used for private TV in the late 1980s were mainly constructed in the 1960s

 8
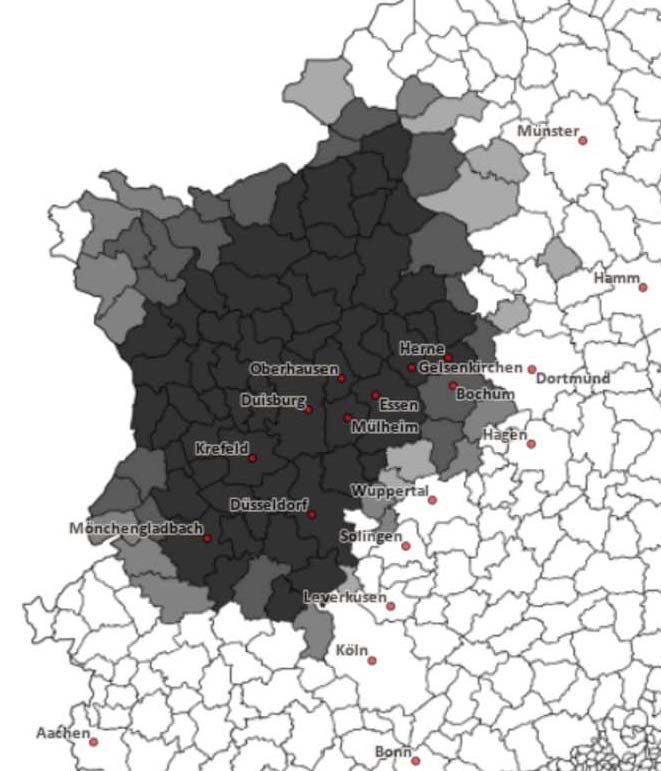
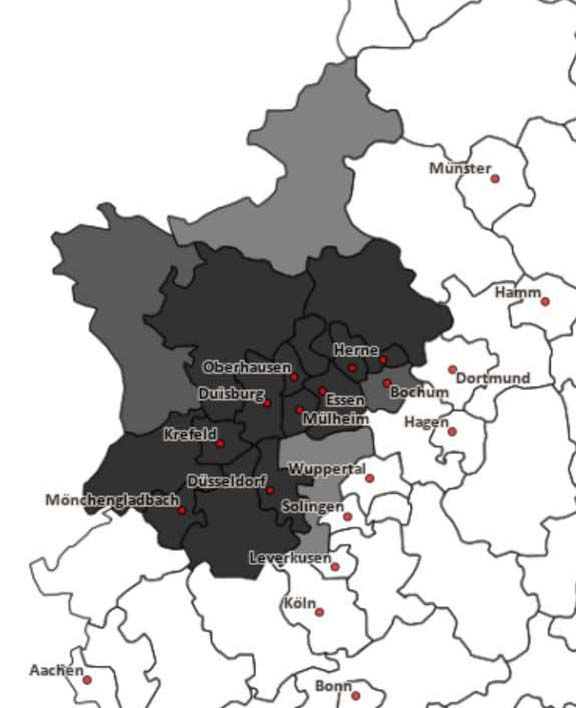
to provide the country with a second public TV channel following a 1961 Supreme Court
decision. Due to the ban of private TV, it was unforeseeable during the construction phase that
there would be a strong commercial desire for more frequencies decades later. Therefore,
almost all of the powerful terrestrial frequencies with significant reach were in use by public
media broadcasts in the late 1980s. There were only a few stations that coincidentally happened
to still have an open slot in the form of a frequency with significant power.
 Apart from the technical limitation of the availability of powerful frequencies, there was also
a legal constraint on the expansion of terrestrial broadcasting. According to the Supreme Court,
the management of Germany’s network of transmitter stations was seen as a politically sensitive
issue, and hence the building of new stations was a public task that should be organized
independently of political influences. In consequence, no commercial TV provider had a legal
option to expand on the existing network of transmitter stations.
 Powerful frequencies ensured that all TV viewers could watch the program, independent of
technical equipment, which was not necessarily the case with low-power frequencies.10 At the
state level, German politicians realized the importance of these frequencies in reaching a
significant number of households, and they allowed the use of the remaining public-media
frequencies for non-public TV. To illustrate, consider the densely populated federal state of
North Rhine-Westphalia (NRW), where available frequencies were called “juicy” by the media
due to their extraordinary desirability. Private TV channel representatives applied for
frequencies to the state government, which would decide on frequency usage. Following the
allocation of frequencies to TV companies in 1988, millions of citizens in some western regions
of NRW were suddenly able to watch commercial TV via antenna because they lived close
enough to a transmitting station. At the same time, other citizens – including those in the eastern
parts of NRW – were unable to receive the terrestrial signal. Favoritism played a role in our
context, as it did in other empirical TV settings, such as in Brazil (see La Ferrara et al. 2012),
as media tycoons exerted enormous efforts to convince state officials to receive frequencies.
However, such favoritism only influenced which commercial TV provider received the “juicy”
frequency, not whether a powerful frequency was technically available or not. This was
determined by ex-ante predetermined factors and the coincidence of still available capacities at

10
 Figure D1 depicts a 1980s TV set with an indoor antenna. Such devices allowed individuals in West Germany
to watch television broadcasts via powerful terrestrial signals at the time.

 9
transmitter stations built many years earlier for the sole purpose of public TV and radio
broadcasts.

 --- Figure 1 about here ---

Figure 1 shows the private TV signal reach across West Germany in 1989.11 Due to signal reach
limitations, naturally emerging borders split the country into potential receiver (colored) and
non-receiver (not colored) areas. In addition to the NRW frequencies in the West, there were
private TV frequencies in use in the North of Germany, and there were some smaller areas
throughout Germany where receiving private TV via terrestrial frequencies was technically
possible. In each case, it is an empirical question whether the signals had a significant impact
on individual TV consumption.
 The year 1989 was pivotal in the proliferation of commercial TV in Germany. Among
various competitors, RTLplus became the country’s number one private TV channel that year
and remained at the top for decades. The channel’s market share reached 10% (KEK 1998),
which was very high considering that only a minority of German households could watch it.12
The program organizers behind RTLplus were able to establish their own superstar, David
Hasselhoff, with a popular TV show called Knight Rider. 13 Sat.1, Germany’s number two
commercial TV channel, did not do as well. While the owner, Leo Kirch, received some
frequencies in northern Germany, he had less success in the state of NRW. The situation in
1989 was even worse for Tele5, the third private TV broadcast owned by Italian media tycoon
Silvio Berlusconi. Tele5 did not receive any of the major frequencies (see Table D1).

11
 This graphical illustration is a product of our calculations and the work of a graphic designer. Patterns in this
illustration align with those in ad hoc maps for single frequencies drawn by technical experts and shown to us.
Through personal communications with leading experts in the topic of terrestrial frequencies in Germany, we
discovered that there is no exact calculation of access patterns describing the reach of private TV in Germany so
far. As a result, we are the first to complete this laborious task of determining the signal reach for terrestrial
frequencies, which were used to broadcast private TV in the late 1980s and early 1990s. Table D1 provides details
on the most powerful and hence most relevant active private TV frequencies in the spring of 1989 (with at least a
power of 10kW). In addition to the powerful frequencies, we collected data on over sixty minor frequencies (with
power of less than 10kW). While many low-power frequencies started broadcasting in the years after 1989, there
was little change in terms of powerful frequencies, underlining the importance of 1989 for private TV in Germany.
12
 Based on our calculations using SOEP data, we find that the terrestrial RTLplus signals could reach roughly a
third of Germany’s population. As documented in Appendix A, satellite and cable TV only played a minor, if any,
role at the time.
13
 Knight Rider, like many other shows, was produced in the United States and dubbed into German. An intriguing
aspect of David Hasselhoff’s success story in Germany was that the actor’s popularity on RTLplus allowed him
to start a music career. Although the public media did not play his music at that time, he reached the top of
Germany’s music charts in April 1989.

 10
Given the importance of terrestrial frequencies, it is not surprising that media companies
demanded more frequencies and even new transmitter stations. However, it was legally
impossible to build additional transmitter stations to reach more German households with
private TV. The legal framework was clear: the construction of stations was only allowed for
public media broadcasts. Given that the Supreme Court justified the revision of the ban on
private TV based on new technical developments that made it possible to go beyond terrestrial
broadcasting, commercial TV channels could only receive slots on public-media transmitters
that were still open. Attempts by these commercial TV providers to expand terrestrial TV in
Germany were thus doomed to fail, and they did. In particular, Silvio Berlusconi exerted
enormous efforts to expand terrestrial television in Germany for his channel Tele5 but
ultimately failed. He sold his shares during the 1990s when he left the German TV market.14

 3. Data
 3.1 TV Signals
We obtained original documents about terrestrial frequencies for West German television and
radio from the NDR (Norddeutscher Rundfunk), which is located in Hamburg, Germany. We
use the Wittsmoor lists as the first source of information. These annual overviews of all active
frequencies in West Germany are available throughout our investigation period in the late 1980s
and early 1990s, and they include basic facts such as the effective radiated power (ERP) in
kilowatts (kW). While related studies have used the 1989 Wittsmoor list for geographically
precise investigations into the effects of terrestrial TV signals from Western stations
broadcasting public TV to East German households (Crabtree et al. 2015, Bursztyn and Cantoni
2016), we are the first to consider information on private TV channels within West Germany
by constructing a longitudinal dataset on signal reach. We benefit from additional information
since we could obtain official records of the terrestrial frequencies on which private television
was broadcasted. These records contain detailed information on the frequency, including the
month when the private TV broadcast started, and on the transmitting station, including height
and geographic position. Finally, we are also the first to collect information on antenna patterns
of the terrestrial frequencies, which we received from Germany’s Federal Network Agency.

14
 As part of our historical documentation (Appendix A), several media reports covered Berlusconi’s remarkable
role in the German TV market. He first tried to convince officials in NRW to get the powerful frequencies, and
then offered to expand Germany’s terrestrial frequency network; yet, both attempts were unsuccessful.

 11
Since patterns can differ substantially across stations, this information improves precision when
calculating TV signal reach.15
 To determine TV signal reach, we employ the Communication System Planning Tool
(CSPT), which was developed for the U.S. Department of Defense. As an add-on to the
geographic analysis software ArcGIS, the CSPT calculates signal reach using the Longley-Rice
signal propagation model. To consider geographical information for the entire country of West
Germany, we rely on digital maps incorporated in ArcGis version 9.3 with a resolution of 1,000
meters. Thereby, our TV signal calculation takes topographic aspects of the terrain into account,
such as mountains and the Earth’s curvature.
 The signal calculation procedure aims to determine whether or not a TV signal from a
transmitter reached a region in West Germany. For this purpose, we obtained additional digital
maps that allow us to identify the borders of both counties and municipalities in West
Germany.16 We first determine the signal strength for each square kilometer in West Germany.
Then, we aggregate this information at the regional level. We thereby obtain a mean value for
each region, be it a municipality or a county. This average signal strength value allows us to
determine whether individuals in a given region are likely able to watch a certain TV channel
on their TV set.17
 Two technical thresholds are relevant for distinguishing treatment regions with and without
access to terrestrial private TV. The first parameter is the minimum signal strength (dBuV/m)
at which a region is considered to be capable of receiving a TV signal. In our analysis, the
default value is 50 dBuV/m.18 The second parameter is the frequency’s underlying kW power.
In this regard, Bursztyn and Cantoni (2016) consider ERP values of at least 100kW in their
analysis of Western public TV signals in East Germany. Arguably, less powerful frequencies
could only reach East German areas close to the West German border that already had Western
TV on more powerful frequencies. In our case of West Germany, low-power frequencies could
in principle reach households, so we pay special attention to the minimum ERP parameter.
15
 For example, a transmitter station can send out its signal with the exact same strength in all directions or the
signal can be aimed at a certain direction. See Figure D2 for an exemplary antenna pattern of the Wesel frequency
on which RTLplus was broadcast. The signal was mainly directed to the south-east, away from Dutch territory to
the North and West of Wesel, and instead targeting parts of the populated Ruhrgebiet area.
16
 We use the German Federal Agency for Cartography and Geodesy’s oldest available border files from 1997.
17
 We thereby follow Bursztyn and Cantoni’s (2016) procedure. To illustrate the result of this procedure, Figures
D3 and D4 depict maps for the signal reach of the most powerful RTLplus frequency (on the transmitter station
Wesel) at the county and municipality levels. In addition to averaging all cell values within a region, we also
determine the median of all the signal strength values within a region as an alternative measure. Our findings are
insensitive to this decision (Table B1).
18
 As discussed in Appendix B, the main results are robust when using alternative threshold values (Table B2).

 12
Based on the historical records, one could consider 20kW of ERP as a suitable threshold for
defining a powerful and thus relevant frequency, which would be in line with the media
attention paid to NRW’s “juicy” frequencies (see Section 2). According to available technical
documents, the historic media coverage on the case of NRW referred to transmitting stations in
Wesel (200kW) and Düsseldorf (20kW). Given that the power of the latter frequency was below
usual ERP levels of public TV broadcasts, for which most TV antennas in the 1980s were
configured, we inspect how results change as the ERP threshold increases. By excluding
comparatively weaker frequencies, we can ascertain which signals actually did affect TV
consumption during our investigation period.
 Finally, we consider the start information for any private TV channel on each frequency to
establish our longitudinal data on TV signal reach. This dataset includes binary signal variables
for each region and year in our main investigation period from 1987 to 1992, indicating whether
or not a region-year received a private TV signal.19 The information on start dates reveals that
most of the relevant private TV channels with significant power began broadcasting in 1988
after the annual SOEP fieldwork phase, which establishes 1989 as the first post-treatment
year.20

 3.2 The German Socio-Economic Panel (SOEP)
The main data source is Germany’s largest ongoing panel survey: the German Socio-Economic
Panel (Wagner et al. 2007). Since 1984, the organizers of the SOEP investigate the lives of
thousands of people each year to provide representative data for Germany’s adult population.
Fieldwork happens primarily in the first few months of each year when interviewers visit
participating households at the end of winter.21 Prior to the reunification, West Germany had
over 300 counties, each with varying numbers of SOEP participants. To identify the impact of
television on individual outcomes, we combine our longitudinal data on private TV signal reach

19
 We prefer a dummy variable for TV signal reception instead of a linear signal strength. See Appendix B for
more information and sensitivity analyses (Table B3).
20
 Table D1 provides information on private TV frequencies with signals of at least 10kW power in the spring of
1989, reflecting the situation following the annual SOEP fieldwork phase of that year. Based on the broadcast start
dates, SOEP participants in 1989 could be considered treated if they lived in counties reached by private TV
signals, whereas no treatment had occurred when they were interviewed during the 1988 SOEP fieldwork phase.
See Appendix B for a discussion of sensitivity analyses, where we consider 1988 as the first treatment year for a
few cases of SOEP interviewees who were interviewed extremely late. Assigning these latecomers as treated in
both 1988 and 1989 does not change our main results (Table B4).
21
 Given the timing of SOEP interviews, the events surrounding the fall of the Berlin wall in late 1989 have no
bearing in our main analysis from 1987 to 1989. Notably, we focus on West Germany, which in our definition
always excludes (West) Berlin.

 13
with SOEP data at the county-year level.22
 The SOEP provides researchers with subjective self-assessments of the respondents who
report their health (“How satisfied are you with your health?”) and life satisfaction (“How
satisfied are you with your life, all things considered?”). We pay particular attention to these
two variables, which are routinely asked in each SOEP questionnaire with the same question
wording and answer categories. Respondents in the SOEP always assess their satisfaction levels
on a scale ranging from 0 (“completely dissatisfied”) to 10 (“completely satisfied”). To further
examine the implications for individual health, the SOEP includes information on doctor visits
by participants in the three months preceding the interview.23 Another health-specific outcome
variable in the SOEP is the number of hospital stays reported by participants for the entire year
prior to the annual interview. Because this question was not included in the 1990 questionnaire,
we have no information on hospital stays for the crucial year of 1989. This variable is not used
in our main analysis, but we provide supplementary analyses in which we adjust the time
window of our investigation.
 To investigate individual daily time-use changes due to private TV reception, we exploit the
SOEP time-use battery. This survey module contains information about the number of hours an
individual engages per day in different activities, such as childcare (Table D2). Respondents
report the number of hours spent on each activity during a typical workday (including Saturday)
and Sundays. We cumulate the hours reported for the workday multiplied by six and add the
reported hours for Sunday to obtain weekly time-use measures for all activities. Furthermore,
we analyze the time remaining after subtracting the sum of all reported hours spent on all
activities from a 24-hour day and interpret this residual as sleeping time.
 In contrast to recent SOEP waves, the time-use battery contained an item called “Watching
TV, Video” until 1989. We use the responses from this item to establish a manipulation variable
called “TV consumption” based on a broad understanding of television that includes watching

22
 Regional identifiers are available for data users after signing a special agreement with the SOEP organizers.
Regional data analyses are possible via remote access using SOEPremote and on-site at the DIW Berlin. For the
analysis in this paper, we use SOEP version 29 (doi:10.5684/soep.v29). The results are robust when employing a
more recent SOEP version.
23
 In 1988, the question on doctor visits in the SOEP was altered. Before 1988, participants could respond that they
had visited no doctors or different types of doctors (dentist, etc.). Since 1988, the SOEP has aggregated all doctor
visits without distinction between the types of doctors: “Have you visited doctors in the last 3 months? If yes,
please indicate how often.” For the pre-1988 data, we aggregate all cases of different types of doctor visits to
generate a variable that represents the total number of doctor visits. Due to 11 different doctor categories, this
exercise leads to a relatively large number of missing values. Using year fixed-effects, ameliorates this issue. Note
that we also use the binary indicator for having visited any doctor that is not subject to this missing-value issue.

 14
videos. 24 A potential caveat of the time-use information is its hour-based measurement.
Changes of half an hour, for instance, may go unreported. Given the negative views and social
stigma attached to watching TV in Germany, especially during the time of our investigation
(Appendix A), it is possible that individuals chose to stick to their reported hours of TV
consumption from the previous interview and did not increase their self-reports even if they
were watching more due to the sudden availability of commercial TV. We believe that merging
the workday and Sunday information mitigates this issue somewhat, because reporting on
having watched TV on a weekend rather than during the week may be less stigmatizing.
However, we still expect changes in TV consumption to be underreported.25
 Table D2 shows descriptive statistics for the main sample from 1987 to 1989. We expand
this period beyond 1989 to allow for additional reduced-form analyses without the TV
consumption variable (see Section 5.6). To allow for clustering of standard errors at the regional
level, we ensure that our analysis is not affected by individuals moving between regions.
Therefore, we exclude cases in which individuals moved between counties during the
investigation period and require that each person be observed in the same county in which they
lived in 1989. In Appendix B, we discuss this sample restriction and provide robustness
checks.26

 --- Table 1 about here ---

Table 1 shows the characteristics of SOEP respondents across treatment and control regions for
the three years of our main investigation phase. For private TV signals with 20kW power or
higher, there are a few significant differences. For example, we observe that individuals living
in treatment regions appear to be more educated on average than those in control regions (see
left-side columns of Table 1). One could argue that differences of about 0.2 education years are
small and only reach statistical significance due to large sample sizes. Nevertheless, comparing

24
 At the time, Germans mainly used video recorders to watch self-recorded TV shows and movies, if they had
one. According to EVS data, the majority did not own such a device in 1988 (ca. 70% of households).
25
 Self-reported time-use data on TV consumption typically reveal much lower estimates of watching behavior in
comparison to electronic measures for the same population (Frey et al. 2007). In contrast, electronic measures may
result in over-reporting due to individuals who activate the TV in the background while not actively watching or
listening. In Appendix B, we discuss sensitivity analyses for the time-use variable definition, showing that TV
consumption is indeed more heavily affected on Sunday than during the workweek.
26
 Selective relocations are not an issue in the context of our natural experiment on private TV signals via terrestrial
frequencies. This is because of i) the social stigma associated with (private) TV in Germany (see Appendix A),
ii) the uncertainty surrounding private TV on terrestrial frequencies, and iii) the fact that everyone in Germany
could eventually expect to be able to watch private TV. To the best of our knowledge, there has never been a case
of a person moving from one place to another within Germany to watch private TV.

 15
results for TV signals with at least 20kW versus 200kW (see right-side columns of Table 1)
provides a clear picture of which frequencies are more likely exogenous in our setting and hence
more useful as an instrument. The empirical evidence in Table 1 conforms to historical
circumstances documented in the 1980s media coverage (Appendix A), according to which
some low-power frequencies were not used by private TV, albeit being available, due to
politically motivated actions. Randomization is more plausible for a high-powered TV signal
that provided private TV in some regions either by chance or not. While our t-test results in the
last column of Table 1 support this notion, we also acknowledge minor sensitivity concerning
the variable definition and test method, which leads us to be cautious about making strong
claims regarding perfect balancedness.27 We exploit the data’s existing panel structure to ensure
that potential differences in characteristics between individuals living in treatment and control
regions do not affect the results.

 3.3 German Income and Expenditure Sample and Own Survey
In addition to the SOEP, we use the German Income and Expenditure Sample (Einkommens-
und Verbrauchsstichprobe [EVS]) from the late 1980s and early 1990s.28 Every five years, the
German Federal Statistical Office requests detailed income and consumption behavior data
from tens of thousands of representative German households. The data contain a variety of
different expenditure items, including health-related products and services. To investigate
possible differences in behavior due to exposure to private TV signals, we merge the EVS data
with TV signal information at the municipality level. In Appendix C, we describe the process
in detail, including limitations, and discuss the results of a complementary TV signal check, for
which we use information on the number of TV sets in the household.
 We further conducted a representative telephone survey of the German public on the topic
of television in 2015. One goal of this survey was to obtain data from individuals about TV
program content perceptions in Germany and to assess differences between public and private
TV (see Section 6). Another objective of the survey was to gather fresh evidence on the link

27
 Since there are no children in most of the households (see Table D2), we prefer using a dummy variable for
having or not having children in the household in our empirical analysis rather than considering the number of
children. Replacing the former with the latter would yield a statistically significant difference in the last column
of Table 1 for 1987, but only when employing a t-test, not when using a Kruskal-Wallis test as an alternative that
is less susceptible to outlier values. Notably, for the variables in Table 1, the Kruskal-Wallis test generally produces
p-values that are rather similar to those from t-tests, especially for the 200kW instrument.
28
 We rely on data from the 1988 EVS wave (Grundfile 1) and the 1993 EVS wave (Grundfile 7). The Research
Data Center of Germany’s Federal Statistical Office prepared the 1988 dataset specifically for this project to allow
for analyses at the municipality level.

 16
between watching television and well-being. As a complementary analysis, we inspect the
recent associations between self-reported hours of TV consumption and life satisfaction as well
as health satisfaction as the two dependent variables in the next section.

 4. Reproducing Findings From the Literature
 4.1 Model
In a first analysis, we use data from our 2015 survey and the SOEP for a preliminary
correlational inspection. This allows us to juxtapose the evidence based on SOEP data from the
1980s with recent evidence on the association between well-being and TV consumption. We
use the following model to test correlations and also the role of individual fixed-effects:

 FE ℎ (1)

Initially, we employ a simple ordinary least squares (OLS) regression to link TV consumption
to outcomes that reflect individual well-being (i.e. health and life satisfaction). For our survey,
the fixed-effects indicator FE is zero. When we use the SOEP’s longitudinal structure, we
transition to a fixed-effects model with the binary FE set to one to control for individual time-
invariant characteristics.

 4.2 Results
Panel A of Table 2 shows the relationship between TV watching and satisfaction outcomes
from our 2015 survey (see Table D3 for sample statistics). Consistent with the literature, we
find that higher TV consumption is linked to lower health satisfaction and life satisfaction
scores on average. The results imply that zero TV consumption is connected to the highest
satisfaction scores. Adding covariates does not qualitatively change this finding.

 --- Table 2 about here ---

Panel B of Table 2 shows empirical relationships between TV watching and well-being for
SOEP participants in the 1980s that are similar to those in our 2015 survey. Again, more TV
watching hours correlate with reduced life satisfaction and health satisfaction. Furthermore, this
aligns with evidence of increased health problems as captured by doctor visit data. When we
add covariates, the results do not change substantially, but they do when fixed-effects are
included. Only the effect on health satisfaction remains weakly significant, whereas all other

 17
results are inconsistent with the idea that TV viewing has negative effects on well-being. While
this demonstrates the importance of considering time-invariant characteristics when analyzing
differences in health and happiness, our findings also indicate a self-selection phenomenon.
Accordingly, unhappy and unhealthy types of individuals are overrepresented among more
intense TV viewers. Since the endogeneity between TV watching and well-being cannot be
addressed by an even more comprehensive set of covariates, we turn to the private TV signal
from the natural experiment.

 5. Exploiting Exogenous Variation in TV Watching
 5.1 Model
To identify the causal effect of TV on well-being, we exploit differential timing and
geographical occurrence of new TV signals through an instrumental variable (IV) fixed-effects
approach:

 ℎ (2)

 - (3)

In the first stage of our model, we regress TV watching on the private TV signal (2), and in the
reduced form, we use health and happiness indicators as dependent variables (3). To calculate
the local average treatment effect of TV watching on well-being, we only use the exogenous
variation of ℎ from the private TV signal, assuming that the TV signal only affects
well-being through TV watching:

 - ℎ (4)

By employing individual fixed-effects ( , , , we exploit individual changes in private TV
reception, resulting in individuals watching more or less TV. We routinely control for any time
trend in well-being or TV watching using time fixed-effects ( , , . As a further step, adding
covariates to the model allows for a sensitivity check of the results across different
specifications.
 In the following, we conduct first-stage regressions to examine how different definitions of
our instrument affect time-use, before turning to reduced-form and IV results for our main

 18
outcomes. Afterward, we discuss the exclusion restriction underlying the IV analysis and
present the results of several sensitivity analyses.

 5.2 Time-Use
Table 3 shows the manipulation of TV consumption through potential instruments of access to
private TV. In line with historical market shares of German TV channels in the late 1980s,
having the opportunity to watch terrestrial private TV channels increases the time spent
watching TV. This finding is robust when adding covariates in column two. The first definition
of our private TV instrument in row one includes the two big NRW frequencies (see Section 3).
Row two presents the results based on all private TV frequencies, including those with very
low power. Regions with lower kW receptions are excluded from the definition of the
instrument in the rows below. While considering all frequencies shows a significant effect,
varying the kW threshold of frequency power sequentially reveals that more power generally
increases the hours watched from below 0.9 hours per week for all frequencies to more than 1.5
hours per week for the most powerful frequency of 200kW.29 As our preferred instrument, we
focus in the following on the strongest TV signals of 200kW ERP, which not only allows for
the strongest manipulation of TV consumption but is also consistent with our insights from the
above check of balancedness (Section 3.2) and with evidence from the EVS based on TV
ownership as a manipulation variable (Appendix C).

 --- Table 3 about here ---

In Figure 2, we expand our time-use analysis to include other activities. For comparison, we
include TV consumption as part of the seven time-use items, with the residual interpreted as
hours of sleep. We find no changes in the residual, which contradicts the idea that individuals
substitute sleep with increased TV viewing. The same is true for child care, work, training,
repairs, and hobbies. This suggests that respondents differentiate between hobbies and TV
watching since the latter increases significantly. The second significant finding in Figure 2 is
that access to private TV leads to a reduction of about one and a half hours of time spent on

29
 The results of this analysis are similar when we employ the aforementioned month-based instead of year-based
treatment identification for private TV. For this purpose, we redefine the treatment status for SOEP respondents
who lived in treatment counties and were interviewed extraordinarily late in 1988 after the annual fieldwork phase.
Thanks to our longitudinal approach using several waves of SOEP data, we can easily implement this check by
shifting the treatment start from 1989 to 1988 for those few respondents (N=10) who could have started watching
private TV shortly before their 1988 interview.

 19
You can also read