Digital trends in Africa 2021 - Information and communication technology trends and developments in the Africa region 2017-2020 - Toolkit ...
←
→
Page content transcription
If your browser does not render page correctly, please read the page content below
ITUPublications                International Telecommunication Union
Africa

         Digital trends in Africa 2021
         Information and communication    AFRICA

         technology trends and developments
         in the Africa region 2017-2020

Digital trends in Africa 2021
Information and communication
         technology trends and
     developments in the Africa
             region, 2017-2020
Disclaimer

The designations employed and the presentation of the material in this publication do not imply
the expression of any opinion whatsoever on the part of ITU concerning the legal status of any
country, territory, city or area or of its authorities, or concerning the delimitation of its frontiers or
boundaries.

The mention of specific companies or of certain manufacturers’ products does not imply that they
are endorsed or recommended by ITU in preference to others of a similar nature that are not
mentioned. Errors and omissions excepted, the names of proprietary products are distinguished
by initial capital letters.

All reasonable precautions have been taken by ITU to verify the information contained in this
publication. However, the published material is being distributed without warranty of any kind,
either expressed or implied. The responsibility for the interpretation and use of the material lies
with the reader.

The opinions, findings and conclusions expressed in this publication do not necessarily reflect
the views of ITU or its membership.

ISBN

978-92-61-33331-7 (Paper version)
978-92-61-33341-6 (Electronic version)
978-92-61-33351-5 (EPUB version)
978-92-61-33361-4 (Mobi version)

                    Please consider the environment before printing this report.

                                                  © ITU 2021

Some rights reserved. This work is licensed to the public through a Creative Commons Attribution-Non-
Commercial-Share Alike 3.0 IGO license (CC BY-NC-SA 3.0 IGO).

Under the terms of this licence, you may copy, redistribute and adapt the work for non-commercial purposes,
provided the work is appropriately cited. In any use of this work, there should be no suggestion that ITU
endorse any specific organization, products or services. The unauthorized use of the ITU names or logos is
not permitted. If you adapt the work, then you must license your work under the same or equivalent Creative
Commons licence. If you create a translation of this work, you should add the following disclaimer along
with the suggested citation: “This translation was not created by the International Telecommunication Union
(ITU). ITU is not responsible for the content or accuracy of this translation. The original English edition shall
be the binding and authentic edition”. For more information, please visit https://creativecommons.org/
licenses/by-nc-sa/3.0/igo/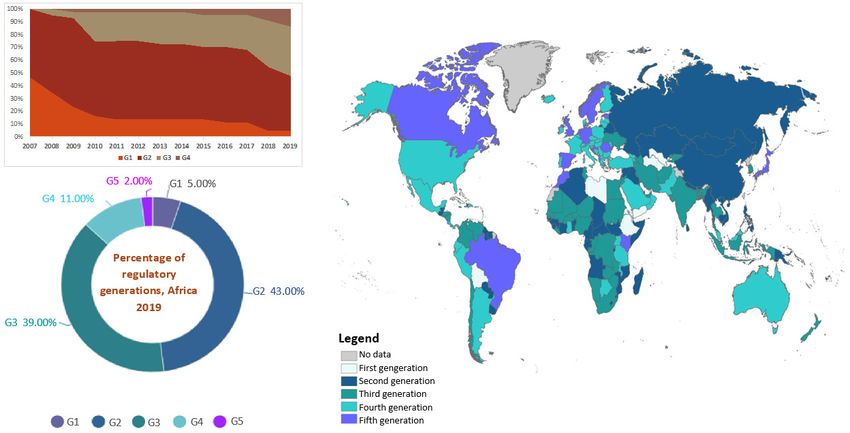
Abstract
This report provides an overview of trends and developments in ICT infrastructure, access
and use in Africa, which includes 44 Member States and is home to a population of
1.04 billion people. The report highlights changes in ICT adoption since the last World
Telecommunication Development Conference in 2017 (WTDC-17) and during the COVID-19
pandemic, tracks the evolution of regulation, and reviews progress and challenges in
implementing the ITU regional initiatives for Africa. Its objective is to serve as a reference
for the ITU membership in reviewing progress and identifying ICT development priorities in
Africa.

                                              iii
Table of Contents
Abstract��������������������������������������������������������������������������������������������������������������������������������������������iii

List of tables and figures�����������������������������������������������������������������������������������������������������������������v

1.	Overview �������������������������������������������������������������������������������������������������������������������������������� 1

2.	     Digital trends in Africa ��������������������������������������������������������������������������������������������������������� 3

        2.1       Mobile market developments����������������������������������������������������������������������������������� 5
        2.2       Fixed broadband market ������������������������������������������������������������������������������������������ 6
        2.3       Internet access, use, skills and gender��������������������������������������������������������������������� 9
        2.4       ICT prices������������������������������������������������������������������������������������������������������������������� 15
        2.5       Developments in cybersecurity ������������������������������������������������������������������������������ 19
        2.6       ICT infrastructure developments and integrated technologies ������������������������� 23
        2.7       Digital services trends���������������������������������������������������������������������������������������������� 28
        2.8       COVID-19 impact on digital development in Africa �������������������������������������������� 33

3.	     Regulatory trends in Africa������������������������������������������������������������������������������������������������� 36

        3.1       New collaborative regulatory paradigm ��������������������������������������������������������������� 37
        3.2       The G5 Benchmark for regulatory excellence������������������������������������������������������� 39
        3.3       Maturity of ICT regulatory frameworks in the Africa region�������������������������������� 41
        3.4 Economic contribution of broadband, digitization and ICT regulation
        in Africa��������������������������������������������������������������������������������������������������������������������������������� 45

4       Opportunities and challenges of digital transformation ����������������������������������������������� 48

        4.1       Developments under the regional initiatives for Africa��������������������������������������� 49
        4.2       Regional initiatives: Areas of challenge����������������������������������������������������������������� 56
        4.3       Regional initiatives: Areas of opportunities����������������������������������������������������������� 58

5.	Conclusion���������������������������������������������������������������������������������������������������������������������������� 62

References������������������������������������������������������������������������������������������������������������������������������������� 64

                                                                          iv
List of tables and figures
Figures

    Figure 1: Global ICT indicators per 100 inhabitants/per cent (where available),
    2019-2020, and compound annual average growth rate (CAGR) (where
    available), 2017-2019, 2017-2020 ������������������������������������������������������������������������������������������� 1
    Figure 2: Accelerating the impact of COVID-19 on digital transformation������������������������ 2
    Figure 3: Key ICT statistics, Africa region, 2017-2020����������������������������������������������������������� 4
    Figure 4: Mobile cellular subscriptions, African countries, 2019 and CAGR (%),
    2015-2019 ���������������������������������������������������������������������������������������������������������������������������������� 5
    Figure 5: Active mobile broadband subscriptions per 100 inhabitants, 42
    African countries, 2019��������������������������������������������������������������������������������������������������������������� 6
    Figure 6: Fixed broadband subscriptions per 100 inhabitants, Africa region, 2019�������� 7
    Figure 7: International bandwidth in selected African countries in kbit/s per
    Internet user, 2019 and CAGR (%) for the period 2015-2019 ��������������������������������������������� 7
    Figure 8: Household access, individuals using the Internet, total and by
    gender, Africa region and the world���������������������������������������������������������������������������������������� 9
    Figure 9: Percentage of individuals using the Internet, Africa region, most
    recent year (2017, 2018 or 2019)�������������������������������������������������������������������������������������������� 10
    Figure 10: Percentage of population in sub-Saharan Africa with a mobile
    Internet subscription, covered by a mobile network but not using the Internet,
    and not covered, 2019; and 2016 and 2019 GSMA Mobile Connectivity Index
    scores������������������������������������������������������������������������������������������������������������������������������������������ 10
    Figure 11: Proportion of households with Internet access, 2019 and CAGR
    2017-2019 ��������������������������������������������������������������������������������������������������������������������������������� 11
    Figure 12: Percentage of individuals using the Internet by gender, Africa
    region, 2019; and for selected African countries, most recent year���������������������������������� 13
    Figure 13: Basic, standard and advanced ICT skills, world, most recent year
    (2017, 2018, or 2019)��������������������������������������������������������������������������������������������������������������� 13
    Figure 14: Basic, standard and advanced ICT skills, selected African countries,
    most recent year (2017, 2018 or 2019)���������������������������������������������������������������������������������� 14
    Figure 15: Mobile-data prices as a percentage of GNI per capita, and monthly
    data allowance, Africa region, 2019��������������������������������������������������������������������������������������� 16
    Figure 16: Fixed-broadband prices as a percentage of GNI p.c., speeds and
    caps, Africa, 2019���������������������������������������������������������������������������������������������������������������������� 17
    Figure 17: Heatmap of national cybersecurity commitment, based on the ITU
    GCI 2018������������������������������������������������������������������������������������������������������������������������������������� 20
    Figure 18: Landscape for AI, IoT and cloud technologies, Africa region������������������������� 24
    Figure 19: Regional distribution of countries by EGDI level, 2016, 2018 and 2020������� 29
    Figure 20: Evolution of the generations of ICT regulation, Africa, 2007-2019���������������� 42
    Figure 21: Economic impact of fixed and mobile broadband and digitization,
    2019��������������������������������������������������������������������������������������������������������������������������������������������� 46
    Figure 22: Regional initiatives - Areas of challenges����������������������������������������������������������� 56

                                                                         v
Figure 23: Regional initiatives - Areas of opportunities������������������������������������������������������ 59

Boxes

   Box 1: International capacity in the Africa region������������������������������������������������������������������� 8
   Box 2: Impediments to meaningful connectivity expansion in the Africa region������������ 11
   Box 3: ITU definition of different ICT skills levels������������������������������������������������������������������ 15
   Box 4: Building massive digital skills in Africa: Example of the Digital
   Transformation Centre (DTC) in Zambia������������������������������������������������������������������������������� 15
   Box 5: Measuring ICT prices at ITU����������������������������������������������������������������������������������������� 18
   Box 6: Possible consideration for the Africa region to address affordability and
   meaningful connectivity ���������������������������������������������������������������������������������������������������������� 19
   Box 7: ITU Global Cybersecurity Index: Africa region – A closer look������������������������������� 21
   Box 8: 5G deployment in Africa��������������������������������������������������������������������������������������������� 27
   Box 9: Enabling digital financial inclusion (DFI): A case of Ethiopia���������������������������������� 29
   Box 10: Digital opportunities around the African Continental Free Trade
   Agreement (AfCFTA) that came into force on 1 January 2021������������������������������������������ 31
   Box 11: Scaling up the Smart Villages initiative in Niger and exploring
   potential for the African continent������������������������������������������������������������������������������������������ 32
   Box 12: Addressing the implications of COVID-19 for the future of young
   people in Africa������������������������������������������������������������������������������������������������������������������������� 35
   Box 13: Collaboration between UN organizations to build back better:
   Ensuring continuity of learning for the most vulnerable children and youth in
   Senegal��������������������������������������������������������������������������������������������������������������������������������������� 36
   Box 14: Collaborative regulation - A forward-looking concept����������������������������������������� 37
   Box 15: ITU G5 Benchmark in a nutshell ������������������������������������������������������������������������������� 40
   Box 16: Voices from the region - Kenya and Uganda on the journey towards
   collaborative regulation����������������������������������������������������������������������������������������������������������� 43
   Box 17: Digital Regulation Handbook and Platform������������������������������������������������������������ 45
   Box 18: COVID-19 Regulatory framework initiatives for the Africa region����������������������� 46
   Box 19: Africa regional initiatives, 2018-2021 – Definition, objectives and
   ongoing projects����������������������������������������������������������������������������������������������������������������������� 50

                                                                      vi
Digital trends in Africa 2021
1. Overview
While COVID-19 has dominated the headlines throughout 2020, the consistent development
and deployment of information and communication technology (ICT) infrastructure and its
concomitant services has meant a continued trend towards digital transformation for societies,
businesses and governments alike. Since the last World Telecommunication Development
Conference in 2017 (WTDC-17), ICTs have continued to spread. ITU data show that, in 2019,
Internet use surpassed the 50 per cent mark (51.4 per cent globally by the end of 2019), 75
per cent of the total world population had an active mobile broadband subscription, and fixed
broadband subscription had grown to just over 15 per cent. Over 57 per cent of households
today have Internet access at home. Moreover, given the increase in demand for data due to
increasingly bandwidth-intensive services, international bandwidth has, on average, grown at a
compound annual growth rate (CAGR) of 36 per cent between 2017 and 2020, with a CAGR for
international bandwidth per Internet user of 26 per cent between 2017 and 2019. Yet the digital
divide persists. While almost all urban areas in the world are covered by a mobile broadband
network, many gaps persist in rural areas. The gender divide remains a reality, with still fewer
women than men benefiting from Internet use (Figure 1).
Figure 1: Global ICT indicators per 100 inhabitants/per cent (where available),
2019-2020, and compound annual average growth rate (CAGR) (where
available), 2017-2019, 2017-2020
15.2 75 51.4%* 48.3 %w / 55.2% m
(+5.7%) (+9.3%) (+3.5%)
Fixed broadband Mobile broadband Inidividuals using the Internet Women and men using the
subscriptions subscriptions Internet
96.7%*
(+0.2%) 72% 37% 57.4 %
(+3.7%)
Mobile network coverage Urban household Internet Rural household Internet Household Internet access
access access
93.1%* 84.7%* 717.9 tbit/s* 131.3 Kbit/s
(+1.9%) (+4%) (+35.7%) (+26.4%)
Percentage of population Percentage of population Total international International bandwidth
within reach of a 3G signal within reach of a 4G signal bandwidth per Internet user
*2020 estimate
Source: Based on ITU WTI Database, 2017, 2019 and 2020, where available
As most countries across the world grapple with the effects of the COVID-19 pandemic, the role
of ICTs and digital services and the digital infrastructure on which these depend has become
central to continued economic and societal activity and to lessening the pandemic’s impact. The
Economic Experts Roundtable organized by ITU in June 20201 concluded that countries with
top connectivity infrastructure could mitigate up to half of the negative economic shock of the
pandemic. Overall, the impact of the pandemic has been to accelerate digital transformation, as
1
The Economic Experts Roundtable was held on 26 June 2020 https://www.itu.int/en/ITU-D/Conferences/
GSR/2020/Pages/default.aspx
1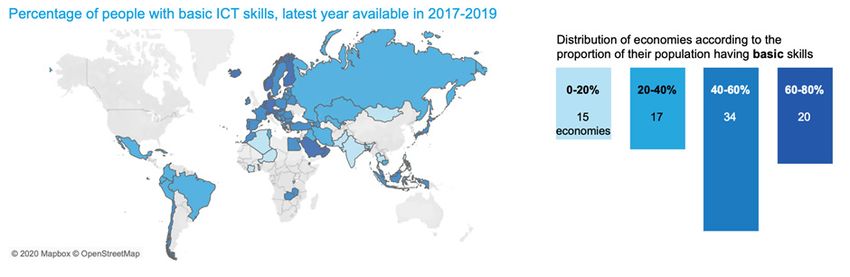
Digital trends in Africa 2021
businesses move towards distributed models of employment and digital delivery of services and
products. Individuals are foregoing travel and socializing and turning to digital entertainment
and communication platforms, and increasingly, to e-commerce. Schools are moving to online
learning and digital classrooms, and governments are increasingly relying on data on citizens,
health, and economic indicators to establish policies.
While research on the contribution of digitization to softening the impact of pandemics is limited,
emerging evidence is compelling about its accelerating effects across all areas of people’s
lives and sectors of the economy. For example, surveys show that the COVID-19 pandemic
has pushed consumers and businesses alike to adopt digital services and technologies, thus
accelerating digital transformation in consumer behaviour and business activity by several years
(Figure 2).
Figure 2: Accelerating the impact of COVID-19 on digital transformation
Consumer surveys show that digital adoption among
consumers has increased at an accelerated pace, varying
by the degree of severity of restrictions imposed in
different localities.
Accelerating impact of COVID-19 on digital transformation
Adoption of digital technologies among enterprises has
accelerated by several years to improve consumer and
supply-chain online interactions as well as internal
operations.
Source: ITU, based on insights from 2020 McKinsey consumer and enterprise surveys at https://www.mckinsey.com/
business-functions/mckinsey-digital/our-insights
Generally, the pandemic has forced a greater demand for digital reliance across the board,
and this outcome is likely to be here to stay in the “new normal”, as the utility of more abundant
data and the ever-lower cost of using those data influence how entrepreneurs, policy-makers
and professionals make decisions. The pandemic, however, is just one driver of current trends.
Climate responsibility, continued economic development, demographic shifts and social well-
being are also key drivers.
In the light of these global trends, policy development that is focused on inclusion, access,
security, skills and sustainability in terms of emerging technologies and their benefits is poised
to become one of the defining characteristics of the 2020s. This is mirrored in the ITU regional
initiatives for Africa and the related ITU-D thematic priorities, which remain highly relevant going
forward.2 Above all, the development of meaningful and affordable connectivity is a key priority
for the region to accelerate digital transformation as a means of achieving better, more inclusive
and human condition enhancing outcomes. This can be achieved through predictable and
sustainable investments and partnerships, fit-for-purpose collaborative policy and regulation,
and targeted demand-side approaches. Another key priority going forward is adequate access
to analogue complements such as electricity in order to reap the benefits of the digital economy.
Artificial intelligence, the Internet of Things, cloud computing, distributed ledger technology,
precision medicine, digital trade, autonomous mobility and many more evolving technological
2
https://www.itu.int/en/ITU-D/Regional-Presence/Africa/Pages/default.aspx
2Digital trends in Africa 2021
arenas will shape the future of the world, including Africa. Africa has the opportunity to set
an example for the world in how to use emerging technologies within targeted local contexts
including in the area of digital payments, precision farming3, predictive health4, and many more,
to address some of its most pressing challenges such as harnessing Africa’s youth dividend
effectively 5 towards sustainable development and inclusive growth.
Ultimately, at the heart of this historical transformation, ICT infrastructure is the predominant
enabler – along with fit-for-purpose policy – of the future competitiveness and prosperity
of Africa. Robust infrastructure on which emerging technologies ride can help meet some
of the continent’s most pressing challenges. It is important not to lose sight of the fact that
improving ICT infrastructure is more than a goal for operators and consumers; far more than
simply facilitating mobile and broadband connections. Improving ICT infrastructure allows for
global and local supply chain integration, the innovative use of critical health information, the
opportunity for citizens to improve their options in the workforce, enables students to gain skill
sets previously unavailable to them, among many more positive externalities that are changing
the course of history. Indeed, it will be history that looks back at this early era of technological
development to see how policies and governance approaches reinforced the resilience and
responsiveness of societies, while assessing risks, protecting consumers and enabling positive
outcomes for citizens.
2. Digital trends in Africa 6
The Africa7 region has a population of 1.04 billion and 44 Member States, including 28 classified
as least developed countries (LDCs), five as small island developing States (SIDS) and fifteen as
landlocked developing countries (LLDCs). It is one of the world’s most challenged regions in
terms of its economic development and socio-economic structure, compounded by ongoing
conflicts and natural disasters and severe structural impediments to sustainable development.
Characteristics of structural impediments differ significantly, including factors such as population
size and density, level of urbanization, access to resources and geography. LLDCs lack direct
access to the sea, which often makes international connectivity more expensive. Many LDCs
are very rural, and others have large, sparsely populated land areas, which makes the roll-out
of terrestrial communication infrastructure more difficult.8 ICT uptake therefore also differs
considerably among economies in the region, and Internet usage rates range from more than
60 per cent in the more developed economies to less than 10 per cent in the region’s least
developed economies.
3
The AI app UjuziKilimo, for instance, is a precision farming app that uses machine learning and data analytics
to help Kenyan farmers optimize their irrigation practices, see: http://www.ujuzikilimo.com/sms.
4
Ubenwa, a Nigerian startup working to detect birth asphyxia, uses inbuilt smartphone microphones and
speech recognition algorithms to identify the condition based on the amplitude and frequency of an infant’s
cry, see http://ubenwa.com/index.html#ove
5
“Harnessing Africa’s Youth Dividend: A new approach for large-scale job creation”, Brookings Institution
6
Mostly 2019 data with some 2020 preliminary data/estimates. Disaggregated data will be reported when
available and relevant (gender, age, rural/urban). Africa averages vs global will be reported when relevant.
7
This document uses the ITU Africa region as defined under ITU country classifications, see: https://www
.itu.int/en/ITU-D/Statistics/Pages/definitions/regions.aspx . Where data were only available for a subset of
countries, this is indicated.
8
For a detailed discussion on key opportunities and challenges for the adoption of ICTs in LDCs, see https://
www.itu.int/en/ITU-D/LDCs/Pages/Publications/LDCs/D-LDC-ICTLDC-2018-PDF-E.pdf
3Digital trends in Africa 2021
Over the last four years, the region has seen continued, albeit slow growth in most areas of ICT
infrastructure, access and use. Mobile cellular coverage in Africa, referring to the percentage
of the population that lives within reach of a mobile cellular signal, is estimated by ITU to be
at 88.4 per cent. Just over 77 per cent of the population is now within reach of a 3G signal,
and 44.3 per cent is within reach of a long-term evolution (LTE) mobile broadband signal. The
percentage of individuals using the Internet increased from 24.8 per cent in 2017 to 28.6 per
cent by the end of 2019, with households that have Internet access at home increasing by 0.1
percentage points from 14.2 per cent in 2017 to 14.3 per cent by the end of 2019. Both fixed
and mobile broadband markets have shown some growth over the last four years, with active
mobile broadband subscriptions outpacing fixed broadband subscriptions. Nevertheless, a
very significant gender gap and a rural/urban divide persist. In 2019, only 20.2 per cent of
women used the Internet, compared with 37.1 per cent of men. Moreover, only 6.3 per cent
of rural households had access to the Internet in 2019, compared with 28 per cent of urban
households (Figure 3). In the 15 to 24-year-old age group, 39.6 per cent used the Internet in
2019, which is higher than the regional average, yet significantly lower than the world average
of 69 per cent (Figure 3).9
Figure 3: Key ICT statistics, Africa region, 2017-2020
Mobile network coverage Internet access and use Digital divide
2017 2020*
88.4% 24.8 28.6
Individuals using % %
2020* 77.4%
the Internet (%)
(2019)
25.5 33.1
Internet access using
mobile broadband per
44.3% 100 inhabitants
0.4 0.5
Internet access using
*Estimate fixed broadband per
100 inhabitants
Household Internet and computer access at home, Internet use by youth (15‐24 years old), 2019
14.3 per cent of households in the 7.7 per cent of households in the Africa 39.6 per cent of 15‐24‐year‐olds
Africa region had Internet access at region had access to a computer at home in the Africa region were using
home in 2019 in 2019 the Internet in 2019
GNI per capita and total investment
In telecommunications
The majority of the countries in the Africa region are low‐income economies. Nigeria is by far the largest telecommunication
While five countries are classified as small developing island States (SIDS) (Cabo market in the region, given its population size.
Verde, Guinea‐Bissau, Mauritius, Sao Tome and Principe, and the Seychelles), 28 ITU data show that total telecommunication
GNI p.c. are classified as least developed countries (LDCs) investments for the region amounted to USD 6.7
According to World Bank data, the average GNI p.c. (Atlas method) of countries billion in 2018, with almost 50 per cent coming
in the region is about USD 1 906, excluding the upper‐middle‐income countries from Nigeria and South Africa.
Mauritius and the Seychelles.*
19 of the 44 countries in the Africa region for which 2019 data were available
had a GNI p.c. of less than USD 1 000.
Only two countries, namely, Mauritius and Seychelles have a GNI p.c. in excess
of USD 10 000.
Countries with the lowest GNI p.c. in the region include Burundi, Malawi and
Namibia.
*ForGNI p.c., countries are selected based on ITU regions, where data are available. Data
used are from 2019. No data were available for Tanzania and Eritrea for 2019.
See:https://databank.worldbank.org/indicator/NY.GNP.PCAP.CD/1ff4a498/Popular‐Indicators
Source: ITU WTI Database and World Bank data (for gross national income (GNI) data)
9
Measuring digital development: Facts and Figures 2020, https://www.itu.int/en/ITU-D/Statistics/Pages/facts/
default.aspx
4Digital trends in Africa 2021
2.1 Mobile market developments
The African mobile market is very diverse, with mobile cellular subscriptions far in excess of
100 per 100 inhabitants in 12 out of 44 countries, namely Seychelles, South Africa, Botswana,
Mauritius, Côte d’Ivoire, Gambia, Gabon, Ghana, Mali, Namibia, Senegal, Cabo Verde and
Kenya. Twenty countries have subscription rates per 100 inhabitants below the African average
of 82.3, while 12 other countries have less than 50 subscriptions per 100 inhabitants (Figure
4). In most countries, mobile cellular subscription rates have increased over the time-period
2015-2019 (see CAGR in Figure 4).
Figure 4: Mobile cellular subscriptions, African countries, 2019 and CAGR
(%), 2015-2019
Number of subscriptions Percent
250 25
20 20
200
15
10
150 7 7 7
6 6 6
5 5 5 5
4 4 4
2 3 2 2
1 2 2 2 2 2 2 2
1 1
0 -1 0 0 0 0
100 -1 -2 -2
-3 -3
-4 -4
-5 -5 -5
-6
-7
-8
-10 -10
50
-15
-17
0 -20
l A E th a r
ba ia
d' s
a
Bu da
ts a
n
Ga ire
Bu Gu a
C ô au r a
G a ia
Ve l
W e
-B e
. o l G la
Pr go
ag er
A s
Gu r ra nin
. R o An i
Gh n
Rw e
c a ia
a a
Sie B e
M Lib di
n
So Eri .
an ica
am ria
M ad
Su a
(R Zam o
S b ia
N in i
Ug h o
Es he)
Le da
Co a
m u
ia
Na ali
e
o
. o ia
ld
bo g a
aw
p
te i t i u
u t lle
M an
ny
Bo fric
c ip
an
rd
rk ine
ea n
oo
qu
ut tre
da
bw
he e
bo
s
ng
Ca issa
Zim iger
b
ep ria go
ep b
fri iop
n
n
Re
c
a d ig
Fa
n d To
or
in Leo
M
at
Ch
an
an
f t uin
o
t
oz e
r
Ca e ne
as
m
ru
i
e
za
ft
So che
so
Ke
w
al
Af
m
M N
er
bi
Iv
in
w
n
in
h
h
y
T
Se
ea
m uat
o
ra
m
ng
nt
D e Eq
To
Co
Ce
o
Sa
Mobile-cellular telephone subscriptions per 100 inhabitants 2019 CAGR 2015 - 2019
Source: Based on the ITU WTI Database, December 2020 edition
African active mobile broadband subscriptions per 100 inhabitants reached 33.1 in 2019, trailing
far behind the world average of 75 per 100 inhabitants. While just over one sixth of countries in
the Africa region, including South Africa, Ghana, Gabon, Seychelles, Botswana, Mauritius and
Cabo Verde, had active mobile broadband subscription rates per 100 inhabitants above the
world average, almost half of all countries for which data were available had subscription rates
below the African average of 33.1 per 100 inhabitants (Figure 5).
5Digital trends in Africa 2021
Figure 5: Active mobile broadband subscriptions per 100 inhabitants, 42
African countries, 2019
Source: Based on ITU WTI Database, *2020 estimates
2.2 Fixed broadband market
Compared with other regions, Africa has one of the lowest fixed broadband subscription
rates, given the absence of legacy infrastructure and the relatively lower costs of deploying
wireless broadband infrastructure. ITU estimated a fixed broadband subscription rate of 0.5
per 100 inhabitants for Africa in 2020, a figure that is well below the global average of 15.2
subscriptions per 100 inhabitants. Yet fixed broadband subscriptions per 100 inhabitants have
increased across most countries for which data were available. Within the region, two-thirds of
the countries slightly increased their fixed broadband subscription rates in the period 2018-
2019. Just under one-third of countries show declining subscription rates for the same period.
Seychelles and Mauritius are two significant outliers, with fixed broadband subscription rates
per 100 inhabitants well above the world average, recording sizable increases for the period
2018-2019 (Figure 6).
The availability of international bandwidth continues to be an important area for policy and
investment, especially given the rising amount of data-intensive applications, cloud-based
services and the increasing numbers of Internet users desiring better international connectivity.
The Africa region is lagging far behind other regions with regard to international bandwidth
at the aggregate and individual levels. Although the total international bandwidth across the
region has more than doubled over the last four years from 5 Tbit/s in 2017 to 11 Tbit/s in
2020, it represents only 1.5 per cent of the total world international bandwidth. At the individual
user level, there were 30.8 kbit/s per Internet user in the Africa region in 2019, compared with
131.3 kbit/s per Internet user globally (see Box 1 for an overview of international capacity in
the Africa region).
At the country level, international bandwidth per Internet user has increased across almost all
the countries in the region, where data were available. Kenya had the highest international
bandwidth per Internet user, with 566.41 kbit/s and a CAGR of 52 per cent for the period 2015-
2019. Just over one-third of the countries shown in Figure 7 had CAGRs in excess of 40 per cent,
including Sao Tome and Principe, Benin, Botswana, Burundi, Ghana, Togo, Zambia, Namibia,
Nigeria, Zimbabwe, Angola, Mozambique, Mali, the Central African Republic and Liberia. Over
6Digital trends in Africa 2021
Figure 6: Fixed broadband subscriptions per 100 inhabitants, Africa region,
2019
4
3.5
Significant outliers with fixed broadband subscription rates above the world average
include: Seychelles with 20.3 and Mauritius with 21.7 subscriptions per 100
inhabitants
3
2.5
2
1.5
1
0.5
0
Gu Rw car
Ce . o Bu ria
Ta frica
l G na
n
A a
Pr ire
e a d al
M Le s la
Na rde
To Cô Se n a
An go
to G ia
ba n
lA C i
Ke n
G a n in
i n wi
h ea
Ga e
e
So tsw ia
Za ica
So Gu p.
am ho
ad
Ni so
m ia
ag a
-B a
Bu Ma u
Be e
Af i
a
ca go
ra he nd
al
ut a n
ny
c ip
ea d
o
qu
ad ine
da
bw
bi
bo
a
go
b
m te eg
Bo ib
Ca an
Re
Fa
rk la
To
M
ria ha
u t in
Ch
in an
fri on
Zim ero
ge
iss
nd 'Ivo
oz ot
r
as
m
nt f t ru
m
Ve
Su
m
bi
in
nz
M u
n
a
h
bo
Ca
ua
ep
Eq
.R
m
o
Sa
De
Fixed broadband subscriptions per 100 inhabitants 2018 Fixed broadband subscriptions per 100 inhabitants 2019
Source: ITU, based on ITU WTI Database
the same period, just under one-third of countries grew their international bandwidth per
Internet user between 20 and 40 per cent. Few countries, including South Sudan, Ethiopia,
Niger, Senegal, Eswatini, South Africa, Gabon, Sierra Leone, Gambia and Cabo Verde (Figure
7) experienced small or no growth (CAGR below 10 per cent or negative).
Figure 7: International bandwidth in selected African countries in kbit/s per
Internet user, 2019 and CAGR (%) for the period 2015-2019
Kbit/s Percent
140 600
Kenya, 544.41
Kbit/s (+52%) 554
120 500
100 400
318 311
80 300
60 200
128
40 110 100
83 92
69 68
53 57 48
39 40 31 43 41 35 31 39
29 32 33 28
15 20 15 20 22 14 14 20
20 6 0 9 7 3 0
‐4 ‐4 ‐7 ‐10
‐17
‐30
0 ‐100
Kbit/s per Internet user 2019 CAGR 2015 ‐ 2019
Source: ITU, based on the ITU WTI Database
7Digital trends in Africa 2021
Box 1: International capacity in the Africa region
To ensure that the Africa region, as one of the most important future global growth
markets, is embracing digital transformation and that it has adequate connectivity,
expanding international connectivity via submarine cables, international fibre and
satellite is key. The figure below shows that by the end of 2019, 28 African ITU Member
States had, at least, one submarine cable landing1. Fifteen ITU Member States in the
region are landlocked and have to rely on either satellite or international fibre link
capacity. The figure also shows that approximately 45 per cent of Africa’s population
is more than 10 km away from fibre network infrastructure.2
Source: https://www.submarinenetworks.com/en/africa; https://blogs.worldbank.org/digital-development/
africas-connectivity-gap-can-map-tell-story
Satellite broadband connectivity offers a good alternative, with the possibility to
provide coverage everywhere, including the remote parts of the region. It therefore
may offer an effective means to close the digital divide and address remaining
connectivity gaps. While progress has been made, challenges persist with regard to
the cost of infrastructure.3 ITU data for satellite broadband subscriptions4 were only
available for 19 countries, with the biggest markets including Tanzania, Zimbabwe,
Nigeria, South Africa and Kenya.
Source: ITU WTI Database 2020, https://www.submarinenetworks.com/en/africa; https://blogs.worldbank
.org/digital-development/africas-connectivity-gap-can-map-tell-story; https://africanews.space/oneweb
-and-sky-space-failure-the-effect-on-satellite-broadband-connectivity-in-africa/
1
https://www.submarinenetworks.com/en/africa
2
https://blogs.worldbank.org/digital-development/africas-connectivity-gap-can-map-tell-story -
the map visualizes fibre infrastructure in Africa and population density, showing unserved regions.
Total population is estimated for each 10 000 km2 hexagon; those with populations below 100
000 are excluded. Source: Network Startup Resource Center, TeleGeography and European
Commission.
3
https://africanews.space/oneweb-and-sky-space-failure-the-effect-on-satellite-broadband
-connectivity-in-africa/
4
Satellite broadband subscriptions refers to the number of satellite Internet subscriptions with an
advertised download speed of at least 256 kbit/s. It refers to the retail subscription technology
and not the backbone.
8Digital trends in Africa 2021
2.3 Internet access, use, skills and gender
ITU estimated that 14.3 per cent of households in the Africa region had Internet access in 2019,
compared with 57.4 per cent globally. The proportion of individuals using the Internet in 2019
totalled 28.6 per cent in Africa10 and 51.4 per cent globally (Figure 8), highlighting the need to
bring more people in Africa online.
Figure 8: Household access, individuals using the Internet, total and by gender,
Africa region and the world
Source: Based on ITU WTI Database.
ITU data show that the percentage of individuals using the Internet greatly varies across the
Africa region (Figure 9). In four countries, namely Mauritius, Cabo Verde, Seychelles and South
Africa, the proportion of individual Internet users (for the most recent year) was above the
world average of 51.4 per cent. In most countries, individual Internet use is below 30 per cent
(Figure 9).
According to GSMA, lack of infrastructure is not the main reason for the relatively low numbers
of individuals using the Internet. The much bigger gap is associated with individuals living in
areas covered by a mobile network, but not using the Internet. At the end of 2019, 272 million
people were connected to the mobile Internet across sub-Saharan Africa, while 800 million
were still offline, mainly because of the high cost of smartphones, relative to average income
levels, and limited digital skills among rural and less literate populations.11 In addition, the
Alliance of Affordable Internet (A4AI) has identified lack of quality of access, which it has termed
“meaningful connectivity”12, as one key reason why people are not using the Internet. While the
GSMA Mobile Connectivity Index shows that infrastructure has seen the biggest improvement
in sub-Saharan Africa, alongside modest increases across all other categories over the period
2016-2019 (Figure 10), more needs to be done to ensure that access to meaningful connectivity
can be achieved to close the usage gap.
10
The figure for Internet use in 2020 and 2021 is likely higher than ITU’s estimation, firstly, because many
countries do not conduct regular surveys, and secondly, because more people are accessing the Internet
during the COVID-19 crisis, as they are forced to stay at home during lockdowns.
11
https://www.gsma.com/mobileeconomy/wp-content/uploads/2020/09/GSMA_MobileEconomy2020_SSA
_Eng.pdf
12
https://a4ai.org/meaningful-connectivity/
9Digital trends in Africa 2021
Figure 9: Percentage of individuals using the Internet, Africa region, most
recent year (2017, 2018 or 2019)
70
64
62
60 59
56
50
50
41
40 38 37
36
30 30 30 30
30 27 26
26
24 23 23
22 22 21
20 19
20
16 16
14 14 14 14 13
13 12
10 9 9 8 8
6
5 4 4 3
1
0
V s
G ca
to ba l
Af s
e a Es ire
E t bi a
n
Gu ica ger
e
ts n
Za la
Le ipe
n
Le i
. o . o go
Er di
Pr tini
Se ho
M Rw ea
Bu anz ia
Ke n
An so
h ia
-B .
ea
l G we
ad
d' ia
Ni ea
Ug ria
am da
Co )
Bu sau
Na ana
m da
in ia
Ga ue
i
So Lib o
Gh a
Gu ya
So che e
Be a
ua im ga
ra w
al
ea ep
he he
bo tiu
ut lle
oo
on
an
da
ni
Bo abo
bi
ng
y d
go
ut er
T op
te ib
n
rk an
ri
Fa
er ala
ep ep o
itr
n
in
M
Ch
n
oz a n
q
o
Ca an
Se er
t
ge
Eq Z ne
m
ria b
c
in n R
ru
m
ft ft
i
nd wa
so
is
C a u ri
ui
Su
w
Cô m
T
er
N
bi
Iv
in
hi
a
M
h
a
M
fr
. R (R
Si
lA
m go
ra
m
nt
De on
To
Ce
C
o
Sa
Source: ITU, based on the ITU WTI Database. Data for 2019 were available for Mauritius, Cabo Verde, Côte d’Ivoire
and Kenya; and data for 2018 were available for Guinea, Zambia and Niger. For all other countries, the latest available
data were for 2017 (except for Nigeria, where the most recent year was 2016).
Figure 10: Percentage of population in sub-Saharan Africa with a mobile
Internet subscription, covered by a mobile network but not using the Internet,
and not covered, 2019; and 2016 and 2019 GSMA Mobile Connectivity Index
scores
Source: GSMA The Mobile Economy 2020, sub-Saharan Africa
In terms of households with Internet access, the Africa region shows significant variation: while
six countries, namely Mauritius, Cabo Verde, Botswana Gambia, South Africa and the Seychelles
lead the region at estimated rates of home access above the world average of 57.4 per cent,
most countries have very low home access rates of less than 20 per cent, with 14 countries
having a rate of below 10 per cent (Figure 11).
10Digital trends in Africa 2021
Figure 11: Proportion of households with Internet access, 2019 and CAGR
2017-2019
80
73
70
70
63 63
62
60 58
50
41
40 37
35
30
30 27 26
22 22
20
20 18 18 18 17 17
14 14 13
13 13
11 11 11 10
10 9 9
10 8 7
5 4 3 3 3 3 2 2 1 0
0
V s
. o E sa u
yc c a
Et ipe
n
h ia
M da
G a es
M A n so
l G da
o ca ad
ts e
Es we
a
e m a
d' ali
N i
Ke ia
Za ya
Gu L he)
to w r
Bu G u a r
am ola
ba ia
So B al
Le on
Sie anz re
Pr n
Ni ea
Bu g o
To i
h in
i
Na tho
G o
in a
Ug ue
-B a
M a Le a
Se ria
. o p.
Co a
ag e
So Gam a
w
tin
nd
ua R ige
bo tiu
m Ca han
rr ani
bi
an
rk ine
B o e rd
d oo
ad o n
da
he re
e a ri
g
ut b
op
g
Zim mib
ut en
ep R e
c
ll
T i
S e A fr i
Fa
te M
ala
n
n
n g f ri C h
ria an
an
n
b
ge
q
i n ib e
Ivo
ne
b
m
c
as
oz g
wa
ft
he
ru
f t rit
is
so
Ca uri
ui
w
Su
bi
an er
in
hi
a
(R n
a
M
Cô
Co al A
ep
r
nt
Eq
To
.R
Ce
o
m
Sa
De
Source: ITU
Box 2: Impediments to meaningful connectivity expansion in the Africa
region
To ensure that access to meaningful and affordable connectivity can be achieved
across the Africa region, a number of impediments have to be overcome. These
include improvements to international connectivity (see Box 1), domestic connectivity /
access to backbone networks, as well as the last mile. This requires developing Internet
exchange points (IXPs) to ensure that connectivity is efficient, and content is routed
domestically. It also requires the building of data centres to ensure that content can
be stored locally, and ensuring access to ancillary or analogue complements such as
affordable electricity.
Access to reliable and affordable electricity is a major constraint, especially in the
28 LDCs in the Africa region. The ITU Report “ICTs, LDCs and the SDGs - Achieving
universal and affordable Internet in the least developed countries” describes how lack
of electricity results in higher costs of Internet access through, for example, having to
use diesel generators to power mobile base stations, or requiring users in rural areas
to travel to recharge their devices. The figure below shows that almost all the African
LDCs are below the LDC average in terms of the percentage of the population with
access to electricity.
11Digital trends in Africa 2021
Access to electricity (% of population), 2014 LDC average
100
90
80
70
60
50
40
30
20
10
0
Niger
Bhutan
Togo
Guinea‐Bissau
Madagascar
Chad
Tuvalu
Yemen
Bangladesh
Senegal
Djibouti
Timor‐Leste
Vanuatu
Angola
Zambia
Lesotho
Uganda
Afghanistan
Comoros
Sao Tome and Principe
Rwanda
Central African Rep.
Liberia
Burundi
Myanmar
Kiribati
Gambia
Eritrea
Mauritania
Haiti
Solomon Islands
Guinea
Mali
Ethiopia
Somalia
Sierra Leone
Benin
Mozambique
Tanzania
Malawi
South Sudan
Sudan
Nepal (Republic of)
Burkina Faso
Cambodia
Dem. Rep. of the Congo
Lao P.D.R.
Source: ITU Report “ICTs, LDCs and the SDGs - Achieving universal and affordable Internet in the least
developed countries”
Access to national and regional backbones
Backbone infrastructure is crucial for broadband infrastructure. LDCs are facing
significant challenges, particularly underserved areas. The ITU Report “ICTs, LDCs
and the SDGs - Achieving universal and affordable Internet in the least developed
countries” found that while wireless backbones based on microwave or satellite offer
faster roll-out at lower cost and sometimes are the only option where the cost of
extending fibre is too high, optical fibre backbones provide future-proof capacity
that can handle large volumes of traffic. This is particularly relevant in the context
of the COVID-19 pandemic, where increased traffic has led to network congestion
and degradation of quality of experience. It is also relevant in the context of the
growing number of data-intensive applications, cloud-based services and the
increasing numbers of Internet users desiring better international connectivity. Three
successful examples of middle-mile advancements include (1) the national backbone
development in Senegal, (2) Tanzania’s ICT Broadband Backbone for National and
Regional Connectivity and (3) the Burundi Backbone System.
Source: ITU Report “ICTs, LDCs and the SDGs - Achieving universal and affordable Internet in the least
developed countries”
In terms of the digital divide, there is still a significant gender gap in the Africa region, one of
the largest globally. While, on average, 20 per cent of women and 37 per cent of men used the
Internet in the region in 2019, globally 48.3 per cent of women and 55.2 per cent of men used
the Internet that year. Based on the limited data available for selected countries (Figure 12), the
12Digital trends in Africa 2021
gender divide is significant, with percentage differences of up to 14 per cent in Guinea. This
divide is least pronounced in Cabo Verde and Zambia.
Figure 12: Percentage of individuals using the Internet by gender, Africa
region, 2019; and for selected African countries, most recent year
Inidividuals using the Internet by gender (%), Africa region and selected African countries, 2019-2020
Country Men Women
Cabo Verde 62.9 61
2019 33.8% 22.6% Côte d’Ivoire 39.8 32.9
Guinea 29.4 15.4
Kenya 25.1 20.1
2020 37% 20% Tanzania 19 8
Togo 16.8 8.6
Zambia 15.5 13.2
Mozambique 9.6 6.1
Source: Based on ITU Facts and Figure 2019 and 202013; and on the ITU WTI Database, December 2020. Data for
2019 were used for Cabo Verde and Côte d’Ivoire; 2018 data were used for Guinea and Zambia; 2017 data were used
for Mozambique, Niger and Togo; and 2016 data were used for Tanzania.
The data available on the levels reached in basic, standard and advanced ICT skills for the
Africa region are very limited. However, it is clear that a significant skills gap exists (Figure 13).
To enable a better understanding and targeting of future initiatives to address the skills gap
effectively, more data need to be collected.
Figure 13: Basic, standard and advanced ICT skills, world, most recent year
(2017, 2018, or 2019)
13
https://www.itu.int/en/ITU-D/Statistics/Pages/facts/default.aspx
13Digital trends in Africa 2021
Source: ITU Facts and Figures, 2020
For the five countries for which data were available, skills levels differ, with Cabo Verde, Côte
d’Ivoire and Zambia showing basic skills levels above 10 per cent. Zambia is the most advanced,
with a basic skills level of 43.6 per cent, a standard skills level of 25.2 per cent and an advanced
skills level of 6.6 per cent (Figure 14). Box 3 provides an overview of the ITU definition of different
ICT skills levels. Box 4 showcases an example of the ITU Digital Transformation Centre (DTC) in
Zambia, the main purpose of which is to develop digital skills at basic and intermediate levels
for citizens.
Figure 14: Basic, standard and advanced ICT skills, selected African countries,
most recent year (2017, 2018 or 2019)
Source: Based on ITU WTI Database
14Digital trends in Africa 2021
Box 3: ITU definition of different ICT skills levels
For each economy, the value for basic skills is the average value of the available
recent data for the following four computer-based activities: copying or moving a
file or folder; using copy and paste tools to duplicate or move information within
a document; sending e-mails with attached files; and transferring files between a
computer and other devices.
The value for standard skills is the average value of the available recent data for
the following four computer-based activities: using basic arithmetic formula in a
spreadsheet; connecting and installing new devices; creating electronic presentations
with presentation software; and finding, downloading, installing and configuring
software.
The value for advanced skills is the value for writing a computer program using a
specialized programming language.
Source: ITU
Box 4: Building massive digital skills in Africa: Example of the Digital
Transformation Centre (DTC) in Zambia
The ITU Digital Transformation Centres (DTC) initiative seeks to create a global network
of centres to help develop digital skills mainly at basic and intermediate levels for
citizens. The initiative contributes to the broader goal of building an inclusive digital
society and ensuring that lack of knowledge and skills is not a barrier to participation
in the digital economy.
In Zambia, The Smart Zambia Institute (SZI), selected as one of four ITU Digital
Transformation Centres in Africa to participate in the initiative, celebrated the
completion of equipping 72 master trainers with digital skills at basic and intermediate
levels. The training was delivered by Cisco under the auspices of the ITU DTC Initiative
and conducted online due to the COVID-19 pandemic. Master trainers will transfer the
skills and knowledge to the citizenry, school teachers and public service employees.
The results will foster and ensure progression towards the transformation of Zambia
into a digitally literate society, thus meeting the expectations of the 2030 vision.
Source: ITU Academy
2.4 ICT prices
ITU data show that telecommunication and ICT services are becoming more affordable and
prices have generally followed a downward trend over the last four years across the world,
including for mobile-voice, mobile-data and fixed-broadband services. At the regional level,
Africa has the least affordable prices, closely followed by the Arab States region. The ITU report
15Digital trends in Africa 2021
“Measuring Digital Development: ICT Price Trends 2019”14 provides a detailed examination
and discussion of ICT price trends.
In Africa, the most affordable mobile broadband baskets are available in Mauritius and Gabon,
the only two countries with a basket below the Broadband Commission target of 2 per cent.
In the next three countries, Seychelles, Nigeria and Botswana, prices accounted for between 2
and 3 per cent of gross national income per capita (GNI p.c.), suggesting that there is a good
chance that the Broadband Commission target may be reached in these countries by 2023. In
many African countries however, mobile-data baskets are still out of reach for a large part of the
population, costing more than 10 per cent of GNI p.c., in situations where incomes are already
limited. In eight out of 10 African countries, the data allowance included in the cheapest price
(with at least 1.5 GB) did not exceed 2 GB. The highest allowance for this price is observed in
Botswana and the Democratic Republic of the Congo, although in the Democratic Republic of
the Congo the service remains prohibitively expensive.
Figure 15: Mobile-data prices as a percentage of GNI per capita, and monthly
data allowance, Africa region, 2019
70
5 GB
60
2% UN Broadband
50
As a % of GNI p.c.
Commission affordability
target
40
4 GB
1.8 GB
1.5 GB
1.5 GB
2 GB
2 GB
30
2 GB
1.7 GB
3 GB
2 GB
2 GB
2 GB
20
1.5 GB
2 GB
2 GB
1.5 GB
2 GB
1.5 GB
1.5 GB
1.6 GB
2.5 GB
2 GB
2 GB
1.5 GB
1.5 GB
2 GB
1.5 GB
1.5 GB
1.5 GB
2.9 GB
2.5 GB
3 GB
2 GB
1.5 GB
1.7 GB
2 GB
5 GB
10
2 GB
2 GB
0
Namibia
Sierra Leone
Senegal
Niger
Cameroon
Malawi
Guinea‐Bissau
Gabon
Seychelles
Kenya
Eswatini
Benin
Rwanda
Mali
Central African Rep.
Chad
Mauritius
Nigeria
South Africa
Gambia
Uganda
Guinea
Ghana
Angola
Sao Tome and Principe
Liberia
Ethiopia
Botswana
Cabo Verde
Zambia
Tanzania
Lesotho
Togo
Dem. Rep. of the Congo
Côte d'Ivoire
Mozambique
Congo (Rep. of the)
Burkina Faso
Burundi
Madagascar
Source: ITU, adapted from “Measuring Digital Development, ICT Price Trends 2019”
In terms of affordability of fixed services, Africa is the region with the highest fixed-broadband
basket prices as a percentage of GNI p.c., compared with other regions. Fixed-broadband
prices in Africa range from a cost representing less than 2 per cent of GNI p.c. in the Seychelles
and Mauritius, to over 100 per cent in Malawi, Rwanda, Niger, Madagascar and Burundi. As
such, those first two countries are the only African countries to have achieved the Broadband
Commission target for 2025. Almost half of the countries in the region offer entry-level fixed-
broadband plans with capped monthly data allowances. This allows operators to offer plans at
a reduced cost, but the implication for users is that they are limited in their use of the Internet.
In addition, in about half of the countries, entry-level fixed-broadband speeds are only provided
between 256 kbit/s and 2 Mbit/s, reducing significantly the usefulness of Internet access. Low
bandwidth will prevent meaningful use of many applications, which in turn will have a negative
impact on the development of a digital economy. In six of the countries for which data are
14
https://www.itu.int/en/mediacentre/Pages/pr08-2020-Measuring-Digital-Development-ICT-Price-Trends
-2019.aspx
16Digital trends in Africa 2021
available, speeds are 10 Mbit/s or above, although in two of those countries that package is
unaffordable for most of the population.
Figure 16: Fixed-broadband prices as a percentage of GNI p.c., speeds and
caps, Africa, 2019
2% UN Broadband
Commission affordability
target
Source: ITU, adapted from “Measuring Digital Development, ICT Price Trends 2019”
Box 5 provides an overview of how ITU measures ICT prices. Box 6 provides possible
considerations for the Africa region to address affordability and meaningful connectivity.
17Digital trends in Africa 2021
Box 5: Measuring ICT prices at ITU
ITU and its partners and stakeholders devote considerable time and effort to
developing and refining price methodologies, in particular through the Expert Group
on Telecommunication/ICT Indicators (EGTI). ITU maintains a set of different price
baskets to reflect different usage patterns and behaviours. In 2017, ITU updated and
adjusted its price baskets to reflect current developments in the fixed and mobile
broadband markets. The price baskets cover three different technologies: mobile
voice, mobile data and fixed broadband.
In addition, the 2017 revision introduced combined data-and-voice baskets, as a
first attempt to monitor the prices of bundled services, which is now a very common
commercial practice.
The ITU mobile-data-and-voice baskets include voice, text messages and data for two
different consumption levels. The low-consumption mobile-data-and-voice basket
includes 70 voice minutes, 20 SMSs and 500 MB of broadband data, while the high
consumption mobile-data-and-voice basket includes 140 voice minutes, 70 SMSs and
1.5 GB of broadband data.
Source: From ITU, “Measuring Digital Development, ICT Price Trends, 2019”
18You can also read