A Survey on Bias in Visual Datasets
←
→
Page content transcription
If your browser does not render page correctly, please read the page content below
A Survey on Bias in Visual Datasets
                                              Simone Fabbrizzi1 , Symeon Papadopoulos1 , Eirini Ntoutsi2 , and Ioannis
                                                                          Kompatsiaris1
                                                                     1
                                                                         CERTH-ITI, Thessaloniki, Greece
                                                                     2
                                                                         Freie Universität, Berlin, Germany

                                                                                        Abstract
arXiv:2107.07919v1 [cs.CV] 16 Jul 2021

                                                  Computer Vision (CV) has achieved remarkable results, outperforming humans in sev-
                                              eral tasks. Nonetheless, it may result in major discrimination if not dealt with proper
                                              care. CV systems highly depend on the data they are fed with and can learn and am-
                                              plify biases within such data. Thus, both the problems of understanding and discovering
                                              biases are of utmost importance. Yet, to date there is no comprehensive survey on bias
                                              in visual datasets. To this end, this work aims to: i) describe the biases that can affect
                                              visual datasets; ii) review the literature on methods for bias discovery and quantification
                                              in visual datasets; iii) discuss existing attempts to collect bias-aware visual datasets. A key
                                              conclusion of our study is that the problem of bias discovery and quantification in visual
                                              datasets is still open and there is room for improvement in terms of both methods and
                                              the range of biases that can be addressed; moreover, there is no such thing as a bias-free
                                              dataset, so scientists and practitioners must become aware of the biases in their datasets
                                              and make them explicit. To this end, we propose a checklist that can be used to spot
                                              different types of bias during visual dataset collection.

                                         1    Introduction
                                         In the fields of Artificial Intelligence (AI), Algorithmic Fairness and (Big) Data Ethics, the
                                         term bias has many different meanings: it might refer to a statistically biased estimator, to
                                         a systematic error in a prediction, to a disparity among demographic groups, or even to an
                                         undesired causal relationship between a protected attribute and another feature. Ntoutsi et
                                         al. [64] define bias as “the inclination or prejudice of a decision made by an AI system which
                                         is for or against one person or group, especially in a way considered to be unfair ”, but also
                                         identify several ways in which bias is encoded in the data (e.g. via spurious correlations, causal
                                         relationship among the variables, and unrepresentative data samples). The aim of this work
                                         is to provide the reader with a survey on the latter problem in the context of visual data (i.e.
                                         images and videos).
                                             Thanks to Deep Learning technology, Computer Vision (CV) gained unprecedented momen-
                                         tum and reached performance levels that were unimaginable before. For example, in tasks like
                                         object detection, image classification and image segmentation, CV achieves great results and
                                         sometimes even outperforms humans (e.g. in object classification tasks). Nonetheless, visual
                                         data, which CV relies heavily on for both training and evaluation, remain a challenging data
                                         type to analyse. An image encapsulates many features that require human interpretation and
                                         context to make sense. These include: the human subjects, the way they are depicted and their
                                         reciprocal position in the image frame, implicit references to culture-specific notions and back-
                                         ground knowledge, etc. Even the colouring scheme can be used to convey different messages.
                                         Thus, making sense of visual content remains a very complex task.
                                             Furthermore, CV has recently drawn attention because of its ethical implications when de-
                                         ployed in a number of application settings, ranging from targeted advertising to law enforcement.
                                         There has been mounting evidence that deploying CV systems without a comprehensive ethical
                                         assessment may result in major discrimination against minorities and protected groups. Indeed,

                                                                                            1
facial recognition technologies [68], gender classification algorithms [11], and even autonomous
driving systems [84] have been shown to exhibit discriminatory behaviour.
While bias in AI systems is a well studied field, the research in biased CV is more limited
despite the widespread analysis on image data in the ML community and the abundance of visual
data produced nowadays. Moreover, to the best of our knowledge, there is no comprehensive
survey on bias in visual datasets ([78] represents a seminal work in the field, but it is limited to
object detection datasets). Hence, the contributions of the present work are: i) to explore and
discuss the different types of bias that arise in different visual datasets; ii) to systematically
review the work that the CV community has done so far for addressing and measuring bias in
visual datasets; and iii) to discuss some attempts to compile bias-aware datasets. We believe
this work to be a useful tool for helping scientists and practitioners to both develop new bias-
discovery methods and to collect data as less biased as possible. To this end, we propose a
checklist that can be used to spot the different types of bias that can enter the data during the
collection process (Table 6).
The structure of the survey is as follows. First, we provide some background about bias
in AI systems, and the life cycle of visual content and how biases can enter at different steps
of this cycle (Section 2). Second, we describe in detail the different types of bias that might
affect visual datasets (Section 3) and we provide concrete examples of CV applications that
are affected by those biases. Third, we systematically review the methods for bias discovery in
visual content proposed in the literature and provide for each of them a brief summary (Section
4). We also outline future streams of research based on our review. Finally, in Section 5, we
discuss weaknesses and strengths of some bias-aware visual benchmark datasets.
2 Background
In this section, we provide some background knowledge on bias in AI systems (Section 2.1) and,
describe how different types of bias appear during the life cycle of visual content (Section 2.2).
2.1 Bias in AI Systems
In the field of AI ethics, bias is the prejudice of an automated decision system towards in-
dividuals or groups of people on the basis of protected attributes like gender, race, age, etc.
[64]. Instances of this prejudice have caused discrimination in many fields, including recidivism
scoring [1], online advertisement [75], gender classification [11], and credit scoring [7].
While algorithms may also be responsible for the amplification of pre-existing biases in the
training data [8], the quality of the data itself contributes significantly to the development of
discriminatory AI applications, such as those mentioned above. Ntoutsi et al. [64] identified
two ways in which bias is encoded in the data: correlations and causal influences among the
protected attributes and other features; and the lack of representation of protected groups in
the data. They also noted that bias can manifest in ways that are specific to the data type. In
Section 2.2, and in more detail in Section 3, we explore bias specifically for visual data.
Furthermore, it is important to note that defining the concepts of bias and fairness in
mathematical terms is not a trivial task. Indeed, Verma & Rubin [80] provide a survey on
more than 20 different measures of algorithmic fairness, many of which are incompatible with
each other [13, 49]. This incompatibility - the so-called impossibility theorem [13, 49] - forces
scientists and practitioners to choose the measures they use based on their personal believes or
other constraints (e.g. business models) on what has to be considered fair for the particular
problem/domain.
Given the impact of AI, the mitigation of bias is a crucial task. It can be achieved in several
different ways including pro-active approaches to bias, mitigation approaches, and retroactive
approaches [64]. Our work falls into the first category of proactive bias-aware data collec-
tion approaches (Section 5). Bias mitigation approaches can be further categorised into: pre-
processing, in-processing and post-processing approaches (further details can be found at [64]).
Finally, explainability of black box models [30] is among the most prominent retrospective ap-
proaches, especially since EU introduced the “right to explanations” as part of the General
21. Real World
Visual Content Life Cycle Types of Bias:
Historical discrimination
Selection bias; framing bias
Framing bias
3. Editing 4. Dissemination Selection bias; framing bias
Selection bias; label bias
Algorithmic bias
2. Capture
Discrimination
Actors/structures involved:
Society Generation of new
Photographers/video makers 5. Data collection 6. Algorithms biased visual data
Mainstream/social media
Scientists/businesses
Figure 1: Simplified illustration of visual content life cycle and associated sources of bias.
Data Protection Regulation (GDPR)1 (see also Association for Computing Machinery’s state-
ment on Algorithmic Transparency and Accountability2 ). According to this, it is important
to understand why models make certain decisions instead of others both for debugging and
improving the models themselves and for providing the final recipient of those decisions with
meaningful feedback.
2.2 Visual Content Life Cycle and Bias
Figure 1 gives an overview of the life cycle of visual content. It additionally depicts how biases
can enter at any step of this cycle and can be amplified in consecutive interactions.
Real world. The journey of visual content alongside with bias starts even before the actual
content is generated. Our world is undeniably shaped by inequalities and this is reflected in the
generation of data in general and, in particular, in the generation of visual content. For example,
Zhao et al. [89] found out that the dataset MS-COCO [54], a large-scale object detection,
segmentation, and captioning dataset which is used as a benchmark in CV competitions, was
more likely to associate kitchen objects to women. While both image capturing and datasets
collection come at later stage in the life cycle of Figure 1, it is clear that in this instance,
such bias has roots in the gender division between productive and reproductive/care labour.
Nevertheless, as shown in the following paragraphs, each step of the life cycle of visual content
can reproduce or amplify historical discrimination as well as insert new biases.
Capture. The actual life of a visual content item starts with its capturing. Here the first
types of bias can be introduced, selection bias and framing bias. Selection bias is the bias that
arises from the selection of subjects. While usually this kind of bias can be observed in datasets,
where entire groups can be under-represented or non-represented at all, the selection begins with
1 https://eur-lex.europa.eu/legal-content/EN/TXT/?uri=CELEX%3A02016R0679-20160504
2 https://www.acm.org/binaries/content/assets/public-policy/2017_usacm_statement_algorithms.pdf
3the choices of the photographer/video maker3 . Moreover, the way a photo is composed (the
composition, the camera’s setting, the lighting conditions, etc.) is a powerful way for conveying
different messages and thus a possible source of framing bias. Note that, the selection of the
subjects and the framing of the photo/video are both active choices of the photographer/video
maker. Nevertheless, historical discrimination can turn into selection and framing bias if not
actively countered. Imagine, for instance, a photographer working on a photo book of care
workers, it is likely that the photographer will tend to select more women as subjects turning
historical discrimination into selection bias (in a similar way to what Zhao et al. [89] described
for the MS-COCO dataset [54]).
Editing. With the advent of digital photography, image editing and post-processing are now
a key step in the content life-cycle. Post-processing has become a basic skill for every pho-
tographer/video maker along with skills such as camera configuration, lighting, shooting, etc.
Since photo editing tools are extremely powerful, they could give rise to a number of ethical
issues: to what extent and in which contexts is it right to digitally modify the visual content
of an image or video? What harms could such modifications potentially cause? The discussion
around the award-winning Paul Hansen’s photo “Gaza Burial”4 represent a practical example
of how this questions are important to photo-journalism. In particular, what is the trade-off
between effective storytelling and adherence to reality. Nonetheless, photo editing does not
concern only journalism. Actually, it affects people, and especially women, in several different
contexts, from the fashion industry5 to high-school yearbooks6 . These two examples show how
photo editing contributes, on the one hand, to the creation of unrealistic beauty standards and,
on the other hand, it serves as a mean of patriarchal control over women’s body.
Dissemination. The next step in the life of visual content is dissemination. Nowadays,
images and videos are shared via social and mainstream media in such great volume that
nobody can possibly inspect. For instance, more than 500 hours of videos are uploaded to
YouTube every minute7 . Dissemination of visual content clearly suffers from both selection and
framing bias (for a general introduction to framing bias in textual and visual content the reader
can refer to Entman [24] and Coleman [15]). The images selected, the medium and channels
through which they are disseminated, the caption or text they are attached to are all elements
that could give rise to selection and framing bias (see Peng [66] for a case-study of framing bias
in the media coverage of 2016 US presidential election). This is also a step that can lead to
discrimination since it exposes audiences to selected or targeted messages that are conveyed,
intentionally or not, by the visual content.
Data collection. The part of the life cycle of a visual content that is more relevant to the
discussion that will follow is the collection of visual datasets. Here we encounter once more
selection bias, as the the data collection process can exclude or under-represent certain groups
from appearing in the dataset, as well as a new type of bias: label bias. Datasets usually
are not mere collections of images and great effort is expended to collect them along with
additional information in the form of annotations. As we will see, this process is prone to
errors, mislabelling and explicit discrimination (see Miceli et al. [60] for an analysis of power
dynamics in the labelling process of visual data). Furthermore, benchmark datasets have gained
incredible importance in the CV field allowing, on the one hand, great measurable progress in
the field, but, on the other hand, they are criticised for representing only a small portion of
the visual world (see Prabhu & Birhane [67] for a critique to the large-scale collection of visual
3 Note that we do not necessarily mean professional photographers/video makers.
4 M. Krug and S. Niggemeier, Exploring the Boundaries of Photo Editing, Der
Spiegel International, May 2013. https://www.spiegel.de/international/world/
growing-concern-that-news-photos-are-being-excessively-manipulated-a-898509.html.
5 J. Jamil, Viewpoint: Jameela Jamil on why airbrushing should be illegal, BBC, December 2018. https:
//www.bbc.com/news/world-46349307.
6 M. Cramer and M. Levenson, Yearbook Photos of Girls Were Altered to Hide Their Chests, The NY Times,
May 2021. https://www.nytimes.com/2021/05/23/us/yearbook-photos-st-johns-girls-altering.html.
7 https://blog.youtube/press/. Last visited 20.05.2021.
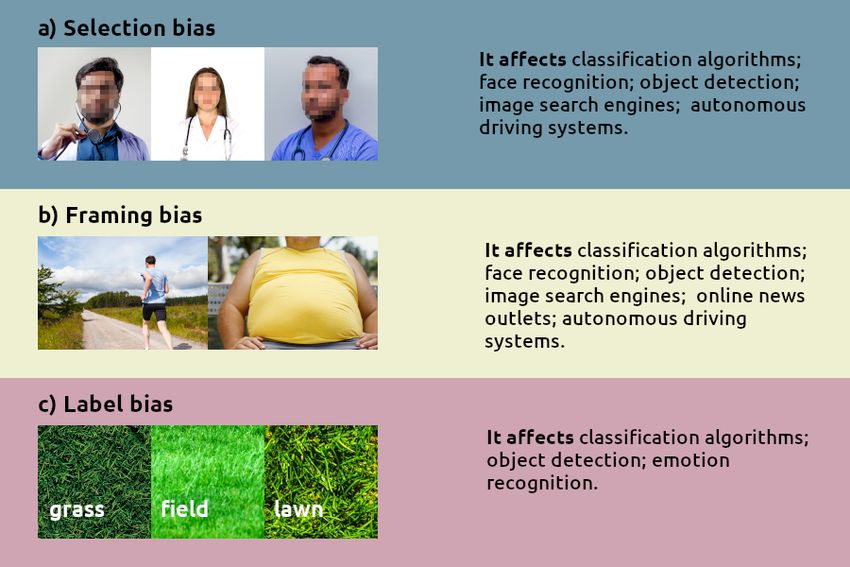
4Figure 2: Examples of selection, framing and label bias. On the right, a list of applications
that can be affected by each type of bias.
data in the wild ). Since researchers play a great role in the collection of benchmark datasets,
we refer to Van Noorden [79] for a survey on ethical questions on the role of research in the
field of facial recognition.
Algorithms Finally, there is the actual step of algorithm training. Fairness and account-
ability of algorithms is a pressing issue as algorithm-powered systems are used pervasively in
applications and services impacting a growing number of citizens [4, 20]. Important questions
arise for the AI and CV communities on how to measure fairness and bias in algorithms, which
are the legal frameworks that should be put in place by governments, what are the strate-
gies to mitigate bias or to make algorithms explainable. Nevertheless, the journey of visual
content does not end with the training of algorithms. Indeed, there are several ways in which
biased algorithms can generated vicious feedback loops. For example, biased machine generated
labelling and image search engine can easily turn into biased data labelling/collection if dealt
without proper care. Moreover, the recent explosion in popularity of generative models, namely
Generative Adversarial Networks [29], has made the process of media creation very easy and
fast (see Mirsky & Lee [62] for a survey on AI-generated visual content). Such AI-generated
media can then be reinserted in the content life cycle via the Web and present their own ethical
issues.
3 Types of Bias in Visual Datasets
In this section, we describe in detail those types of bias that pertain to the capture and col-
lection of visual data: selection bias (Section 3.1), framing bias (Section 3.2) and label bias
(Section 3.3). Note that a comprehensive analysis of both historical discrimination and algo-
rithmic bias is beyond the scope of this work. The interested reader can refer to Bandy [4] for
a survey on methods for auditing algorithmic bias.
Our categorisation builds upon the categorisation by Torralba & Efros [78] who organised
5the types of bias that might arise from large collections of images into four different categories:
selection bias, capture bias (which we collapse into the more general concept of framing bias),
label bias, and negative set bias (which arises when the negative class, say non-white in a binary
feature [white people/non-white people], does not reflect entirely the population of the negative
class). While it makes sense to consider it as a type on its own in the field of object detection
[78], we posit that negative class bias can be considered as an example of selection bias as it is
caused by the under/non-representation of a population in the negative class.
Even though our bias categorisation appears in surface to be very similar to the one in [78],
their analysis focused on datasets for object detection, while we contextualise bias in a more
general setting and also focus on discrimination against protected groups8 defined on the basis
of protected attributes like gender or race. Since selection, framing and label bias manifest in
several different ways, we also go further by describing a sub-categorisation of these three types
of bias (Table 1) including several biases commonly encountered in Statistics, Health studies,
or Psychology and adapting them to the context of visual data. While in the following we will
describe selection, framing and label bias in general terms, we will add some references to Table
1 so that the reader can contextualise better the different manifestations of those three types
of bias.
3.1 Selection Bias
Definition. Selection bias is the type of bias that “occurs when individuals or groups in a
study differ systematically from the population of interest leading to a systematic error in an
association or outcome”9 . More generally, it refers to any “association created as a result of
the process by which individuals are selected into the analysis” (Hernán & Robins [34, Chapter
8, pg. 99]) and regards both experimental and observational studies. In the first case, the flaws
in the selection might arise from the different probability that two groups may have to volun-
teer for an experiment. In the second, the sampling procedure may exclude or under-represent
certain categories of subjects. In visual datasets, using the first definition would be tricky as,
for instance in the case of face detection and recognition, respecting the ethnic composition of
the population is generally not enough to ensure a good performance across every subgroup, as
we will see in the following. Hence, we adopt a slight modification of [34]:
We call selection bias any disparities or associations created as a result of the process by which
subjects are included in a visual dataset.
Description. Torralba & Efros [78] showed that usually certain kinds of imagery are more
likely to be selected during the collection of large-scale benchmark datasets, leading to selection
bias (see sampling bias, Table 1). For example, in Caltech101 [52] pictures labelled as cars are
usually taken from the side, while ImageNet [18] contains more racing cars. Furthermore, a
strong selection bias can also be present within datasets. Indeed, Salakhutdinov et al. [70]
showed that, unless a great effort is made to keep the distribution uniform during the data
collection process, categories in large image datasets follow a long-tail distribution, which means
that, for example, people and windows are way more common than ziggurats and coffins [91].
When, within the same category, a certain subcategory is more represented than others we also
have selection bias (for example the category “Bus” may contain more single-decker busses than
double-decker ones [91]).
Selection bias becomes particularly worrisome when it concerns humans. Buolamwini &
Gebru [11] pointed out that under-representation of people from different genders and ethnic
groups may result in a systematic misclassification of those people (their work concentrates on
gender classification algorithms). They also showed that some popular datasets were biased
towards lighter-skinned male subjects. For example, Adience [23] (resp. IJB-A [48]) have 7.4%
(resp. 4.4%) of darker-skinned females, 6.4% (resp. 16.0%) of darker-skinned males, 44.6%
8 Note that, while this will be the focus of our survey, we will also take into account cases in which bias does
not necessarily affect people, e.g. in object detection.
9 https://catalogofbias.org/biases/selection-bias/
6(resp. 20.2%) of lighter skinned females and 41.6% (resp. 59.4%) of lighter-skinned males.
Such imbalances affect greatly the performance of CV tools. For instance, Buolamwini &
Gebru [11] showed that the error rate for dark skin individuals can be 18 times higher than for
light skin ones in some commercial gender classification algorithms.
Affected applications. In summer 2020, the New York Times published the story of a
Black American individual wrongfully arrested due to an error made by a facial recognition
algorithm10 . While we do not know whether this exact case was caused by a bias in the training
data, we do know that selection bias can lead to different error rates in face recognition. Hence,
such technology should be used with much more care especially in high-impact applications
such as law enforcement.
Another application that selection bias might impact is autonomous driving systems. It is
very challenging to collect a dataset that describes every possible scene and situation a car might
face. The Berkeley Driving Dataset [88] for example contains driving scenes from only four cities
in the US; it is very likely that an autonomous car trained on such a dataset will under-perform
in other cities with different visual characteristics. The effect of selection bias on autonomous
driving becomes particularly risky when it affects pedestrian recognition algorithms. Wilson et
al. [84] studied the impact of under-representation of darker-skinned people on the predictive
inequity of pedestrian recognition systems. They found evidence that the effect of this selection
bias is two-fold: first, such imbalances “beget less statistical certainty” making the process of
recognition more difficult; second, standard loss functions tend to prioritise the more represented
groups and hence some kind of mitigation measures are needed in the training procedure [84].
Moreover, Buolamwini & Gebru [11] explained that part of the collection of benchmark face
datasets is often done using facial detection algorithms. Therefore, every systematic bias in the
training of those tools is propagated to other datasets. This is a clear example of algorithmic
bias turning into selection bias (see automation bias, Table 1), as described at the end of Section
2.2. Furthermore, image search engines can contribute to the creation of selection biases (see
availability bias, Table 1) as well due to systematic biases in their retrieval algorithms. For
example, Kay et al. [43] studied gender bias in Google’s image search engine and, in particular,
they focused on the representation of men and women in different professions. They found out
that, in male-dominated occupations, the male dominance in the images was even higher. On
the contrary, the results for female-dominated careers tended to be more balanced. This shows
how data collection processes can easily end up in vicious cycles of bias: biased algorithms give
rise to biased datasets, which in turn lead to the training of biased algorithms.
Remarks. Finally, Klare et al. [47] pointed out that, while demographic imbalances have
undoubtedly a great impact on some facial recognition algorithms, they do not explain every
disparity in the performance of algorithms. For instance, they suggested that a group of subjects
(e.g. women) might be more difficult to recognise, even with balanced training data, if it is
associated with higher variance (for example, due to hairstyle or make-up).
3.2 Framing Bias
Definition. According to the seminal work of Entman [24] on framing of (textual) commu-
nication, “To frame is to select some aspects of a perceived reality and make them more salient
in a communicating text, in such a way as to promote a particular problem definition, causal
interpretation, moral evaluation and/or treatment recommendation for the item described”.
Coleman [15] adopted the same definition for the framing of visual content and adds that “In
visual studies, framing refers to the selection of one view, scene, or angle when making the
image, cropping, editing or selecting it”. These two definitions highlight how framing bias has
two different aspects. First, the technical aspect: framing bias derives from the way an image
is captured or edited. Second, the medium: visual content are in all respect a medium and
10 K. Hill, Wrongfully Accused by an Algorithm, The New York Times, June 2020. https://www.nytimes.
com/2020/06/24/technology/facial-recognition-arrest.html.
7therefore the way they are composed conveys different messages. Hence, in the following
We refer to framing bias as any associations or disparities that can be used to convey differ-
ent messages and/or that can be traced back to the way in which the visual content has been
artificially composed.
Note that, while the selection process is a powerful tool for framing visual content, we keep
the concepts of selection bias and framing bias distinct, as they present their own peculiarities.
Description. An example of visual framing bias (to be more specific, capture bias, Table
1) has been studied by Heuer et al. [35]. They analysed images attached to obesity-related
articles that appeared in major US online news websites in the time span 2002-2009. They
concluded that there was a substantial difference in the way that such images depicted obese
people with respect to non-overweighted ones. For example, 59% of obese people were headless
(6% of non-overweighted) and 52% had only the abdomen portrayed (0% of non-overweighted).
This portrayal as “headless stomachs”11 [35] (see Figure 2 b) for an example) may have a
stigmatising and de-humanising effect on the viewer. On the contrary, positive characteristics
were more commonly portrayed among non-overweighted people. Corradi [16], while analysing
the use of female bodies in advertisement, talked about “semiotic mutilation” when parts of
a woman’s body are used to advertise a product with a de-humanising effect, similar to what
Heuer et al. have described in their work about obesity.
The relationship between bodies and faces in image framing is a well-known problem. Indeed,
Archer et al. [2] used a ratio between the height of a subject’s body and the length of their
face to determine whether there was a prominence of men’s faces with respect to women’s
ones. They found out that this was true in three different settings: contemporary American
news media photographs, contemporary international news media photographs, and portraits
and self-portraits from 17-th century to 20-th century (interestingly, there was no disparity in
earlier artworks). Furthermore, they found some evidence that people tend to draw men with
higher facial prominence and thus that this bias does not only occur in mass media or art. The
fact that such a bias can affect the perceived qualities (intelligence, dominance, etc.) of the
image’s subject is highlighted by Archer et al. [2] and Schwarz & Kurz [71].
Affected applications. An application that can suffer greatly from framing bias (see stereo-
typing, Table 1) is that of image search engines. For example, Kay et al. [43] found out that
while searching for construction workers on Google Image Search, women were more likely to
be depicted in an unprofessional or hyper-sexualised way12 . It is not clear, though, whether the
retrieval algorithms are responsible for the framing or they just index popular pages associated
with the queries. Nonetheless, the problem remains because images are powerful media for
conveying messages and the incorrect framing in a search engine can contribute to the spread
of biased messages. We recall, for instance, the case of the photo of a woman “ostensibly about
to remove a man’s head”13 that was retrieved after searching “feminism” on a famous stock
photos website.
Nevertheless, visual framing can be used also as a positive tool for challenging societal
constructions. See, for example, the Italian and French feminist movements in the 70s and their
re-framing of female genitalia as a symbol of struggle and liberty [17], or the Body Positivity
movement with its aim to challenge the stigma around women’s bodies, by substituting it with
a more positive view of acceptance. These can be thought of as two examples of “semiologic
guerrilla” [22].
11 The expression “headless stomachs” appears in Heuer et al. but it originally comes from an
online essay by Charlotte Cooper as “headless fatties” http://charlottecooper.net/fat/fat-writing/
headless-fatties-01-07/.
12 This specific problem seems to be solved, but the queries female construction worker and male
construction worker still return a number of pictures in which the subjects are hyper-sexualised.
13 D. Paquette, The Uncomfortable Truth About How We View Working Women, in One Simple Google
search, The Washington Post, April 2015. https://www.washingtonpost.com/news/wonk/wp/2015/04/14/
what-one-simple-google-search-tells-us-about-how-we-view-working-women/.
8Remarks. The study of framing bias opens the door to multi-modal approaches to fairness
as an effective means of analysis. For instance, Brennen et al. [10] studied how images, even
apparently neutral ones such the stock image of a cigarette, have been intentionally attached
to articles to spread misinformation in social-media during the 2020 COVID-19 outbreak. In
such a case, the framing of the image depends on the text attached to it and cannot be studied
considering only visual features. Note that a similar issue can lead to direct discrimination
(see contextual bias, Table 1) such as in the case of photos of Asian people attached to articles
discussing COVID-1914 .
3.3 Label Bias
Definition. For supervised learning, labelled data are required. The quality of the labels15
is of paramount importance for learning and comprises a tedious task due to the complexity
and volume of today’s datasets. Jiang & Nachum [39] define label bias as “the bias that arises
when the labels differ systematically from the ground truth” with clear implications regarding
the generalisation capability of the model to future unseen instances. Torralba & Efros [78]
highlight bias as a result of the labelling process itself for reasons like “semantic categories are
often poorly defined, and different annotators may assign differing labels to the same type of
object”. Torralba & Efros’s work mainly focused on object detection tasks and hence by differ-
ent label assignment they refer, e.g. to “grass” labelled as “lawn” or “picture” as “painting”.
Nevertheless, this kind of problems arise especially when dealing with human-related features
such as race, gender or even beauty.
We define label bias as any errors in the labelling of visual data, with respect to some ground
truth, or the use of poorly defined or fuzzy semantic categories.
Description. As already mentioned, a major source of labelling bias is the poor definition
of semantic categories. Race is a particularly clear example of this: according to Barbujani
& Colonna [6] “The obvious biological differences among humans allow one to make educated
guesses about an unknown person’s ancestry, but agreeing on a catalogue of human races has
so far proved impossible”. Given such an impossibility, racial categorisation in visual datasets
must come at best from subjects’ own race perception or, even worse, from the stereotypical
bias of annotators. As an example of how the concept of race can be volatile, we cite an article
that appeared on The New York Times16 describing how the perception of Italian immigrants
in the US has changed during the 20-th century from being considered people of colour to
being considered white as the result of a socio-political process. From a CV standpoint then, it
would be probably more accurate to use actual visual attributes, if strictly necessary, such as
Fitzpatrick skin type [11] rather than fuzzy categories such as race. Note that, while skin tone
can be a more objective trait to use, it does not reflect entirely the human diversity.
Similarly, the binary categorisation of gender has been criticised. Indeed, as gender identity
is a very personal matter, it appears very difficult for a computer scientist to model it because,
no matter how complicated such a model is, it would not be able to completely capture every
possible shade of gender identity. The above mentioned discussions pose some uncertainty on
categories that were considered undeniably binary (in the case of gender) or discrete (in the
case of race) until not many years ago. Hence, it is important to take into account the fact that
the use of such categories might be inherently biased. Furthermore, the use of fuzzy categories
such as race or gender poses major challenge to algorithmic fairness from both the ontological
and operational points of view [32, 42].
14 N. Roy, News outlets criticized for using Chinatown photos in coronavirus ar-
ticles, NBC News, March 2020. https://www.nbcnews.com/news/asian-america/
news-outlets-criticized-using-chinatown-photos-coronavirus-articles-n1150626.
15 Note that by label we mean any tabular information attached to the image data (object classes, measures,
protected attributes, etc.)
16 B. Staples, How Italians became White, The NY Times, October 2019. https://www.nytimes.com/
interactive/2019/10/12/opinion/columbus-day-italian-american-racism.html.
9Moreover, Torralba & Efros [78] argued that different annotators can come up with different
labels for the same object (a field can be a lawn and so on). While this mainly applies to the
labelling of huge datasets used for object detection rather than face datasets where labels
are usually binary or discrete, it gives us an important input about bias in CV in general:
annotators’ biases and preconceptions are reflected into the datasets. As an example, we cite
the following attempt by Kärkkäinen & Joo [41] to build a race-balanced dataset. In doing so,
the authors asked Amazon Mechanical Turkers to annotate the faces’ race, gender and age group
and chose a 2-out-of-3 approach to define the ground truth of their dataset. Sacha Costanza-
Chock, in a Twitter thread17 , made some pertinent points about the way gender is labelled in
the above-mentioned work: putting aside the fact that gender is considered binary and other
ethical aspects, Kärkkäinen & Joo assumed that humans are able to guess gender from photos
and that this ability maintains the same success rate across all races, ethnicities, genders, etc.
If these assumptions are false, it is clear that the methodology used for the construction of
the dataset cannot be bias-free. We are going to analyse in more detail different attempts to
construct bias-aware datasets in Section 5.
We are going to provide two more concrete examples of label bias. First, we cite a study on
non-verbal flirting communication that recently appeared on The Journal of Sex Research [31].
In this study, men were asked whether women in previously labelled photographs appeared to
be flirtatious, happy or neutral. Those photos were taken by asking to female posers to mimic
happy, neutral or flirtatious expressions either based on suggestions inspired by previous studies
or spontaneously. One can note that while labelled as flirtatious, women in the study were not
flirting at all: they were asked to act as they were. This might seems a subtle difference, but
it does not ensure that the judgements of the male participants were based on a real ability to
recognise a flirt and not on the stereotypical representation of it (see perception bias, Table 1).
Second, a paper by Liang et al. [53] described the construction of a face dataset for assessing
facial beauty. Since beauty and attractiveness are the prototypical examples of subjective
characteristics, it appears obvious that any attempt of constructing such a dataset will be filled
with the personal preconceptions of the voluntary participants who labelled the images (see
observer bias, Table 1).
We can view what has been described so far also as a problem of operationalisation of what
Jacobs & Wallach [37] called unobservable theoretical constructs (see measurement bias, Table
1). They proposed a useful framework that serves as a guideline for the mindful use of fuzzy
semantic categories and answers the following questions about the validity of the operational-
isations (or measurements) of a construct: “Does the operationalization capture all relevant
aspects of the construct purported to be measured? Do the measurements look plausible? Do
they correlate with other measurements of the same construct? Or do they vary in ways that
suggest that the operationalization may be inadvertently capturing aspects of other constructs?
Are the measurements predictive of measurements of any relevant observable properties (and
other unobservable theoretical constructs) thought to be related to the construct, but not in-
corporated into the operationalization? Do the measurements support known hypotheses about
the construct? What are the consequences of using the measurements[?]”.
Affected applications. Since deep learning boosted the popularity of CV, a modern form
of physiognomy has gained a certain momentum. Many studies have appeared in the last few
years claiming to be able to classify images according to the criminal attitude of the subjects,
their happiness or sexual orientation. A commercial tool has also been released to detect ter-
rorists and pedophiles. While “doomed to fail” for a series of technical reasons well explained
by Bowyer et al. [9], these applications rely on a precise ideology that Jake Goldenfein called
computational empiricism [28]: an epistemological paradigm that claims, in spite of any sci-
entific evidence, that the true nature of humans can be measured and unveiled by algorithms.
The reader can refer also to the famous blog post “Physiognomy’s New Clothes”18 for an in-
troduction to the problem.
17 SachaCostanza-Chock (@schock), https://twitter.com/schock/status/1346478831255789569
18 B.Agüera y Arcas, M. Mitchell and A. Todorov, Physiognomy’s New Clothes, May 2017. https://medium.
com/@blaisea/physiognomys-new-clothes-f2d4b59fdd6a.
10Remarks. Just as selection bias, label bias can lead to a vicious cycle: a classification algo-
rithm trained on biased labels will most likely reinforce the original bias when used to label
newly collected data (see automation bias, Table 1).
4 Bias Discovery and Quantification in Visual Datasets
The aim of this section is to understand how the researchers have tackled the problem of dis-
covery and quantification of bias in visual datasets since high-quality visual datasets that are
authentic representations of the world19 are a critical component towards more fair and trust-
worthy CV systems [36]. To this end, we performed a systematic survey of papers addressing
the following problem: Given a visual dataset D, is it possible to discover/quantify what types
of bias it manifests20 ? In particular, we focus on the methodologies or measures used in the
bias discovery process, of which we are going to outline the pros and cons. Furthermore, we
will try to define open issues and possible future directions for research in this field. Note that
this problem is critically different from both the problem of finding out whether an algorithm
discriminates a protected group and the problem of mitigating such bias even though all these
three problems are closely related and sometimes a solution to one of them can give useful
insights to the others.
In order to systematise this review, we proceed in the following way to collect the relevant
material: first, we outline a set of keywords to be used in three different scientific databases
(DBLP, arXiv and Google Scholar) and we select only the material relevant to our research
question following a protocol described in the following paragraph; second, we summarise the
results of our review and outline pros and cons of different methods in Section 4.5. Our review
methodology was inspired by the works of Merli et al. [59] and Kofod-Petersen [50]. Our
protocol also resembles the one described by Kitchenham [46, Section 5.1.1].
Given our problem, we identify the following relevant keywords: bias, image, dataset, fair-
ness. For each of them we also defined a set of synonyms and antonyms (see Table 3). Note
that among the synonyms of the word image we include the words “face” and “facial”. This
is mainly motivated by the fact that in the title and the abstract of the influential work of
Buolamwini & Gebru [11] there are no occurrences of the word “image”, instead we find many
occurrences of the expression “facial analysis dataset”. Notwithstanding, facial analysis is an
important case study for detecting bias in visual content, thus it makes sense to include it
explicitly in our search. The search queries have been composed of all possible combinations of
the different synonyms (antonyms) of the above keywords (for example, “image dataset bias”,
“visual dataset discrimination”, or “image collection fairness”).
The queries resulted, after manual filtering21 , in 17 different relevant papers. The list was
further expanded with 6 articles by looking at papers citing the retrieved works (via Google
Scholar) and at their “related work” sections. We also added to the list Lopez-Paz et al.’s work
on causal signals in images [56] that was not retrieved by the protocol described above. In
the following, we review all these 24 papers, dividing them in four categories according to the
strategies they use to discover bias:
• Reduction to tabular data: these rely on the attributes and labels attached to or
extracted from the visual data and try to measure bias as if it were a tabular dataset (e.g.
counting the number of male and female subjects).
• Biased image representations: these rely on lower-dimensional representations of the
data to discover bias.
19 Whether this means to have balanced data or statistically representative data is an open debate in the AI
community. It really depends on the applications, though, as some (such as CV classification algorithms) do
need balance for working properly while others might require representative data.
20 Of those described in Section 3.
21 The manual filtering consisted in keeping only those papers that describe a method or a measure for dis-
covering and quantifying bias in visual datasets. In some cases, we kept also works developing methods for
algorithmic bias mitigation but that could be used to discover bias in dataset as well (see [3]).
11Selection
Framing
Label
Name Description
Sampling bias∗ Bias that arises from the sampling of the visual data. It •
includes class imbalance.
Negative set bias [78] When a negative class (say non-white in a • •
white/non-white categorisation) is not representa-
tive enough.
Availability bias† Distortion arising from the use of the most readily avail- •
able data (e.g. using search engines)
Platform bias Bias that arises as a result of a data collection being •
carried out on a specific digital platform (e.g. Twitter,
Instagram, etc.).
Volunteer bias† When data is collected in a controlled setting instead of •
being collected in-the-wild, volunteers that participate in
the data collection procedure may differ from the general
population.
Crawling bias Bias that arises as a result of the crawling algo- • •
rithm/system used to collect images from the Web or
with the use of an API (e.g. the keywords used to query
an API, the seed websites used in a crawler).
Spurious correlation Presence of spurious correlations in the dataset that • •
falsely associate a certain group of subjects with any
other features.
Exclusion bias∗ Bias that arise when the data collection excludes partly • •
or completely a certain group of people.
Chronological bias† Distortion due to temporal changes in the visual world • • •
the data is supposed to represent.
Geographical bias [72] Bias due to the geographic provenance of the visual con- • •
tent or of the photographer/video maker (e.g. brides and
grooms depicted only in western clothes).
Capture bias [78] Bias that arise from the way a picture or video is captured •
(e.g. objects always in the centre ,exposure, etc.).
Apprehension bias† Different behaviour of the subjects when they are aware •
of being photographed/filmed (e.g. smiling).
Contextual bias [73] Association between a group of subjects and a specific vi- •
sual context (e.g. women and men respectively in house-
hold and working contexts)
Stereotyping§ When a group is depicted according to stereotypes (e.g. •
female nurses vs. male surgeons).
Measurement bias [37] Every distortion generated by the operationalisation of •
an unobservable theoretical construct (e.g. race opera-
tionalised as a measure of skin colour).
Observer bias† Bias due to the way a annotator records the information. •
Perception bias† When data is labelled according to the possibly flawed •
perception of a annotator (e.g. perceived gender or race)
or when the annotation protocol is not specific enough or
is misinterpreted.
Automation bias§ Bias that arises when the labelling/data selection process • •
relies excessively on (biased) automated systems.
Table 1: A finer-grained categorisation of biases described in Section 3. The bullets
represent which types of bias they are a subcategory of (Note that there are overlaps
as different kind of bias can co-occur). The definitions are adapted from: (†) https:
//catalogofbias.org/biases/; (*) https://en.wikipedia.org/wiki/Sampling_bias; (§)
https://en.wikipedia.org/wiki/List_of_cognitive_biases; and [78, 72, 73, 37].
12Symbol Description
D Cursive capital letters denotes visual datasets
fD (·) A model f trained on the dataset D
w Bold letters denotes vectors
AP Average Precision-Recall (AP) score
APB (fD ) AP score of the model fD when tested on the dataset B
|| · ||2 L2-norm
|D| The number of elements in the dataset D
σ(·) Sigmoid function
1[·] Indicator function
P(·) Probability
P(·|·) Conditional probability
H(·) Shannon entropy
H(·|·) Conditional Shannon entropy
I(·, ·) Mutual information
D(·) Simpson D score
ln(·) Natural logarithm
mean(·) Arithmetic mean
Table 2: Brief summary of the notation used in Section 4.
Synonyms Antonyms
bias discrimination fair, unbiased
image visual, face, facial
dataset collection
Table 3: Set of keywords and relative synonyms and antonyms.
• Cross-dataset bias detection: these try to asses bias by comparing different datasets.
The idea is to discover whether they carry some sort of “signature” due to the data
collection process.
• Other methods: Different methods that could not fit any of the above categories.
4.1 Reduction to Tabular Data
Methods in this category transform visual data into tabular format and leverage the multitude
of bias detection techniques developed for tabular datasets [64]. The features for the tabular
description can be extracted either directly from the images (using, for example, some image
recognition tool) or indirectly from some accompanying image description/annotation (e.g. im-
age caption, labels/hashtags) or both. In the majority of the cases, feature extraction relies
upon automatic processes and is therefore prone to errors and biases (in Figure 1 we described
how the use of biased algorithms affects the data collection/labelling). This is especially true
for the extraction of protected attributes, like gender, race, age etc, as such systems have been
found to discriminate against certain groups. As an example, many facial recognition systems
have been found to be biased against certain ethnic groups22 . Therefore, whatever biases exist
in the original images (selection, framing, label) might not only be reflected but even amplified
in the tabular representation due to the bias-prone feature extraction process.
Below we overview different approaches under this category that extract protected attributes
from visual datasets and evaluate whether bias exists. As already explained, the sources of bias
in such a case are not limited to bias in the original images but bias may also exists due to the
labelling process and the automatic feature extraction. The impact of such additional sources
in the results is typically omitted.
22 N. Singer, C. Metz, Many Systems Are Biased, Says U.S. Study, The NY Times, December 2019. https:
//www.nytimes.com/2019/12/19/technology/facial-recognition-bias.html.
13Label
Framing
Selection
No. Paper Year Type of measures/methods
1 Dulhanty & Wong [21] 2019 • • Count; Demographic parity
2 Yang et al. [86] 2020 • • • Count; Demographic parity
3 Zhao et al. [89] 2017 • • Demographic parity
4 Shankar et al. [72] 2017 • Count
5 Buolamwini & Gebru [11] 2018 • Count
6 Merler et al. [58] 2019 • Entropy-based; Information theoretical
Reduction to tabular data 7 Panda et al. [65] 2018 • • Entropy-based
8 Kim et al. [45] 2019 • • Information theoretical
9 Wang et al. [83] 2019 • • Dataset leakage
10 Wachinger et al. [81] 2021 • Causality
14
11 Jang et al. [38] 2019 • 4 different measures
12 Wang et al. [82] 2020 • • • 13 different measures
13 Kärkkäinen & Joo [41] 2021 • Distance-based
14 Steed and Caliskan [74] 2021 • Distance-based
Biased latent representation
15 Balakrishnan et al. [3] 2020 • Interventions
16 Torralba & Efros [78] 2011 • • Cross-dataset generalisation
17 Tommasi et al. [77] 2015 • • Cross-dataset generalisation
Cross-dataset bias detection 18 Khosla et al. [44] 2012 • • Modelling bias
Table 4: Summary of the collected material.
19 López-López et al. [57] 2019 • Nearest neighbour in a latent space
20 Model & Shamir [63] 2015 • • Model-based
21 Thomas & Kovashka [76] 2019 • Model-based
Other
22 Clark et al. [14] 2020 • • Modelling bias
23 Lopez-Paz et al. [56] 2017 • Causality
24 Hu et al. [36] 2020 • • Crowd-sourcingCount/demographic parity. Dulhanty & Wong [21] proposed a simple method for auditing
ImageNet [18] with respect to gender and age biases. They applied a face detection algorithm
to two different subsets of ImageNet (the training set of ILSVRC [69] and the person category
of ImageNet [18]). After that they applied an age recognition model and a gender recognition
model to them. They then computed the dataset distribution across the age and gender cat-
egories finding out a prevalence of men (58.48%) and a very small amount of people (1.71%)
in the > 60 age group. Computing the percentage of men and women across every category
gave them the opportunity to find the most imbalanced classes in the two subsets of ImageNet.
For example, in the ILSVRC subset, the 89.33% of the images in category bulletproof vest were
labelled as men and the 82.81% of the images in category lipstick were labelled as women.
Therefore, this method does not only give information on the selection bias but also on the
framing of the protected attributes, given a suitable labelling of the dataset. The authors
noted that this method relies on the assumption that the gender and age recognition models
involved are not biased. Such an assumption is violated by the gender recognition model, as
the authors pointed out, therefore the analysis cannot be totally reliable.
Yang et al. [86] performed another analysis of the person category of ImageNet [18], trying
to address both selection and label bias. They addressed label bias by asking annotators to find
out, first, whether the labels could be offensive or sensitive (e.g. sexual/racial slur), and, second,
to point out whether some of the labels were not referring to visual categories (e.g. it is difficult
to understand whether an image depicts a philanthropist). They removed such categories and
continued their analysis by asking annotators to further label the images according to some
categories of interest (gender, age and skin colour) to understand whether the remaining data
were balanced with respect to those categories and then to address selection bias. This de-
mographic analysis showed that women and dark skinned people were both under-represented
in the remaining non-offensive/sensitive and visual categories. Moreover, despite the overall
under-representation, some categories were found to align with stereotypes (e.g. the 66.4% of
people in the category rapper was dark skinned). Hence, they also potentially addressed some
framing bias. The annotation process was validated by measuring the annotators’ agreement
on a small controlled set of images.
Zhao et al. [89] measured the correlation between protected attribute and the occurrences
of various objects/actions. They assumed to have a dataset labelled with a protected attribute
G with values {g1 , ..., gn } and an attribute O = o describing the occurrences of said objects or
actions in the image (for instance, G could be the gender and O a cooking tool or an outdoor
sport scene). The bias score of the dataset with respect to a protected attribute value G = g
and the scene/object O = o is defined as the percentage of g co-occurrences with o:
c(o, g)
b(o, g) = P (1)
x∈{g1 ,...,gn } c(o, x)
where c(o, x) counts the co-occurrences of the object/scene o and the protected attribute’s value
x. If b(o, gi ) > n1 , where n is the number of values that the protected attribute can assume, it
means that attribute G = g is positively correlated with the object/action O = o.
Shankar et al. [72] used instead a simple count to assess geographic bias in ImageNet [69]
and Open Images [51]. They found out, for example, that the great majority of images of
which the geographic provenance is known comes from the USA or Western European countries
resulting in highly imbalanced data. Such a geography-based analysis has been expanded by
Wang et al. [82]. While having balanced data is important for many applications, a mere count
is usually not enough for assessing every type of bias as a balanced dataset could still contain
spurious correlations, framing bias, label bias and so on.
Buolamwini & Gebru [11] constructed a benchmark dataset for gender classification. For
testing discrimination in gender classification models, their dataset is balanced according to
the distribution of both gender and Fitzpatrick skin type as they noticed that the error rates
of classification models tended to be higher at the intersection of those categories (e.g. black
women) because of the use of imbalanced training data. Hence, while they quantify bias by
simply counting the instances with certain protected attributes, the novelty of their work is
that they took into account multiple protected attribute at a time.
15Information theoretical. Merler et al. [58] introduced four measures to construct Pn a bal-
anced dataset of faces. Two measures of diversity: Shannon entropy H(X) = − i=1 P(X =
1
xi ) · ln(P(X = xi )) and Simpson index D(X) = Pn P(X=x i)
2 where P(X = xi ) is the proba-
i=1
n
bility of an image having value xi for the attribute X ∈ {xi }i=1 ; and two measures of evenness:
(EShannon = H(X)
ln(n) and ESimpson =
D(X)
n ). Such measures have been applied to a set of facial
attributes, ranging from craniofacial distances to gender and skin colour, computed both via
automated systems and via the help of human annotators.
Panda et al. [65] also proposed to use (conditional) Shannon entropy for discovering framing
bias in emotion recognition datasets. They computed, using a pre-trained model, the top
occurring objects/scenes in the dataset and computed the conditional entropy of each object
across the positive and negative set of the emotions to see whether some objects/scene where
more likely to be related to a certain emotion. For example, they found out that objects like
balloons or candy stores are only present in the negative-set of sadness in Deep Emotion [87].
Given an object c and an emotion E = e ∈ {0, 1} (where e = 1 represents, for instance, sadness
and e = 0 represents the negative-set non-sadness) they computed:
X
H(E|X = c) = − P(E = e|X = c) · ln(P(E = e|X = c)) (2)
e∈{0,1}
When the conditional entropy of an object is zero, it means that such an object is associated
only with the emotion E or, on the contrary, is never associated with it (it only appears in the
negative set). This may be considered a type of framing bias.
Kim et al. [45] introduced another definition of bias inspired by information theory. They
wanted to develop a method for training classification models that do not overfit due to dataset
biases. In doing so, they give a precise definition of bias: A dataset contains bias when
I(X, Y )
0 where X is the protected attribute, Y is the output variable and I(X, Y ) :=
H(X) − H(X|Y ) is the mutual information between those random variables. Kim et al. pro-
posed to minimise such mutual information during training so that the model forgets the biases
and generalises well. Note that if Y is any feature in the dataset, instead of the output of a
model, this measure can be used to quantify bias in the dataset.
Other. Wang et al. [83] addressed this limitation by defining what they called dataset leakage
which measures the possibility of a protected attribute to be retrieved using only the information
about non-protected ones. Given a dataset D = {xi , yi , gi )} where xi is an image, yi a non-
protected attribute and gi is a protected attribute, the attribute yi is said to leak information
about gi if there exists a function f (·), called attacker, such that f (yi ) ≈ gi . The attacker f (·)
is operationally a classifier trained on {yi , gi }. The dataset leakage is measured as follows:
1
λD = 1[f (yi ) = gi ] (3)
|D|
Wachinger et al. [81] explicitly used causality for studying spurious correlations in neu-
roimaging datasets. Given variables X and Y they wanted to test whether X causes Y or
there exists a confounder variable Z instead. Since those two hypotheses imply two different
factorisations of the distribution P(X|Y ), the factorisation with a lower Kolmogorov complexity
is the one that identifies the true causal structure. Kolmogorov complexity is approximated by
Minimum Description Length (MDL).
Jang et al. [38] proposed 8 different measures for identifying gender framing bias in movies.
The following measures are computed for a movie for each gender, therefore the means are
computed across every frame in which an actor of aPcertain gender appears. The measures
s
are the following: Emotional Diversity H(X) = − i=1 P(X = xi ) · ln(P(X = xi )) where
P(X = xi ) is the probability that a character expresses a certain emotion xi and the sum is
computed on the range of the different emotions shown by characters of a certain gender (the
list of emotions was: anger, disgust, contempt, fear, happiness, neutral, sadness, and surprise);
Spatial Staticity exploits ideas from time-series analysis to measure how static a character is
during the movie, it is defined as mean(P SD(p(t)) where PSD is the power spectral density
16You can also read