CGFS Papers Trade finance: developments and issues
←
→
Page content transcription
If your browser does not render page correctly, please read the page content below
Committee on the Global
Financial System

CGFS Papers
No 50
Trade finance:
developments and issues
Report submitted by a Study Group established by the
Committee on the Global Financial System

The Group was chaired by John J Clark,
Federal Reserve Bank of New York

January 2014

JEL Classification: F10, F34, G21
This publication is available on the BIS website (www.bis.org).

©   Bank for International Settlements 2014. All rights reserved. Brief excerpts may be
    reproduced or translated provided the source is stated.

ISBN 92-9131-309-2 (print)

ISBN 92-9197-309-2 (online)
Preface
Historically, the global trade finance market was considered liquid and well-
functioning. But more recently, it has experienced periods of stress, most notably
right after the Lehman bankruptcy in 2008, and also appears to be undergoing
incipient structural change. At the same time, recurrent data gaps have made it
difficult to assess the extent and impact of recent dislocations, and to track and
evaluate the importance of current market dynamics.
Against this background, in November 2012, the Committee on the Global
Financial System (CGFS) established a Study Group (chaired by John Clark, Federal
Reserve Bank of New York) to improve central banks’ understanding of trade
finance markets.
This report presents the Group’s findings. It examines the structure and recent
evolution of the trade finance market, and the interplay between changes in trade
finance and international trade. In particular, it reviews the available data sources
and what they reveal about the size and evolution of the market, sheds light on the
performance and impact of trade finance during recent episodes of funding strains
in global markets, and examines how ongoing structural changes may affect the
market’s future resilience. In terms of financial stability risks, it concludes that losses
on trade finance portfolios historically have been low. Moreover, given their
short-term nature, banks have been able to quickly reduce their exposures in times
of stress. However, this latter feature also introduces the possibility for trade finance
to act as a conduit of stress from the financial system to the real economy, when
banks run down trade finance books in response to funding and liquidity strains. As
a result, policies that broadly address banking system capital and liquidity
vulnerabilities and encourage vibrant competition are found to generally provide an
effective means for avoiding or containing disruptions to trade finance flows –
current regulatory efforts clearly work in this direction.
The data, concepts and policy implications described in this report are a timely
contribution on an important, yet under-researched topic. I hope that the report will
inform ongoing discussions among the market and policymaking communities and
become a standard reference on trade finance in the literature.
William C Dudley
Chairman, Committee on the Global Financial System
President, Federal Reserve Bank of New York
CGFS – Trade finance: developments and issues iiiContents
Preface ........................................................................................................................................................ iii
Contents ...................................................................................................................................................... v
Executive summary ................................................................................................................................. 1
1. Introduction ....................................................................................................................................... 3
2. The role of banks in supporting international trade ......................................................... 3
3. Measuring bank-intermediated trade finance ..................................................................... 5
4. Global trade finance markets: structure and recent trends ............................................ 8
4.1 The structure of bank-intermediated trade finance:
an interpretation.................................................................................................................... 8
4.2 Bank-intermediated trade finance: recent trends .................................................. 16
5. Trade finance: the potential impact on financial stability and
the real economy ........................................................................................................................... 21
5.1 The impact of disruptions in trade finance ............................................................... 21
5.2 The low-risk nature of trade finance ........................................................................... 25
6. Distributing trade finance assets to non-bank investors ............................................... 27
7. Policy implications......................................................................................................................... 29
7.1 Enhancing the stability and resilience of trade finance ....................................... 30
7.2 Monitoring trade finance markets................................................................................ 32
References ................................................................................................................................................ 35
Appendix 1: Study Group mandate ..............................................................................................39
Appendix 2: Background on trade finance and trade credit ............................................... 41
Appendix 3: Further information on trade finance data ....................................................... 44
Appendix 4: Estimating the size of the global bank-intermediated
trade finance market ................................................................................................. 45
Appendix 5: Recent regulatory reforms and trade finance ................................................. 47
Appendix 6: Overview of the literature........................................................................................ 50
Appendix 7: The determinants of trade finance and the impact of
trade finance on trade: some Group estimates .............................................. 56
CGFS – Trade finance: developments and issues vExecutive summary
This report examines the structure and recent evolution of the global trade finance
market and the interplay between changes in trade finance and international trade.
In particular, it gauges the size and evolution of the market, sheds light on the
performance and impact of trade finance during recent episodes of funding strains
in global markets, and examines how ongoing structural changes may affect the
market’s future resilience. It draws on a range of data sources, outreach to experts
in the private and public sector, a review of the available literature, and new
statistical analysis conducted for this report. The key findings are:
The role of bank-intermediated trade finance. Bank-intermediated trade
finance (or trade finance, in short) performs two vital roles: providing working
capital tied to and in support of international trade transactions, and/or providing
means to reduce payment risk. The principal alternative to bank-intermediated
products is inter-firm trade credit. Firms’ ability to directly extend credit is
supported by possibilities to discount their receivables and the availability of
financing not directly tied to trade transactions, as well as possibilities to mitigate
payment risk by purchasing trade credit insurance.
Data coverage. There is no comprehensive source for measuring the size and
composition of the trade finance market. Aspects of bank-intermediated trade
finance are captured by statistics in many CGFS member countries, but coverage
differs significantly across countries, and in many cases is quite limited. Combining
these data with information from other sources, such as trade associations and
SWIFT, can support a general characterisation of the size, structure and trends of
the global market, but the approach requires significant interpolation and inference.
Visibility into trends in pricing is very limited.
Size and composition of the trade finance market. The Group estimates that
trade finance directly supports about one-third of global trade, with letters of credit
(L/Cs) covering about one-sixth of total trade. However, the proportion varies widely
at the country level: bank-intermediated products are primarily used to finance
trade involving emerging market economies (EMEs), particularly in Asia. Global
banks appear to provide about one-quarter to a third of global trade finance, and
almost half of their exposure is to firms in emerging Asia. In EMEs for which data are
available, local banks account for the bulk of the bank financing in support of trade.
Trade finance seems to be even more dollar denominated than global trade, with
80% of L/Cs, and a high proportion of the activities of global and local banks
denominated in dollars. The ability of global and local banks to provide trade
finance can be disrupted if banks’ dollar funding lines are curtailed, as appears to
have been the case in some instances in 2008/09, and again in 2011/12.
Instruments and changes in market structure. Growth in trade finance has
tended to lag growth in nominal trade in many countries over the last 10-15 years.
This pattern is most apparent in the declining intensity of L/C usage. However, trade
finance intensity has increased strongly in recent years in China and Hong Kong,
and the growing role of the EMEs in world trade has also supported growth in
aggregate trade finance exposures. Global banks see supply chain finance, under
which banks manage the collection and funding of receivables within a network of
firms, as an important new area of activity, and focal point of current competition.
Citing new regulatory demands and high marginal costs of equity capital, the
trade finance industry is experimenting with new structures and products to
CGFS – Trade finance: developments and issues 1distribute trade finance exposures to non-bank investors. To date, the scale of this
activity has been limited, with take-off not appearing imminent. Expanding the role
of non-bank investors may require a significant education effort with investors and
regulators and greater standardisation of trade finance products.
The 2008/09 crisis and strains in 2011/12. Bank-intermediated trade finance
exposures in almost all countries fell sharply in the quarters immediately after the
Lehman bankruptcy, often at rates comparable to declines in the value of trade. In
many cases, trade finance subsequently rebounded quickly. In contrast, while
pricing firmed, data do not point to a broad contraction in the global provision of
short-term trade finance in the second half of 2011, when funding strains at
European banks raised concerns about possible disruptions. The provision of trade
finance by some European banks decreased. But the retrenchment from global
markets was buffered by increased lending from other market participants.
The impact of trade finance disruptions on trade. Surveys and academic
studies generally suggest that trade finance disruptions had a secondary but
economically significant role in the sharp reduction in global trade volumes in the
quarters following the Lehman bankruptcy; reduced global demand for capital
goods and consumer durables was the main driver. Statistical analysis conducted by
the Group using national data sources found broadly similar results, suggesting that
reduced trade finance availability may have accounted for up to one-fifth of the
decline in trade volumes in the aftermath of the Lehman bankruptcy. However, in
other periods, including in 2011, trade finance does not appear to have been a
limiting or accelerating factor in the growth of trade.
Stability risks. Losses on short-term trade finance portfolios historically have
been low. Moreover, given their short-term nature, banks have been able to quickly
reduce their exposures in times of stress. However, this latter feature also introduces
possibilities for trade finance to act as a conduit of stress from the financial system
to the real economy, when banks allow trade finance books to run down in
response to funding and liquidity strains. The ongoing expansion of supply chain
finance networks could make future funding cuts less likely, but potentially more
disruptive to production and distribution channels in the event cutbacks occur.
Policy implications. Policies addressing banking system capital and liquidity
vulnerabilities and encouraging competition generally provide effective means for
avoiding or containing disruptions to trade finance flows. While current regulatory
efforts clearly work in this direction, questions have arisen about whether some of
the new regulatory requirements might result in an overly conservative treatment of
trade finance assets. Adaptions have been made, addressing most of the industry’s
concerns. Market participants generally describe the emerging regulatory
environment as much less burdensome than initially anticipated, while highlighting
that some uncertainties remain about the possibly divergent treatment across
jurisdictions and the potential impact of aspects of the liquidity coverage ratio. Also,
current tight pricing may need to rise once all new rules are fully phased in.
Experience suggests that, in the event of material disruptions specific to trade
finance, targeted short-run support, such as through export credit agency
guarantees or central bank facilities, can play a complementary role in relieving
strains. The short-term nature of trade finance requires that such support be
mobilised quickly. A monitoring strategy, using existing data sources complemented
by market outreach, can support assessment of the desirability and calibration of
any sector-specific response. Enhancing national and industry statistics through
standardising data definitions and extending coverage would aid such an approach.
2 CGFS – Trade finance: developments and issues1. Introduction
The global trade finance market historically was considered liquid and well-
functioning and accordingly did not attract much attention from policymakers.
More recently, however, the sector has experienced periods of stress, most notably
after the Lehman bankruptcy and also in late 2011, when funding strains at
European banks raised concerns about possible disruptions. The sector also appears
to be undergoing incipient structural change – including the entry of new market
participants and efforts to develop new modalities that minimise bank capital and
balance sheet usage. At the same time, recurrent data gaps have made it difficult to
assess the extent and impact of recent dislocations, and to track and evaluate the
importance of current market dynamics.
To better gauge these issues, in November 2012 the Committee on the Global
Financial System (CGFS) established a Study Group, chaired by John Clark (Federal
Reserve Bank of New York). The Group was charged to improve central banks’
understanding of the structure and functioning of the trade finance market, gauge
how it has been evolving in recent years, explore how central banks can cooperate
in better tracking trade finance developments, and assess structural change in trade
finance markets and its implications for financial stability.1
This report documents the Group’s findings, which are based on information
from a variety of sources, including country-specific data submitted by Group
members. Members also reviewed the relevant literature and undertook their own
research, using the data set compiled by the Group, which has not been previously
analysed in the literature. Members coordinated and exchanged views through
conference calls and physical meetings, and conducted outreach to experts in the
private and official trade finance community.
The report is organised as follows. Section 2 discusses the role of banks in
international trade, followed by a description of the available trade finance data and
their sources (Section 3). Section 4 uses this information to estimate the overall size
of the trade finance market and assess recent trends, followed by a discussion in
Section 5 of the potential impact of trade finance on the real economy and financial
stability. Section 6, taking a forward-looking perspective, considers attempts to
involve non-bank investors in trade finance markets. The final section discusses
policy implications.
2. The role of banks in supporting international trade
What is trade finance? Global and local banks support international trade through
a wide range of products that help their customers manage their international
payments and associated risks, and provide needed working capital. The term “trade
finance” is generally reserved for bank products that are specifically linked to
underlying international trade transactions (exports or imports). As such, a working
capital loan not specifically tied to trade is generally not included in this definition.
Trade finance products typically carry short-term maturities, though trade in capital
1
A list of Group members is attached at the end of this report. Appendix 1 reproduces the Study
Group’s mandate.
CGFS – Trade finance: developments and issues 3goods may be supported by longer-term credits. The focus of this report is on
short-term trade finance, both because it funds a much larger volume of trade2 and
because of its interactions with bank funding conditions.
One of the most common and standardised forms of bank-intermediated trade
finance is a letter of credit (L/C). L/Cs reduce payment risk by providing a framework
under which a bank makes (or guarantees) the payment to an exporter on behalf of
an importer once delivery of goods is confirmed through the presentation of the
appropriate documents. For the most part, L/Cs represent off-balance sheet
commitments, though they may at times be associated with an extension of credit.
This can occur, for example, if an import L/C is structured to allow the importer a
period of time (known as “usance”) before repaying the bank for the payment it
made on the importer’s behalf.
Banks may also help meet working capital needs by providing trade finance
loans to exporters or importers. In this case, the loan documentation is linked either
to an L/C or to other forms of documentation related to the underlying trade
transaction.
Currently, the instrumentation of trade finance is undergoing a period of
innovation. For example, the industry recently launched the “bank payment
obligation” – a payment method that offers a similar level of payment security to
that of L/Cs, but without banks physically handling documentary evidence. “Supply
chain finance” is another growing area of banks’ trade finance activities, where
banks automate documentary processing across entire supply chains, often linked
to providing credit (eg through receivables discounting).3
Trade finance versus trade credit. The principal alternative to bank trade
finance is inter-firm trade credit between importers and exporters, which is
commonly referred to as trade credit. This includes open account transactions, where
goods are shipped in advance of payment, and cash-in-advance transactions, where
payment is made before shipment. Inter-firm trade credit entails lower fees and
more flexibility than trade finance, but leaves firms bearing more payment risk, and
potentially a greater need for working capital. Hence, the reliance on inter-firm
trade credit is more likely among firms that have well established commercial
relations, form part of the same multinational corporation and/or are in jurisdictions
that have reliable legal frameworks for collection of receivables.
Firms’ ability to extend trade credit is supported by possibilities to discount
their receivables, eg via factoring, and the availability of financing from banks and
capital markets not directly tied to trade transactions. Firms can also mitigate
payment risk by purchasing trade credit insurance.4 (See Appendix 2 for more
details about trade finance, trade credit and the role of trade credit insurance).
2
The annual flow of medium to long term trade finance exposures tracked by Dealogic Loanware is
in the order of US$ 175 billion, in contrast to the flow in short term markets, estimated in this
report to be between US$ 6.5-8 trillion in 2011.
3
The industry sometimes refers to new trade finance methods, such as supply chain finance, as
“open account trade finance”. Traditionally, open account trade credit has been associated with
inter-firm financing of trade (trade credit), and the term is used in this sense throughout this report.
4
Trade credit insurance is also used by banks to hedge some of their payment risks. Information on
the volume of underwritten trade credit insurance is available from the Berne Union. These data
show that in 2011 and 2012 about $1.7 trillion in new business was covered by guarantees,
4 CGFS – Trade finance: developments and issues3. Measuring bank-intermediated trade finance
There are no readily available data covering the global bank-intermediated trade
finance market. To gauge its size, structure and recent developments, the Group
therefore relied on a range of sources, drawn in particular from national statistics,
the Society for Worldwide Interbank Financial Telecommunication (SWIFT) and the
International Chamber of Commerce (ICC) trade register.
These data capture important aspects of bank-intermediated trade finance, but
they have major limitations in terms of coverage and mutual consistency. This
constrains the meaningfulness of simply aggregating available measures to arrive at
a global stock of bank-intermediated trade finance, and suggests instead an
approach that treats each data source as providing a partial window into aspects of
the bank-intermediated trade finance activity being conducted in that country or
market segment. This information can be combined with other statistical and
anecdotal evidence to support an interpretive characterisation of the size, structure
and trends of the global market.
National data. Aspects of bank-intermediated trade finance are captured by
statistics in several CGFS member countries. For the majority, these data cover only
stocks of trade finance on a quarterly basis. Coverage differs significantly across
countries, and in many cases is quite limited or unavailable. The partial and
heterogeneous nature of the national trade finance data is evident from Table 1,
summarising the characteristics of trade finance data in participating CGFS member
countries and the United Kingdom (for further information see Appendix 3).
A few countries have detailed data capturing large parts of overall trade finance
activities in their countries (eg Brazil, India, Italy and Korea). But others have
statistics covering only specific components of their trade finance markets, such as
export-related trade finance or letters of credit (L/Cs), and several countries have no
specific information on bank-intermediated trade finance.5
For most countries, the available data cover only on-balance sheet lending activities
(ie L/Cs are excluded, except to the extent they are tied to or become funded loans)
by resident domestic banks with a focus on bank lending to domestic borrowers.
The domestic focus makes it difficult to track global activities of banks from those
countries, while in others (eg Germany and the United States) the available data are
limited to, or largely comprise, cross-border activity and here in particular to EMEs,
making it difficult to fully track support to domestic firms. Given these limitations,
several countries have launched efforts aimed at enhancing the coverage of trade
finance activities in their national statistics.6
equivalent to around 9% of global trade, with most of the volume coming from short-term
guarantees (ICC (2013b), see also Appendix 2).
5
For participating CGFS member countries, no trade finance data are available in Canada, Japan, the
Netherlands, Sweden and Switzerland.
6
Generally, the reporting systems that feed into the BIS International Banking Statistics do not allow
for separating bank-intermediated trade finance from other forms of short-term bank credit.
CGFS – Trade finance: developments and issues 5Characteristics of national bank-intermediated trade finance data1
In Study Group member countries and the United Kingdom2 Table 1
4 5
Country Reporting basis Counterparties Trade-finance products Maturity
Resident Cross-border Cross-border Loans L/Cs and guarantees Prices
3 3 Residents Non-residents Short term Long term
banks branches subsidiaries (on-balance sheet) (off-balance sheet)
6
Comprehensive domestic coverage
Brazil X X X X X X
6
China X X X X X X
Hong Kong X X X X X X
7
India X X X X X X P
8
Italy X + OFIs X X X X X X
Korea X X X X X X
9
Spain X X X X P X X X
Partial coverage
Australia X X X X X X X X
10
France X X X P X X
11 12 12 13 14
Germany X P P P X P X
15
Mexico P X X X X
16 16
UK X X P P X X
CGFS – Trade finance: developments and issues
US X X X X X X X
1 2
X = dimension is captured. P = dimension is partially captured. For participating CGFS member countries, no trade finance data are available in Canada, Japan, the Netherlands, Sweden and
Switzerland. 3 Foreign operations of home headquartered banks. 4 In general, only the outstanding stock of trade finance exposures is reported, with the exception of Brazil, where information on flows (new
loans) is also available. 5 Short (long) term refers to maturities of less (more) than 12 months. 6 Because these data are publically available, the report uses on-balance sheet short-term foreign exchange loans
as a close proxy for on- and off-balance sheet trade-finance exposures in China. 7 Only import loans. 8 OFIs = other financial institutions. 9 Only for non-residents. 10 Only export loans. 11 Because of a
structural break, trade finance series are estimated from book claims of German banks on emerging and developing countries since September 2010. 12 Without bank branches and subsidiaries of German credit
institutions located in an EU/EEA country. 13 Only to residents of emerging markets and developing countries. 14 Undrawn commitments not included. 15 Only the import-export bank and foreign
banks. 16 UK exposures capture the total lending guaranteed by the UK export credit agency plus a percentage of the total reported as ‘bills’, comprising all bills drawn on, or accepted by, non-residents,
promissory notes and other negotiable paper (including forfait paper) issued by non- residents other than banks and beneficially owned by the reporting institution.
Source: National data.Data from SWIFT. SWIFT data provide a window into trends related to
documentary credits, such as L/Cs, and can be used to track higher-frequency
global and regional developments. The global volume of cross-border L/Cs should
closely match the volume of L/Cs recorded by SWIFT (see Appendix 4).
Developments in message volumes and values, by country, region, and currency can
be assessed based on proprietary information. Annual regional aggregates for these
data and some time series for a number of individual countries have been released
in the ICC’s annual global surveys of trade finance. However, the L/C business is only
one part of the bank-intermediated trade finance market, which may have different
dynamics than other market segments, as was the case after the Lehman
bankruptcy (see Section 4.2 below).
The ICC trade register. To deepen the understanding of trade finance
products and associated risks, the ICC trade register collects data from a number of
banks considered to be the global leaders in the trade finance field. Data are
provided on a best efforts basis and the main intent is to document the default and
loss record of trade finance products. The database includes unpublished
information on the annual flow of short-term transactions by six product types, as
well as on geographical reach.7 The trade register provides useful insights into the
structure of the trade finance market, though not frequent enough to be used for
monitoring purposes. For instance, the latest report (ICC (2013a)) covers
transactions by 21 banks from 2008 through 2011 on a highly aggregated basis.
Industry surveys and bank disclosures. In addition to market intelligence,
surveys by industry associations are another useful source to gauge trends in trade
finance markets. Some central banks have also conducted surveys at the national
level.
In the wake of the 2008–09 crisis, the International Monetary Fund (IMF) in
conjunction with the Bankers’ Association for Finance and Trade – International
Financial Services Association (BAFT-IFSA) quickly undertook a survey on volumes,
pricing and drivers in trade finance markets in March 2009. This was followed by
several additional survey rounds. The ICC also conducted several surveys in this
window with a similar focus. Another survey was launched in late 2011 by the ICC in
collaboration with the IMF in response to concerns about potential dislocations
owing to strains in Europe. Currently the ICC annual global trade finance survey is
the main broad industry vehicle (260 firms participated in the latest survey) for
exploring drivers and trends.
The Institute of International Finance’s (IIF) quarterly Emerging Markets Bank
Lending Conditions Survey (EMLC), which began in 2009, aggregates the judgment
of senior loan officers from currently more than 130 banks. It includes questions on
external funding conditions and on whether demand or supply conditions have
tightened in trade finance markets in four emerging market regions.
These surveys provide useful insight into broad trends in trade finance markets
and the views of smaller banks. However, the reliability of quantitative estimates
arising from these surveys is open to question, as respondents generally provide
only directional indications (ie whether lines, revenues, or demand is expanding or
contracting), percentage change estimates, and/or characterisations of the market
as a whole, rather than details for their firm which can then be aggregated.
7
The Group would like to thank the ICC for sharing data by region and product type with the Group.
CGFS – Trade finance: developments and issues 7Some banks also release quantitative and/or qualitative information about
trade finance activities with their financial statements. Yet this only occurs in an ad
hoc fashion and only 9 of the 50 top global banks did so in recent years.
Furthermore, reported categories often capture a much broader range of exposures
than short-term trade finance (see Table 3).
Pricing. In general, there is limited transparency in the pricing of trade finance
loans. There are no live screens or post-transaction pricing services for tracking
trends. Leading banks appear to adjust pricing subject to perceived demand, as well
as movements in hurdle rates taking into account the cost of funds and capital.
From the national data, only three countries – Brazil, Korea and India – have some
information to track price trends in their respective markets.8
4. Global trade finance markets: structure and recent trends
The available statistical evidence suggests significant variation across countries and
regions in the intensity of their use of trade finance – usage is notably more
intensive in Asia. Globally, the Group estimates that around a third of trade flows
benefit from some kind of bank-intermediated trade finance product.
4.1 The structure of bank-intermediated trade finance:
an interpretation
Global market size. The Group estimates that, globally, a flow of some
US$6.5–8 trillion of bank-intermediated trade finance was provided during 2011, of
which around US$2.8 trillion was L/Cs.9 Taking into account that some trade
transactions may be supported by more than one trade finance product, the Group
estimates that about a third of global trade is supported by one or more bank-
intermediated trade finance products (Graph 1, Table 2). The remainder was
financed by inter-firm trade credit. Both inter-firm and bank credit providers also
benefit from trade credit insurance, which covered nearly US$1.7 trillion of global
exports in 2011 and 2012.
The global estimates are not very precise because gauging the overall size of
the global bank-intermediated trade finance market requires extrapolation from
partial data. The available sources each cover only part of the market, and
collectively their coverage leaves major gaps. To overcome these problems, the
Group took into account all the available data sources and drew on discussions with
market contacts and trade finance experts. (Details and cross-checks are presented
in Appendix 4).
8
Dealogic is one of the few sources capturing not only volumes but also pricing and tenor of trade
finance loans. But these data cover only self-reported large, medium- and long-term syndicated
credits, which is a very small segment of the bank-intermediated trade finance market.
9
Data from the ICC trade register, which provides a measure of the activities of global banks, is
available only through 2011, so the global market is estimated for that year (see Appendix 4).
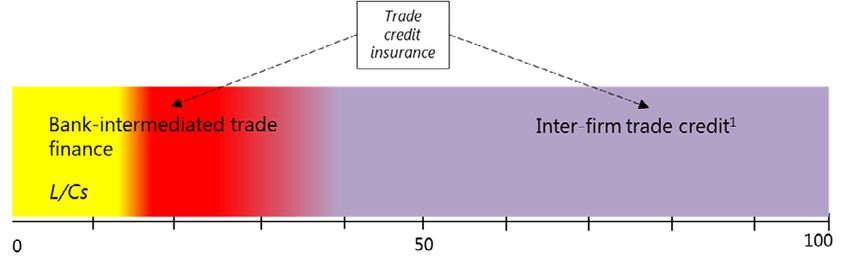
8 CGFS – Trade finance: developments and issuesFinancing global trade – a schematic overview
As a share of total global trade, in per cent Graph 1
1
Inter-firm trade credit includes open account transactions, where goods are shipped in advance of payment, and cash-in-advance
transactions, where payment is made before shipment.
Sources: Group calculations.
As a share of global trade, the Group’s estimate is somewhat lower than what
has been reported from surveys conducted by the IMF and BAFT-IFSA (2009, 2010,
2011)). In those surveys, participating banks estimated that about 40% of global
trade was supported by bank-intermediated trade finance, with the remainder
funded on an open account or cash-in-advance basis. On the other hand, some
industry studies put the share of trade covered by trade finance much lower, at
around 20% (ICC (2009)). Given potentially inconsistent definitions and the
incomplete data available on trade finance markets, which were even more limited
as of mid-2009, it is unclear how banks arrived at their survey responses and thus
how comparable both estimates are.
Regional differences. National data show a wide variation in the measured
intensity of trade finance over trade, ranging from 2% for Mexico to more than 40%
for China, India, Italy and Korea (Table 2). These differences are partially driven by
differences in data coverage, but they also reflect substantial differences in the
intensity of reliance on trade finance across jurisdictions.
Specifically, regional shares from sources which are collected on a comparable basis
(from SWIFT, the ICC, and for US banks) show that the Asia-Pacific region relies
most heavily on trade finance, much more than its share of global trade would
suggest (Graph 2). The region accounts for more than half of the L/C-related as well
as overall trade finance exposures, while Europe accounts for one quarter, and
North America, Latin America, Africa and the Middle East each for around 5–10%.
The higher usage of trade finance in Asia seems to reflect a range of factors,
including distance from trading partners, product types and the efficiency of local
market practices. The academic literature suggests that trade finance is used more
heavily for trade covering longer distances, newly formed trade relationships and
trades involving countries with weaker contractual enforcement, less financial
development and higher political risk.10 Yet these factors alone cannot account for
the large gap between Asia and other developing regions, such as Latin America. It
10
See Glady and Potin (2011) and Niepmann and Schmidt-Eisenlohr (2013).
CGFS – Trade finance: developments and issues 9therefore seems that other factors, such as historical preferences and legal
frameworks as well as regulatory differences, may also play an important role. For
example, discussions with market participants suggest that in Asia L/Cs can be a
relatively cheap and effective instrument to finance working capital. This may apply
especially in countries that have foreign exchange restrictions or strict regulations
applying to ordinary bank lending, and/or where local banks have efficient practices
for establishing funded loans based on L/Cs (see Box 1).
Bank-intermediated trade finance markets in 2011 Table 2
Trade finance (US$ billions) Percentage of merchandise
Country
Stocks1 Annual flows2 trade3
Global estimate 1625-2100 6500-8000 36-40
Adjusted: 30-354
International data sources
L/Cs (SWIFT) 2,782 15
ICC trade register 1,958 11
National data
Comprehensive domestic coverage
Brazil 25 57 24
China 218 871 47
Hong Kong SAR 44 131–175 29–38
India 82 164 41
Italy 83 249–332 47–63
Korea 76 304 56
Spain 25 76–101 23–31
Partial coverage
Australia 9 35 14
France 50 149–199 23–31
5
Germany 47 187 53
Mexico 8 8 2
United Kingdom 23 92 16
United States 69 274 14
Sum national data 736 2,500–2,700
Average All countries 31–34
Comprehensive coverage 38–43
1 2
Average quarterly stock for 2011. Annual flows for national data are derived by assuming a 90-day maturity of stocks, except in
India and Mexico, where maturities are known to be six and 12 months respectively, and in Brazil, where the information on of the flow
of new loans is used. For countries where trade finance data capture short and longer maturities (France, Hong Kong SRA, Italy and
Spain), a 120-day average maturity is also assumed giving rise to the range in the table. 3 Trade is measured as the average of exports
and imports of goods. 4 The adjustment accounts for some trade transactions receiving support from more than one trade finance
product, if for example an L/C is used as collateral for an export loan or banks refinance underlying exposures to exporters or importers
with other banks, which accounts for around 15% of the ICC trade register exposures (see Table 4). For details see Appendix 4. 5 Both
trade finance and trade are only vis-à-vis emerging markets and developing economies.
Sources: ICC; IMF; national data; Group calculations.
10 CGFS – Trade finance: developments and issuesThe geographical distribution of trade finance, trade credit insurance and trade
As a share of total, in per cent Graph 2
50
40
30
20
10
0
Africa Asia-Pacific Europe Latin America Middle East North America
1 2 3 4 5
ICC trade register SWIFT US banks Trade credit insurance Trade
1
Average from 2008 to 2011. 2 Based on average value of sent and received SWIFT MT700 messages in 2011. 3 The US data capture
only lending vis-à-vis non-residents resulting in a low share of US banks’ exposure to North America. Average from 2008 to September
2012. 4 Short term credit insurance from the Berne Union. Average for Q4 2011 to Q1 2013. 5 Merchandise trade (average of imports
and exports) from Q1 2008 to Q4 2012.
Sources: Berne Union; ICC; IMF; SWIFT; national data; Group calculations.
In Europe, shorter distances and well established facilities to insure trade credits
and/or to discount trade receivables with non-banks may help explain a lower
proportion of bank trade finance to trade.11
The role of global and local banks. The largest global banks appear to
account for a quarter to a third of the global supply of bank-intermediated trade
finance, with local and regional banks providing the remainder. For instance, the
21 banks participating in the ICC trade register supported about 8% of global trade
through short-term trade finance products during 2008-11. However, the share rose
through this period, reaching 11% in 2011, when these banks provided US$2 trillion
of the estimated US$6.5–8 trillion of global trade finance. The increase may reflect in
part that the number of banks reporting to the ICC has expanded during successive
vintages of the trade register between 2010 and 2013, reaching 21 banks in the
latest edition.12
Few banks publicly disclose their trade finance exposures, but those that do
collectively report trade finance assets and contingent exposures that are larger
than would be consistent with the flows captured by the ICC trade register (Table 3).
11
The three largest short-term trade credit insurers accounting for the overwhelming bulk of the
short-term insurance business are headquartered in Europe. Usage of Berne Union guarantees is
relatively intensive in Europe, particularly compared to Asia.
12
Data are provided on a best efforts basis, with a focus on providing data by transaction on payment
status and recovery values. It is possible that new entrants were less able to provide detailed data
for earlier years, and also that existing participant banks improved their data collection for more
recent years. Discussions with several firms involved in the preparation of the ICC report suggest
that perhaps 10 other internationally active banks not included in the register might also be
grouped with the global leaders, based on the scope and scale of their trade finance operations,
but the size of their operations would be smaller in proportion to the existing participants.
CGFS – Trade finance: developments and issues 11Reported trade finance assets by selected banks Table 3
Trade Trade ICC
Total
finance finance as Trade
assets Notes
assets % of total Register
(US$ bn)
(US$ bn) assets 2013
Loans for international trade and
HSBC (United Kingdom) 2,556 166 6.5 Yes
services; documentary credit (2011)
Standard Chartered
599 110 18.4 Yes Trade assets and contingents (2011)
(United Kingdom)
Domestic and foreign currency trade
Bank of China (China) 1,878 107 5.7 Yes
finance balance (2011)1
Industrial and Commercial Outstanding on-balance sheet trade
2,456 86 3.5
Bank of China (China) financing (2010)1
Deutsche Bank (Germany) 2,800 74 2.6 Yes International trade finance (2012)
JPMorgan Chase (United
2,266 35 1.5 Yes Trade finance loans (2011)
States)
Advances to customers for
UniCredit (Italy) 1,199 18 1.5 Yes
import/export (2011)
Advances before and after exports and
Banco do Brasil S.A. (Brazil) 523 16 3.1
imports financing (2012)
Assets in global banking & transaction
Intesa Sanpaolo (Italy) 827 8 0.9
business (2011)
Average 4.3
1
Trade finance of the two Chinese banks includes both credit related to international trade and domestic trade.
Sources: Banks’ annual reports and other investor information.
In part, this may reflect inconsistencies in definitions what constitutes trade finance
as well as the inclusion of medium- and long-term credits in the individual bank
disclosures. The latter appear to account for a small share of the annual flow (and
are excluded from the ICC short-term data), but a potentially significant share of
credit outstanding.13 The Berne Union reports that the stock of medium- and long-
term loans backed by export credit agency guarantees (and generally funded by
banks) totalled US$530 billion as of end-2011, and US$625 billion as of end 2012.
In the EMEs for which data are available, local banks account for the majority of
the bank financing in support of trade. Moreover, the share provided by local banks
appears to have increased in recent years. For example, around 80% of trade finance
in India was provided by domestic banks (including foreign-owned subsidiaries) in
2012, up from 60% four years earlier. Home headquartered banks in Brazil provide
around 70% of trade finance, but their market share has been falling somewhat in
the last five years.
13
For the 2013 ICC trade register, 10 banks provided information on medium and long term trade
finance products originated during 2006-11. The total exposure for which information on default
and recovery rates was reported was US$ 211 billion, or US$ 35 billion per year. The average tenor
of these transactions was 11 years, compared with an average tenor of 100 days for short-term
products.
12 CGFS – Trade finance: developments and issuesBox 1
The use of trade finance in China
Two China-specific factors contribute to the popularity of trade finance, and especially L/Cs, in China.
From the demand perspective, the interest rate of trade finance is liberalised. In contrast, RMB loans, the bulk
of bank credit in China, were subject to the interest rate floor set by the central bank until late July 2013. As a result,
the average interest rate of trade finance was much lower than other credit obtained from domestic banks. For
example, in 2012, the weighted average interest rate of RMB trade finance settled through Chinese banks (the lender
might be the domestic banks or foreign banks and corporations) was 5.0%, while the official one-year RMB loan rate
was set at 6.31% and the actual average loan rate was even higher than that.
From the supply perspective, banks are willing to provide trade finance to clients for regulatory reasons. In line
with Basel II and regulations by the China Banking Regulation Committee, trade loans are viewed as low-risk assets
on the banks’ balance sheet. L/Cs are even more popular because of their ability to act as a vehicle for onshore
companies to obtain cheap offshore funding and because they are off-balance sheet assets that normally do not
consume bank capital.
Historically, L/Cs have also been used to arbitrage on- and offshore markets. The discount rates of both RMB
and foreign currency L/Cs were sometimes lower in the offshore than onshore market. Especially from October 2012
onwards, it was profitable to open an L/C in the onshore market and discount it offshore. The China Banking
Regulation Committee issued a warning against this practice in May 2013, after which the issuance of L/Cs dropped.
Currency denomination and reliance on dollar funding. Much of global
trade is priced and settled in dollars, and so is trade finance. Indeed, a key condition
for the ability of many banks to provide trade finance is their access to US dollar
funding. Reduced US dollar funding in the wake of the Lehman failure, for example,
was one of the key reasons for the Brazilian and Korean central banks to directly
support trade finance markets (see Box 3).
Consistent with the US dollar’s predominant role as the currency of
denomination for invoicing trade outside Europe, and the heavy use of L/Cs in Asia,
the US dollar is also the dominant currency of denomination for payments via L/Cs.
More than 80% of the L/Cs are settled in US dollars (ICC (2012)). The euro is the
second most important currency, but it has only a small share, which declined from
10% in 2010 to 7% in 2012. The renminbi, on the other hand, appears to be gaining
market share, though from a low base.14
Funded loans are often dollar-denominated as well, but the overall picture is more
mixed. Discussions with global banks suggest that most transactions with non-
residents are conducted in US dollars, as are commodity finance transactions. This is
also the case for trade finance in India, where more than 90% of import loans and
many export loans are denominated in US dollars.15 In China, trade finance loans are
denominated twice as often in US dollars than in renminbi. In Brazil, the most
common local trade finance loans (called ACCs)16 are denominated in local currency,
14
The rising share of RMB may be overstated due to over-invoicing of trade in some areas in China.
15
Export credit in India includes both pre-shipment and post-shipment credit. While pre-shipment is
both in domestic currency as well as foreign currencies, post shipment credit is entirely in foreign
currency. But information on this segregation is not available.
16
In Brazil all loans are denominated in local currency as foreign currency loans are illegal. For this
reason, a specific product (ACC) was developed, using an export exchange contract as collateral for
CGFS – Trade finance: developments and issues 13Global banks: short-term trade finance activities Table 4
Type of product Share of activity (%)1 Average maturity (days)
Letters of credit and guarantees 52 90
Import L/Cs 26 80
Export confirmed L/Cs 7 70
Performance guarantees and standby L/Cs 19 110
Loans 48 105
Loans for import 19 110
Loans for export: bank risk 13 140
Loans for export: corporate risk 16 70
1
Weighted by the dollar value of transactions. Averages for 2008 to 2011.
Source: ICC (2013a)
but funded with lines in foreign currency (mainly in US dollars) that are repaid with
payments in foreign currency from export proceeds. In advanced economies,
funded loans to resident exporters and importers, in contrast, seem often to be
denominated in domestic currencies. This is the case for 80–90% of the trade
finance loans in Italy, 60% in Hong Kong17 and 45% in France (where the share for
loans to residents is even higher, at 75%).
Maturities. In the ICC trade register, the average maturity of funded loans was
about 3.5 months, while L/Cs and guarantees had slightly shorter maturities
(Table 4). There are some indications that maturities are somewhat longer in
emerging markets as trade finance loans are sometimes used as a substitute for
working capital loans. This is, for example, the case in Brazil, where the trade finance
product with the highest market share (the ACC) partly fulfils this role and has an
average maturity of around six months. Similar maturities are also observed in India.
The evolving role of L/Cs. Transactions involving L/Cs and guarantees
accounted for about half of the aggregate value of global banks’ trade finance
exposures in the ICC trade register (Table 4). Funded loans, mostly to importers and
exporters, make up the remainder. Around 15% of global banks’ trade finance loans
are to other banks, which enable the recipient banks to fund trade loans to
exporters or importers.
L/Cs remain an important component of the global market, providing support
to about 15% of global imports (Table 2). The global volume of L/Cs stood at
around US$2.8 trillion in 2011 and 2012 (Table 2). Yet there are clear indications that
L/Cs have become less important in recent years. In 2000, L/Cs were used for on
the bank loan. The bank funds this loan with an external credit line (liability in foreign currency) and
receives the foreign currency when it settles the exchange contract, having no mismatch of
currency. It also allows the interest rate of the ACC loan to be linked to international interest rates
(Libor), well below domestic rates.
17
Contrary to anecdotes from other jurisdictions that shortage of US dollar liquidity might be one of
the constraints on trade finance supply, the share of foreign currencies (mainly US dollars) in the
trade finance balances of Hong Kong banks has been increasing persistently since 2007 and
currently stands at a historical high.
14 CGFS – Trade finance: developments and issuesThe usage of trade finance products
In per cent Graph 3
Usage of L/Cs1 Payment methods per sector in Korea
50 100
40 75
30 50
20 25
10 0
98 00 02 04 06 08 10 12
s
s
.
ls
ery
m
ry
es
el
als
iles
om
tor
ice
sse
Ste
leu
ine
xtil
2
c
fish
Chinese Taipei Korea Turkey
ob
uc
sc
ev
i
em
tro
ch
Ve
Te
tom
nd
yd
es
ro-
Ma
Pe
ch
ico
rel
pla
Ag
Au
tro
m
Wi
Dis
Pe
Se
Letters of credit Remittances
Documentary collections Others
1 2
Share of L/Cs in total export and import payments. Based on foreign exchange export proceeds and foreign exchange import
payments.
Sources: National data.
average 30% of trade payments in Chinese Taipei, Korea and Turkey, dropping to
around 15% more recently (Graph 3, left-hand panel). This may reflect in part the
expanding network of long-term trade relationships in these countries, which – at
least theoretically – reduces the need for this kind of payment protection.
Box 2
Commodity trade finance
Various industry sources suggest that trade finance has an important role in facilitating commodity trading. Many of
the largest commodity trading firms are based in Switzerland and the Swiss Banking Association (2013) estimates,
based on a survey, that “commodity trade finance in Switzerland, which is guaranteed by banks, amounted to an
estimated volume of around CHF 1,500 billion (≈US$1,7 trillion) in 2011” (p 17). A report by the Swiss government
(Schweizerische Eidgenossenschaft, 2013) suggested that “in Switzerland, roughly 70 to 80% of the financing for
commodity trading is provided by the banks” (p 13).
Commodity traders arrange purchases and deliveries of physical commodities across the globe. Conceptually,
there are several explanations for intensive use of trade finance in commodity trading: the high value of commodity
trades and associated need for funding while goods are in transit; the nature of the collateral, which is easy to verify,
pledge, sell, and hedge on the market; and the potential for large price fluctuations combined with long transaction
chains, which means that there is greater value in conducting bank-intermediated transactions as features of these
transactions (including the documentary evidence) provide quick and effective recourse if problems arise.
The market historically has been dominated by European banks, particularly French and Swiss banks, which
reportedly provided up to 80% of the financing for commodities trading worldwide. However, as some of these
banks have had to reduce balance sheet size and their reliance on US dollar financing, they have apparently scaled
back their lending, bringing their share in commodities financing down to about 50%. To some extent, US and Asian
banks as well as banks in the Middle East have stepped into the breach by increasing their share of financing for
commodity trading (see Lane (2012)).
CGFS – Trade finance: developments and issues 15National data suggest that some industries rely more heavily on L/Cs than
others (Graph 3, right-hand panel). In Korea, for example, L/Cs seem to be the most
preferred payment method for exports in the automobile and petrochemical
industries (around 50% of payments in 2009), whereas they play hardly any role for
electronics goods. The latter was not always the case, though. In 1997, for instance,
the share of payments using L/Cs was more than 40% for the semiconductor
industry. The different intensity of relying on L/Cs may be explained by different
business models, the underlying characteristics of traded goods, the relative
importance of inter-firm trade and the relationships of the exporting firms with
importers. For example, the automobile industry in Korea relies on franchise
dealerships and sales subsidiaries, where there is a lack of credit information and
L/Cs thus provide a secure payment method. Equally, L/Cs are reportedly favoured
in the commodities industry, where goods are relatively homogeneous and easily
posted as collateral (see Box 2).
4.2 Bank-intermediated trade finance: recent trends
Globally, bank-intermediated trade finance has increased substantially in dollar
terms over the past decade and particularly since end-2006, though its growth was
temporarily interrupted after the Lehman bankruptcy in 2008 (Graph 4). However,
the pace has diverged notably across countries in recent years. The observed
increase in trade finance activity is particularly notable in EME member countries
and supports anecdotal reports that local EME banks have started to play a larger
Trends in trade finance1
In billions of US dollars Graph 4
Global developments Emerging markets2 Advanced economies2
900 4,500 320 100 100
750 4,000 240 75 75
600 3,500 160 50 50
450 3,000 80 25 25
300 2,500 0 0 0
07 08 09 10 11 12 13 01 04 07 10 13 01 04 07 10 13
5
Lhs: Rhs: Lhs: Rhs: United States Italy
3 4 5
Trade finance Trade China Brazil Germany Spain
Hong Kong SAR France Australia
India Korea
1
Dashed line: Q3 2008. 2 Stock of bank-intermediated trade finance. 3 Sum of trade finance in Australia, Brazil, France, Germany, Hong
Kong SAR, India, Italy, Korea, Mexico, Spain and the United States. 4 Global merchandise trade (average of exports and
imports). 5 Structural breaks in Q1 2007. Brazil: inclusion of import loans. Italy: inclusion of export and import guarantees.
Sources: IMF; national data.
16 CGFS – Trade finance: developments and issuesTrade finance intensity1
Per cent Graph 5
Emerging markets Advanced economies
80 80
60 60
40 40
20 20
0 0
2001 2003 2005 2007 2009 2011 2013 2001 2003 2005 2007 2009 2011 2013
2 2
Brazil Hong Kong SAR Korea Australia Germany Spain
2
China India France Italy United States
1
Ratio of trade finance over merchandise trade; derived by assuming a 90-day maturity of trade finance stocks, except in India and Mexico,
where maturities are known to be six and 12 months respectively, and in Brazil, where the information on of the flow of new loans is used.
Dashed line: Q3 2008. 2 Trade finance data are break adjusted.
Sources: IMF; national data.
Changes in trade finance and trade in 2008–09 and 2011–121
In per cent Table 5
Q3 2008 – Q1 2009 Q2 2011 – Q2 2012
Bank- Bank-
intermediated L/Cs Trade intermediated L/Cs Trade
(stocks) (stocks)
Australia –20 –34 –2 2
2
Brazil –46 –47 0 –4
China –29 –41 15 9
France 0 –25 0 –9
Germany –30 –30 –20 –10
Hong Kong –29 –33 15 2
India –13 –34 5 –4
Italy –12 –26 –13 –15
Korea –32 –45 –40 0 –12 –3
Mexico 5 –38 32 6
Spain –32 –35 –34 –19 –19 –11
United Kingdom –7 –36 –15 –2
United States –24 –34 19 4
1
Relative change in the stock of trade finance exposures from end-Q3 2008 to end-Q1 2009 or from end-Q2 2011 to end-Q2 2012.
National data are converted to US dollars at end-quarter exchange rates. Changes are therefore influenced by valuation
effects. 2 Changes in the quarterly flow of new trade finance loans.
Sources: National data, Group calculations.
CGFS – Trade finance: developments and issues 17You can also read