CONCEPTUAL REPORT Bachelor thesis - Abstract Robin Mink - University of Twente Student Theses
←
→
Page content transcription
If your browser does not render page correctly, please read the page content below
CONCEPTUAL REPORT
 Bachelor thesis

 Abstract
[Draw your reader in with an engaging abstract. It is typically a short summary of the
 document.
 When you’re ready to add your content, just click here and start typing.]

 Robin Mink
 [Email address]

 Page | 0
Bachelor Thesis Civil Engineering

Date: 25-6-2021
Version: Final Version

Student:
Name: Robin Mink
Study: Bachelor Civil Engineering
Institution: The University of Twente
Student Number s2159597
Email: r.p.c.mink@student.utwente.nl

Internal Supervisor:
Name: Prof. Dr. Ir. E.C. Van Berkum
Email: e.c.vanberkum@utwente.nl

Internship Location:
Name: Strukton Civiel
Address: Westkanaaldijk 2, 3542 DA Utrecht

External Supervisor:
Name: Annemarie Boereboom
Email: annemarie.boereboom@strukton.com

 Page | 1

Preface
Dear reader,

This report has been made as my graduation assignment for the Bachelor of Civil Engineering at the
University of Twente. I have conducted this assignment between the 12th of April and the 25th of June
2021.

I have investigated whether cyclists could be given more priority during rain at one signalized
intersection on the “Innovationroute”. The assignment was performed for the company Strukton
Civiel. It was my goal to give them the best advice possible about such an installation. My internship
was mostly compromised, like most things, by Covid-19. I have therefore spent the vast majority of the
time in my bedroom. Fortunately, I was able to work one day a week on location in Utrecht. It was nice
to experience the company and meet my colleagues in person as well.

At my internship, I became a member of a group who were busy working on a new platform called
WeCity. The ambition of this project is to contribute to the development of Smart Cities by establishing
better cooperation. It provides an open platform where interested parties, both suppliers and
customers of smart solutions, are welcome. WeCity makes it easier, more reliable and more quality-
assured to apply these solutions to make cities smarter. WeCity was launched during my period at the
company. I was informed about the project by being on location and participate in weekly online
meetings. It was really nice to be included in these meetings to experience how certain aspects work
in real life.

Next, I did really enjoy conducting deeper research into traffic-related matters like Intelligent traffic
control systems, traffic modelling, talking traffic and much more. Further, I have also investigated
topics that I did not expect to do beforehand. For example, I have been looking into meteorology to
better understand radar systems and nowcasting. I have also learned about some programming in
Python. This was quite a challenge since I have never programmed in this language before. I did really
enjoy reading and learning about these different topics which are not entirely related to my study.

Firstly, I would like to thank my supervisor from Strukton Civiel, Annemarie Boereboom for the time
and effort she has spent to help me during my assignment. Her influence has really helped me a lot
during my time at the company. I would also like to thank my supervisor from the University, Mr. van
Berkum for his time and useful advice about traffic modelling, the assignment itself and other related
matters. Next, I would thank my family for their interest and support. I lastly would like to thank the
Notebook Service Centre for lending me a laptop, since I destroyed mine just before starting this
project.

I hope you will enjoy this report.

Robin Mink

Anna Paulowna, 25-6-2021

 Page | 2

Samenvatting
De fiets is het meest gebruikte vervoerstype in Nederland. Fietsen kan een oplossing zijn voor
verschillende problemen in het land. Ten eerste moet uitstoot van broeikasgassen verminderd
worden. Een manier om dit te bereiken is door de fiets, in plaats van de auto nemen. Ten tweede is er
veel sprake filevorming op de Nederlandse wegen. Het constant bouwen en uitbreiden van het
wegennet is niet altijd mogelijk wegens de beperkte ruimte. Voor fietsers is veel minder ruimte voor
nodig per persoon dan voor gemotoriseerd vervoer. Het stimuleren van fietsen kan daarom helpen om
dit probleem op te lossen. Eén van het grootste nadeel van fietsen zijn de effecten van slechte weer.
Mensen vinden regen de meest vervelende weersomstandigheid om doorheen te fietsers. Het
wachten in de regen voor een rood stoplicht is helemaal hinderlijk. Het aantal fietsers daalt daarom
ook sterk tijdens regen. Ook wordt er vaker door rood gereden, wat niet bevorderend is voor de
veiligheid. Regengroen kan hier een oplossing voor zijn. Met regengroen wordt er gebruikt gemaakt
van een regensensor om fietsers meer voorrang tijdens regen te geven. Hierdoor zal de veiligheid
verbeteren en hoopt men dat mensen blijven fietsen tijdens regen om bij te dragen aan de benoemde
doelen. In dit verslag wordt er onderzocht of het voordelig is om regengroen toe te passen op de
kruising tussen de N737 en N342. Hiervoor zijn meerder aspecten onderzocht worden welke in de
volgende alinea’s zijn besproken.

Regengroen is niet een nieuwe uitvinding, het is al meerder keren in het laatste decennium toegepast.
Deze soortgelijke toepassingen zijn eerst onderzocht om uit te zoeken hoe ze werken, waarom ze
geplaatst zijn en wat de effecten ervan waren. Uit dit onderzoek blijkt ten eerste dat regengroen beter
functioneert tijdens lage verkeersintensiteiten in vergelijking met hoge. Verder zijn ze allemaal op
kruispunten in de bebouwde kom geïnstalleerd. Het blijkt wel dat het op verschillende manieren is
toegepast. De meest voorkomende toepassing is dat twee keer per cyclus van het stoplicht voorrang
is gegeven, in plaats van de gebruikelijke één. Hierom is er gekozen om het ook op deze manier in dit
onderzoek te testen.

Ook is er in dit onderzoek gebruikt gemaakt van een verkeerskundig model om de effecten van
regengroen te berekenen op de kruising N737/N342. Uit de resultaten blijkt dat het beter functioneert
tijdens rustigere omstandigheden, net als eerder geconcludeerd. Het implementeren van regengroen
is niet zonder gevolgen. Het gemotoriseerd verkeer wordt bewust vertraagd door fietsers meer
voorrang te geven. Hierdoor neemt te wachttijd en 2 uitstoot toe. De uitstoot wordt
gecompenseerd wanneer mensen de fiets boven de auto verkiezen. Critici zeggen dat als het extra
voorrang geven werkt tijdens natte omstandigheden, wanneer het drukker op de weg is, moet dat ook
kunnen tijdens droge omstandigheden. Het installeren en implementeren van een regensensor, wat
geld kost, is dan overbodig. Dit is met het model getest. De resultaten laten dezelfde zien. Ook wordt
regengroen maar 7.3 % van de tijd gebruikt (hoe vaak het regent per jaar). Het kan veel vaker gebruikt
worden wanneer het in elke weersomstandigheid wordt gebruikt. Hierdoor worden nog steeds de
vermelde doelstellingen tijdens nat weer behaald. Daarbovenop wordt het fietsen ook in droge
omstandigheden gestimuleerd waardoor er vaker bijgedragen wordt aan de doelen. Wegens de
beschreven redenen was het besloten dat het voordelig is om het tijdens elke weersomstandigheid te
gebruiken waardoor het overbodig is om een regensensor te plaatsen. Verder is het alleen effectief
tijdens daluren, als eerder besproken. Het is uitgerekend dat ten minste 2 mensen per uur meer de
fiets moet nemen om de uitstoot te verlagen. Het is reëel dat dit gehaald wordt. Het nieuwe systeem
is ook goedkoper en minder gecompliceerd omdat er geen regensensor geïntegreerd hoeft te worden.
Ook kan het snel uitgeschakeld worden wanneer het tegen de verwachting in niet werkt. Het is
verwacht dat de verloren tijd door automobilisten ongeveer 2351.70 euro per jaar extra kost door het
nieuwe systeem, wat maar 0.83% van de totale kosten is door tijdverlies.

 Page | 3
Summary
Cycling is the most commonly used means of transport in the Netherlands. Cycling can be a part of the
solution to several problems in the country. First, greenhouse gas emissions must be reduced because
of global warming. One way to achieve this is by cycling, rather than using the car. Second, there is a
lot of traffic and congestion on Dutch roads. Constantly building and expanding the road network is
not always possible due to limited space. Cyclists require much less space per person than motorized
transport. Encouraging cycling can therefore help to solve this problem. One of the biggest
disadvantages of cycling are the effects of bad weather. People consider rain the most unpleasant
weather condition to cycle through. Waiting in the rain for a red traffic light is then even more
annoying. The number of cyclists therefore drops sharply during rain. In addition, red lights are ignored
more often, which does not enhance safety. A new arrangement can be a solution for this. With this
arrangement, more priority is granted to cyclists during rain. This improves safety and encourages
people to continue cycling during rain, contributing to the mentioned goals. The rain is detected by a
special sensor. This report examines whether it is advantageous to apply such an arrangement at the
intersection between the N737 and the N342. Several aspects were examined for this purpose which
are discussed in the following paragraphs.

The discussed arrangement is not a new idea, it has already been applied several times in the last
decade. These have first been studied to find out how they work, why they were installed and what
their effects were. It was first concluded that they perform better during low traffic intensities
compared to high ones. Furthermore, they were all installed at intersections in built-up areas. Next, it
appears that they were applied in different ways. The most common application is that priority is given
to cyclists twice per traffic light cycle, instead of the usual one. It was therefore decided to integrate it
this way as well in this study.

A traffic model is also used in this study to calculate the effects of the proposed system on the
intersection N737/N342. The results show that it indeed performs better during quieter conditions, as
stated earlier. The implementation is not without consequences. Motorized traffic is deliberately
slowed down by granting cyclists more priority. This causes the waiting times and 2 emissions to
increase. The additional emissions are compensated when people choose the bicycle over the car.
Critics state that if giving additional priority is advantageous during wet conditions when it is busier on
the road, it should also be beneficial during dry conditions. A rain sensor is then redundant. This has
been tested by using the model. The results confirm the statement. Also, it is only used 7.3% of the
time (how often it rains per year). It can be used more often when used in any weather condition. As
a result, the stated objectives are still achieved during wet weather. In addition, cycling is also
encouraged in dry conditions, thus contributing to the goals more often. Due to the reasons described,
it was decided that it is advantageous to use it during all weather conditions, making it unnecessary to
install a rain sensor. Furthermore, it is only effective during off-peak hours, as discussed earlier. It has
been calculated that at least 2 more people per hour need to switch to the bicycle to reduce emissions.
It is realistic that this will be achieved. The new system is also cheaper and less complicated because it
does not require a rain sensor to be integrated. It can also be quickly switched off when it does not
work as expected. It is expected that the additional waiting time for motorized traffic costs
approximately €2351.70 per year, which is only 0.83% of the total cost of lost time.

 Page | 4
Table of contents

Preface ........................................................................................................................................ 2
Samenvatting ............................................................................................................................... 3
Summary ..................................................................................................................................... 4
1. Introduction.......................................................................................................................... 8
 1.1 Innovationroute............................................................................................................................. 8
 1.2 Motivation ..................................................................................................................................... 8
 1.3 Selection process ........................................................................................................................... 8
 1.4 The innovations on the route ........................................................................................................ 8
 1.5 Current situation ........................................................................................................................... 9
 1.6 Problem statement...................................................................................................................... 10
 1.6.1 Global warming .................................................................................................................... 11
 1.6.2 Health & safety ..................................................................................................................... 11
 1.6.3 Cycling in the Netherlands. .................................................................................................. 12
2. Research aim ...................................................................................................................... 12
3. Methodology ...................................................................................................................... 13
4. Theory ................................................................................................................................ 15
 4.1 Terms ........................................................................................................................................... 15
 4.1.1 Traffic engineering terms ..................................................................................................... 15
 4.1.2 Traffic control systems ......................................................................................................... 15
 4.1.3 Talking traffic and Intelligent traffic control systems........................................................... 16
 4.2 Priority for cyclists during precipitation at other intersections .................................................. 17
 4.2.1 Other implementations ........................................................................................................ 17
 4.2.2 Location of the intersections ................................................................................................ 20
 4.2.3 Conclusions other implementations .................................................................................... 20
 4.2.4 Relation to intersection N737/N342 .................................................................................... 21
 4.3 Criticism ....................................................................................................................................... 22
5. Weather ............................................................................................................................. 23
 5.1 Bad weather ................................................................................................................................ 23
 5.2 Studying measuring devices ........................................................................................................ 24
 5.3 Conclusions .................................................................................................................................. 24
6. Traffic ................................................................................................................................. 26
 6.1 Scenarios ..................................................................................................................................... 26
 6.1.1 Rush hour. ............................................................................................................................ 26
 6.1.2 Off-peak hours. ..................................................................................................................... 27

 Page | 5
6.2 Data collection ............................................................................................................................. 27
 6.2.1 Motorized traffic data .......................................................................................................... 28
 6.2.2 Cyclists data .......................................................................................................................... 28
 6.3 Determining intensities ............................................................................................................... 28
 6.3.1 Motorized traffic intensities ................................................................................................. 29
 6.3.2 Cycling traffic intensities ...................................................................................................... 29
 6.3.3 Results. ................................................................................................................................. 30
 6.4 Effect of precipitation on traffic .................................................................................................. 31
 6.4.1 Vehicle parameters. ............................................................................................................. 31
 6.4.2 Change in parameters .......................................................................................................... 32
7. Assessment Framework ...................................................................................................... 33
 7.1 Hard legal criteria ........................................................................................................................ 33
 7.2 Traffic-related criteria ................................................................................................................. 33
 7.3 Environmental related criteria .................................................................................................... 34
8. The model .......................................................................................................................... 36
 8.1 Scenarios ..................................................................................................................................... 36
 8.2 Traffic control system .................................................................................................................. 37
 8.3 Output ......................................................................................................................................... 37
 8.4 Run length, warmup & number of replicants.............................................................................. 38
 8.5 The proposed intervention.......................................................................................................... 38
9. Results................................................................................................................................ 39
 9.1 Default situation .......................................................................................................................... 39
 9.2 Wet conditions ............................................................................................................................ 39
 9.3 Effects of the cycle-friendly traffic control system ..................................................................... 40
 9.4 Conclusions from the model ....................................................................................................... 43
10. Conclusions......................................................................................................................... 45
11. Discussion ........................................................................................................................... 48
12. Advies ................................................................................................................................ 50
 12.1 Plaatsgebonden advies .............................................................................................................. 50
 12.2 Algemeen advies ....................................................................................................................... 51
13. Advice ................................................................................................................................ 52
 13.1 Location-specific advice............................................................................................................. 52
 13.2 General advice ........................................................................................................................... 53
14. References .......................................................................................................................... 54
Appendix ................................................................................................................................... 59
 Appendix A: rain intensity calculations ............................................................................................. 59

 Page | 6
Appendix B: weather detection devices............................................................................................ 62
 B.1.1 A radar system & Nowcast .................................................................................................. 62
 B.1.2 An infrared U-shaped sensor ............................................................................................... 63
 B.1.3 A weather station ................................................................................................................. 64
 B.2 An overview ............................................................................................................................. 64
B.3 Scenarios ..................................................................................................................................... 65
 B.3.1 the switch ............................................................................................................................. 65
 B.3.2 The predictor ........................................................................................................................ 66
 B.3.3 Intensity................................................................................................................................ 66
 B.3.4 Multi-functional weather ..................................................................................................... 66
 B.4 Conclusions.............................................................................................................................. 67
Appendix C: Literature study Rain vs traffic ...................................................................................... 68
Appendix D: Data analysis to investigate the effect of rain on traffic intensities ............................. 72
Appendix E: the model ...................................................................................................................... 74
Appendix F: Processing output of the model .................................................................................... 76
Appendix G: Warmup-time and number of replicants...................................................................... 80
Appendix H: Results........................................................................................................................... 83

 Page | 7
1. Introduction
1.1 Innovationroute
This project is executed on the innovationroute N737. This road is one of the most innovative roads in
the Netherlands because of safety, technology and sustainability. It is a connection between Enschede
and Deurningen. There were many problems before this route was named the innovationroute. The
N737 was a dangerous road. Many accidents occurred, which were caused by multiple reasons. The
most prominent reasons are that the road is narrow and has many bends. The intersections were also
unclear due to the many trees along the road. Furthermore, many trucks use the road because of a
nearby located truck stop. Lastly, many tractors are present because of the surrounding pastures. This
creates a lot of mixing between slow and fast traffic, which is not favourable for safety (Provincie
Overijssel, 2017b).

1.2 Motivation
The first motive for the innovationroute is to improve safety, or rather the lack of safety, as described
in the previous section. The second reason is the location of the road. There are many locations around
it where a lot of high-quality activity takes place like the Technology Base Twente and the University
of Twente. However, the accessibility of these two locations is considered a bottleneck. The province
also considers this route an extension of the innovative knowledge in the area. It has therefore been
decided to use various new technologies and knowledge along the route to showcase them.
Sustainability is also taken into account. The province hopes to realise a road that can cope with an
uncertain future (Provincie Overijssel, 2017b). The province had specified a few minimum
achievements for the implementation of the project. Firstly, traffic flow and safety had to be improved.
The project should also contribute to 2 reduction and circularity. Furthermore, many desired
performances were listed on which interested companies could distinguish themselves.

1.3 Selection process
Many sessions were organised by the province in which interested companies could exchange ideas
about new technologies that could be realised on the innovationroute. Simply listing ideas was not
enough, as these had to be largely developed and ready for deployment. In this way, the province
hopes to become the first customers of these innovative companies. Many ideas were noted by the
province which came out of these discussions. For example, there were ideas to capture 2 with
biomaterial, plants that could generate energy, Wi-Fi in the road, smart traffic signs and much more
(Provincie Overijssel, 2017a). The province aimed to select the best team of companies for the
innovationroute. As a result, they held a selection phase between 2017 and 2018. In the end, it was
decided that a partnership led by Strukton offered the best project. Several companies like Ko Hartog,
Innovadis and Sorama were included in this partnership (Strukton, 2019).

1.4 The innovations on the route
Five main innovations are realised on the innovationroute project, as proposed by the contractor
Strukton. Each of these innovations is shortly explained in the following paragraphs.

The first innovation is the use of an interactive traffic control installation (iVRI). This installation makes
use of all kinds of novelties. Firstly, there are sound cameras. These cameras can detect sounds around
the intersection. This allows the iVRI to detect traffic earlier than using detection loops alone (Tissink,
2020). These cameras can distinguish between different types of traffic such as trucks and personal
cars. This is achieved by an algorithm that interprets sounds based on decibel, tone, duration and pitch.
When the sound cameras hear a crash, they can immediately inform the emergency services. Cameras
are also aimed at the source of the sound, making it possible to immediately identify this source. The

 Page | 8
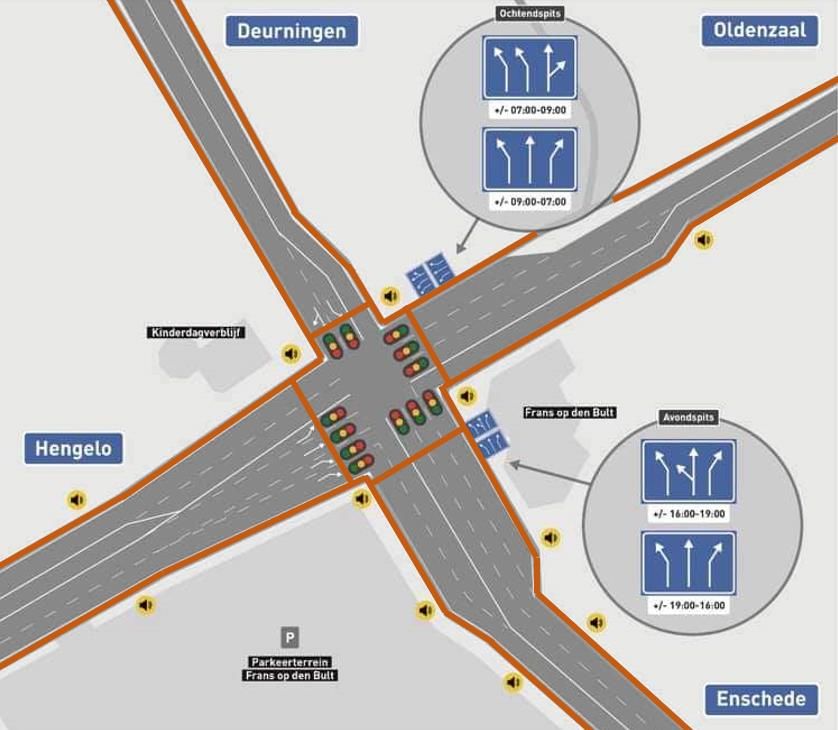
iVRI is part of a programme called Talking Traffic on which is further elaborated upon in the theory
part of this report.

Next, the layout of the intersection between the N737 and N342 can be altered by using dynamic lanes.
These lanes can direct traffic in different directions, based on time. These lanes were established for 2
out of the 4 branches at the intersection. Currently, different scenarios have been established for rush
hours. Therefore, the pre-sorting lanes are different in the morning compared to the afternoon. For
example, two pre-sorting lanes are provided for traffic from Oldenzaal to drive to Enschede, while
there is only one in the afternoon. Also, there are traffic lights 150 meters before the intersection,
whose purpose is to stop the traffic so that a lane switch could be safely executed. The main advantage
of these lanes is that more traffic can be processed and that the capacity of the intersection is
increased. Lastly, traffic had to get used to the switching lanes since it confused some drivers. Cars
took a wrong turn on some occasions because of this confusion (Hasselerharm, 2020). The system was
therefore disabled for a certain time.

The next innovation is adaptive lighting. Road-side lampposts have been installed that can be switched
on and dimmed individually (Innovadis, 2020). This innovation has several purposes. The first is that
the sensors that detect accidents, as described in the previous section, could be used. When the
system detects an accident, the lighting around the intersection is switched to maximum intensity
(Innovadis, 2020). The second purpose is that the network knows with the help of an app and sound
sensors, where cyclists are. This allows the lights to be switched on when a cyclist passes by. This
innovation has the name Motis visible, which has several advantages. The first advantage is that energy
is saved because the lights are only switched on when needed. The second is that social safety is
increased. The final advantage is that nightlife in the woods around the road is not disturbed (Tissink,
2020).

Another innovation is the use of Greenfalt. Greenfalt is a special kind of asphalt that consists of 97%
recycled materials. The first substance of these recycled materials is railroad ballast, the material that
lies under rails. The second material is recycled asphalt from highways. Less 2 is emitted for the
construction of the new road by using these materials (RTL Z how it's done, 2020). Greenfalt has been
used in all asphalt layers, including the covering layer. New material was also used for widening the
road. This new material consists of geopolymer concrete, which is reinforced with a plastic composite.
This new combination can potentially cut the thickness of roads by half (Tissink, 2020). The same type
of concrete has also already been used for the roundabout near the airport, which was constructed in
2017. Ridges have been placed in the asphalt in some places, which should alert inattentive drivers.

An intelligent passing lane has also been constructed. This lane can be used by tractors to let other
traffic pass. The lanes are controlled by a program named Motis Passeerhaven which can alert tractor
drivers when a line of cars forms behind them. Then, the tractors could enter a passing lane to let the
other traffic pass. The program also informs cars behind when the tractors will let them pass
(Innovadis, 2020).

1.5 Current situation
The construction of the discussed innovations took place during 2019 (Van Willigen, 2019). Most
innovations are currently in use. However, the project is not finished yet. Several studies are still being
conducted about the optimisation of the constructed infrastructure. For example, information
obtained from the innovationroute is being studied in a Living Lab so that the programs can be refined.
This allows the road to be better adapted to its users (Strukton, 2019). I am one of those people who
attempt to optimize the route. I am focussing on the intersection between the N737 and the N342. A
schematic overview of this intersection is shown in Figure 1. Information about the dynamic lanes is

 Page | 9
also shown. An extra lane is available during the evening rush hour for left-turning traffic from
Enschede. The layout of the intersection also changes during the morning rush hour from Oldenzaal.
The middle lane is then available for left-turning instead of straight through traffic. The right lane is
subsequently for both straight through as right-turning traffic. The bicycle paths are indicated by the
red lines.

 Figure 1: An overview of the intersection (Strukton Civiel [@struktonciviel], 2020).

1.6 Problem statement
The Netherlands is currently dealing or will deal in the future with major problems. The
innovationroute was created to offer a solution to some of these problems. This project is not any
different. It is discussed in this section what problems are present in the Netherlands and how they
could be solved. Here, particular attention is paid to the effect of cycling.

First, this country is a very built-up area. There is already a lot of traffic and congestion on the Dutch
traffic network. It is expected that the traffic volume will further increase by 8 percent until 2024.
Further, it is expected that the time lost in traffic because of congestion will increase by 23 % by 2024
(Kennisinstituut voor mobiliteitsbeleid, 2019). There is not much space in the Netherlands to counter
these changes by continually constructing and extending roads. Therefore, the government stimulates
alternative transportation methods which use less space. Such methods are walking, cycling and public
transport. How much space each transport type uses is shown in Figure 2. It is indicated that cyclists
use 25 times less space than cars. Promoting cycling should stimulate people to cycle more instead of
taking the car. This can be a part of the solution.

 Page | 10
Figure 2: Used space for different types of transport (Harms & Kansen, 2018, p.14)

1.6.1 Global warming
Next, the greenhouse effect causes that human life is possible on Earth. It is a natural process that
warms the surface of the earth. Sunlight is firstly emitted on the surface of the earth, which is partially
absorbed. This heats warms up the earth itself. The heat radiates from earth towards space. Some of
the heat is trapped by greenhouse gasses which keeps the Earth warm enough to sustain life
(Australian Government, 2021). These greenhouse gasses are carbon dioxide ( 2 ), nitrous oxide
( 2 ), methane ( 4 ) and Ozone ( 3 ). However, human activity has caused that more of these
greenhouse gasses are emitted since the industrial revolution. This causes that more heat is trapped
in the atmosphere which warms up the earth further. This effect is called the enhanced greenhouse
effect, or global warming. Global warming has several negative consequences like increased droughts,
the melting of polar caps and rising sea levels (Jackson, 2021). Multiple agreements have been signed
to combat global warming. The most important agreement is the Paris agreement. In which is stated
that global warming should be limited to an increase of 2°C above pre-industrial levels and pursue an
increase of 1.5 °C (Denchak, 2021). This should bound the aforementioned negative effects as much
as possible.

The transport sector is responsible for 16.2 % of the global greenhouse gas emissions, from which
73.5% by road transport. (Ritchie & Roser, n.d.). The emissions are mostly caused by the combustion
of fossil fuels that release large amounts of greenhouse gases such as 2 and . Cutbacks must
therefore be made in the traffic sector just as in other sectors. These can be achieved by using new
technologies like electric cars. But also by promoting alternative transportation methods which cause
fewer emissions. Cycling is such a method. Substituting the car for cycling saves 150 grams of 2
every kilometre (Harms & Kansen, 2018)

1.6.2 Health & safety
People find rain the most annoying weather condition to cycle through, even more than heavy winds
and colds (Harms, 2008). Waiting for a red light during rain is especially unpleasant. Cyclists are more
likely to run a red light because of this, which can cause dangerous situations. It can be counteracted
however by giving cyclists more priority. A study showed that such implementations could reduce the
number of red light negations by 23 to 78% (Harms, 2008). This would naturally increase the safety of
the intersection.

Furthermore, a study published in The British Medical Journal concluded that commuting and mixed-
mode commuting with a cycling component were both associated with a statistically significant lower
risk of all-cause mortality compared with non-active commuting (Celis-Morales et al., 2017). The health
benefits of cycling are even stronger than walking according to the paper. In this research, data from
263.450 participants was used to investigate the effect of cycling on certain diseases. Confounding

 Page | 11
factors like income, ethnicity, smoking status, obesity-related markers, dietary intakes and more were
considered.

1.6.3 Cycling in the Netherlands.
Cycling is a common mode of transport in the Netherlands. The Dutch cycle more than any other
country in the world. More than a quarter of all the movements are made by bike (De Haas &
Hamersma, 2020). An emerging trend is an electric bicycle or e-bike. Almost Half of the sold bicycles
in 2020 were e-bikes. This is almost a multiplication compared to five years ago (De Haas & Hamersma,
2020). An e-bike makes it easier to cover greater distances compared to “normal” bicycles. This makes
cycling also a plausible substitute for the car for longer distances. Another advantage of the e-bike is
that it makes cycling easier for older people. Almost half of all e-bike trips were made by people older
than 65 (Harms & Kansen, 2018)

Further, cycling is a sustainable solution for problems in the Netherlands like climate change and the
increasingly overcrowded public space, as explained earlier. Cycling also improves the health of its
users. The national government and municipalities have therefore developed policies to stimulate
cycling even more. For example, there is a national election to select the best “fietsstad”, or “cycle
city”, to encourage municipalities in the Netherlands to promote their cycling climate. Such an election
has great effects. When you look up “fietsstad” on the internet you can find dozens of pages with
policies from all kinds of municipalities like Veenendaal, Utrecht, Amsterdam, Groningen, Houten,
Enschede, Haarlem, Zwolle and more. All these policies describe how municipalities are making their
infrastructure more attractive for cyclists. The aimed measures are quite successful. It is expected that
the number of cyclists will increase in the future (De Haas & Hamersma, 2020).

 2. Research aim
One of the biggest disadvantages of cycling compared to taking the car are the effects caused by bad
weather, as discussed before. The number of cyclists therefore falls sharply when it rains (Jonkeren,
2020). A way to counteract this is by installing a new sensor that is able to detect rainfall. This sensor
detects when it rains and sends a signal to the traffic control system. The system switches then to a
different regime in which cyclists are given more priority. This should encourage people to keep cycling
during rainy conditions, contributing to the goals of reducing emissions and solving spatial scarcity. It
also improves safety and the health of its users. It is investigated in this thesis whether it is worthwhile
to implement such a system to the signalized intersection on the Innovationroute. The research
objective of this thesis is, therefore:

“To investigate whether it is worthwhile to install a rain sensor at the signalized intersection
N737/N342 to give cyclists more green time during precipitation”

Strukton Civiel is the company that maintains the discussed intersection. The goal of this thesis is thus
to give them advice on whether they should implement such a system. Several factors are examined
to obtain the best possible advice. These factors are carefully explained in the next chapter. How this
is achieved is also specified.

 Page | 12
3. Methodology
A traffic control system that gives cyclists more green time during rain is not a new intervention. It has
already been practised several times over the last decade. Information about these other systems has
firstly been gathered. The purpose is to better understand such systems. It has been researched how
they work, why they were implemented and their effects on traffic. Several aspects are described. It is
first described how the rain is measured. Secondly, how the regulation of the intersection is adjusted
when it rains. Lastly, how these changes affected the characteristics of the traffic. Information was
firstly sought on the internet via (news) articles, statements of companies and available reports. It was
concluded however that the information is not complete. It lacks certain information which is required
for this research. Therefore, contact was sought by e-mail with multiple municipalities, traffic
engineers and companies which were involved. This has brought information to light that was not
known before. All the gathered information is used to describe the other implementations in the best
way possible. Comparisons between them have also been made. Criticism about rain sensors in general
was also gathered. Finally, it was investigated whether the collected information could be used to claim
anything about the circumstances of the intersection N737 / N342.

The weather conditions at the intersection were then investigated. Information from the last 10 years
was gathered from the Royal Dutch Meteorological Institute. This information was firstly used to
research how frequent precipitation occurs in the Netherlands. This has been achieved by data
analysis. The precipitation is divided into several levels like slight, moderate and heavy rain. The
occurrence of each category is also calculated. The purpose of this is to calculate how much percent
of the time the system would be enabled. Next, precipitation could be detected in multiple different
ways. These are investigated, which has been done by collecting information from the internet and by
making contact with manufacturers and companies. The advantages and disadvantages of each
measuring method are listed. Situations have been drawn up in which information about rain is used
in different ways. You can for example give cyclists priority just before it rains, or include other
properties like traffic intensities and temperature. The best measuring device has been chosen based
on the different situations and the collected information.

A simulation study is thereafter performed. A traffic model of the intersection already existed. It was
created by two other students. The aim is to use this model to investigate the effects of the system on
traffic. The model was not yet complete. Several elements had to be calculated and altered before the
model could be used.

The first element are traffic intensities. Intensities for motorized traffic, as well as cycling traffic, was
gathered. The information about the motorized and cycling traffic was sent by a traffic engineer from
the province of Overijssel. The data showed the intensities for each lane on the intersection in a 15-
minute interval for the month of September 2020. The intensities from cycling traffic were for the
month of April 2021 after a special request. All the intensities were measured by detection loops in
the road. It had been decided to determine the intensities for three scenarios. This has been done
because of two reasons. Firstly, it appeared that the success of similar systems was dependant on
traffic intensity. They seem to perform worse during high intensities. This is tested by introducing
different traffic scenarios. Secondly, because the layout of the intersection changes during the day
because of the dynamic lanes, as discussed in section 1.5. These lanes route traffic in different
directions during rush hours. This also causes the traffic light control to be different. The three
scenarios are; morning rush hour, afternoon rush hour and off-peak hours. The intensities for
motorized traffic as well as cycling traffic has been determined for each scenario by using data analysis.

 Page | 13
Some critics say that if prioritising cyclists works in wet weather, it certainly works in dry weather. A
rain sensor is then completely unnecessary. It has therefore been decided to simulate the model during
dry as well as wet conditions. A traffic model is mostly run for dry conditions. It has therefore been
researched how certain parameters differ between dry and wet conditions. This has firstly been done
by investigating which parameters can be changed in the model. One of these parameters is traffic
intensity. The earlier collected weather data and traffic data have been linked together. It has been
researched if traffic intensities during the dry are different compared to the wet. A check was
conducted to see if there is a relation between them. The change of all parameters were studied by
conducting a literature study. The found information from both the literature study and the check has
been used to calculate how much percent each parameter changes from dry to wet conditions. It is for
example expected that the deceleration ability of vehicles decreases in wet circumstances.

The main goal of the model is to calculate the effects of the proposed cycle-friendly system. This can
be achieved by simulating the current situation, without the system, and a situation in which the
system is integrated. Comparisons can then be made to assess the effects. The model is run for all
different scenarios which were discussed in the sections above. Each of these scenarios has been put
in Table 1. The effect of the different scenarios is related to each other. So there are in total 3 ∗ 3 ∗
2 = 12 different simulations.
Table 1: Scenarios

 Type of Scenario Condition 1 Condition 2 Condition 3
 Traffic conditions Morning rush hour Afternoon rush hour. Off-peak hours
 Weather Condition Dry Wet
 System Off (default) On: 2 times priority

The results which emerge from the model for the 12 different simulations should be compared to each
other. A comparison should be made based on certain criteria. These criteria were established by
creating a framework and were divided into three major groups. The first group are the legally binding
criteria, which have to be met in any condition at any time. The second group are traffic-related
criteria. These are criteria that indicate the effects on the traffic flows and conditions. Properties that
are taken into account are average travel times, lost time and more. One of the goals of the
intervention is to contribute to reducing greenhouse gas emissions. Climate-related properties are
therefore taken into account in the last group.

All the gathered information during this research is used to advise on the rain friendly system. The
advice consists of two parts. The first part is about such a system in general. What things should be
considered when implementing such a system? The second part is about implementing the system at
the intersection N737/N342. First, it is reasoned whether it is worthwhile to do so or not. Second, if it
is worthwhile, how it should be implemented.

 Page | 14
4. Theory
Related theory is elaborated on in this chapter. Three main sections are identified. Traffic engineering
concepts and traffic control systems are explained in the first one. Five similar projects are explained
in the second section. This section discusses how and why these projects are implemented and what
their effects are. A conclusion is made based on the gathered information. The results are then related
to the intersection N737/N342, which is under discussion in this report. Not everybody is positive
about similar projects. Criticism has therefore been discussed in the last section. The gathered criticism
can be used to create a more effective, objective advice.

4.1 Terms
Some traffic engineering terms are used in this report. They are therefore explained in this section to
make the report easier to understand. A traffic control system is the focus of this research. It is
therefore explained how such a control system operates. Important terms are also explained.
Moreover, not just any traffic control system is located on the intersection, but an iVRI is used as
introduced in section 1.4. The iVRI is part of the talking traffic partnership, which attempts to
modernize traffic. This partnership and the iVRI are further elaborated upon in this chapter.

4.1.1 Traffic engineering terms
Intensity: The average number of vehicles passing a junction or stretch of road over a given time. The
intensity can be expressed per minute, hour or day. The most common expression is an intensity per
hour.

Congestion: Congestion is a bottleneck of traffic that causes drivers to drive slower than in ideal
conditions. Congestion can occur when the capacity of a roadway is exceeded.

Travel time: The time it takes for a vehicle to get from point A to point B.

Desired travel time: The fastest possible time to get from point A to point B (at the given maximum
speed). It is possible to calculate the delay at an intersection by subtracting the desired travel time
from the average travel time. The desired travel time is also known as the Free flow time.

4.1.2 Traffic control systems
Traffic light controllers are systems that regulate traffic flows at intersections. They regulate them
according to time. It uses traffic lights to indicate when a certain movement is allowed to pass. A
movement is a combination of one origin-destination pair. Traffic arriving on the west side of the
intersection and driving towards to north is one movement for example. A combination of movements
that are given priority at the same time is called a phase. These movements do not conflict most of the
time. A traffic control system has a certain sequence of phases which is called a cycle. The duration of
one cycle is called the cycle time. A realisation is how many times per cycle a movement has received
a green light. Each movement receives at least one realisation per cycle. It is however possible that
multiple realisations are implemented. Vehicles are measured by detection loops in the road surface.
A gap occurs when the time between two measurements is larger than 2 seconds.

A traffic control system is very complex. The parameters of each system are defined in a document
called the “specificatie verkeerslichtenregeling”, or “Traffic light control specification” in English
(Huijskes, 2015). Hundreds of values are included in this document. These values are fed into the
system which regulates the intersection. Relevant ones for this study are discussed now.

The duration of the green time of each phase is adaptable (Huijskes, 2015). The green time is how long
each phase is prioritised. A minimum green time is firstly implemented based on two factors. Firstly,

 Page | 15
to ensure safety. Road users tend to not look at the traffic light right after turning green. If the
minimum green time is too short, there is a risk that road users unknowingly drive through a red light.
The second factor is that the green time should be sufficient so that traffic between the stop line and
the detection loop can drive away. A maximum green time is also established to ensure that traffic on
conflicting roads does not have to wait too long. People are more likely to drive through a red light
when they are waiting for a long time. The green time may be extended starting from the minimum
time when a gap has not occurred. In other words, the green time is extended when a vehicle is
detected. This process can continue until the maximum green time is reached. The green time of the
same phase in the next cycle is partially based on the previous one.

Next, Minimal yellow times are defined to make sure that all vehicles have left the intersection before
the next phase is started (Huijskes, 2015). The yellow times should also not be too high to prevent
drivers from continuing who could have stopped. Lastly, minimum red times have also been defined,
which regulates the time that a phase is at least red. This time is intended to prevent an uncomfortable
situation for road users.

4.1.3 Talking traffic and Intelligent traffic control systems.
Technology is constantly evolving, which is no different in the traffic sector. More and more data is
being collected, exchanged and transmitted. The Talking Traffic Partnership was therefore established
to stimulate this process (CROW, 2019). Talking Traffic is a partnership between the Ministry of
Infrastructure and Water Management, the business community and decentralised authorities. The
parties cooperate in the development of innovative traffic applications. The partnership must also
ensure that the available data is exchanged more effectively between its members. The partnership is
divided into three clusters. Efforts are being made within cluster 1 to ensure the availability of data by
making traffic light data available. This is achieved by introducing a new interactive traffic control
system (iVRI), which is the most important development within the Talking traffic partnership. The iVRI
is discussed in more detail in a second. The common goal within cluster 2 is to process, enrich and
distribute different data and to transform them into customised, real-time datasets and information.
Data from both public and private sources are combined in this cluster. In addition to data from traffic
lights, this includes all kind of different data like information about the weather, road works, accidents,
parking data and many more (CROW, 2019). Most data is send using cellular communication, or 4G/5G
in short. A server called TLEX (Traffic Light EXchange) is used to connect the iVRI with cluster 2. Both
information to and from the iVRI is routed through the TLEX server. Lastly, the information is
distributed to traffic users in cluster 3. This is achieved by for example smartphones and navigation
systems. It shows road users, for example, in how many seconds they will receive a green light.

The interactive traffic control system (iVRI) was introduced a few years ago and is an upgrade to the
current existing traffic control systems (CROW, 2019). An iVRI can communicate with approaching
vehicles. The obtained data makes it possible to regulate the intersection more efficiently. This allows
that the traffic flows could be optimized toward various goals like traffic flow, safety and sustainability.
Further, rules can be developed which prioritise specific target groups like cyclists, trams and busses.
Drivers themselves can also be personally informed about current traffic conditions. Lastly, the iVRI
has a modular construction, which makes it possible to integrate different components in the future.
This makes the system future-proof.

An iVRI is also present on the intersection N737/N343, which is investigated in this report. A system
called MOTIS is used to combine relevant data and send it towards cluster 2. The goal of this research
is to give cyclists more priority when it rains. Weather information must therefore be gathered,
processed and then send to the iVRI. The talking traffic partnership is used for this purpose.
Information about rain is firstly measured by some sensor. Which sensor is used is elaborated upon

 Page | 16
further in this report. The gathered information is then sent to the MOTIS-server, preferably with
cellular communication. The data is then processed. It is assessed whether it rains to give cyclists extra
priority. If so, a signal is sent towards cluster 2. The signal is subsequently sent to the iVRI via the TLEX
server. The iVRI then switches to a different regulation to give cyclists more priority. A schematic
overview of the described process is shown in Figure 3.

Figure 3: Schematic overview showing the implementation of a rain sensor

4.2 Priority for cyclists during precipitation at other intersections
The goal is to give cyclists more green time when it rains. However, this is not a revolutionary idea
since it has already been tried or implemented before at multiple intersections in the Netherlands.
These are elaborated upon in this section. Information has first been gathered by using sources on the
internet. Second, by making contact with people, municipalities and companies which were involved
by the different project. An overarching conclusion is made at the end of this section.

4.2.1 Other implementations
Apeldoorn
Firstly, it has already been applied at an intersection in Apeldoorn. The rain is detected by a rain radar.
(Rottier, 2017). Then, the information from the radar is processed by nowcasting before the data has
been fed to the traffic control system. Nowcasting is explained in more detail later in this report. The
information from the radar can be used to predict when it is going to rain. This is used to give cyclists
twice as much green time just before it is going to rain which could assure that cyclists arrive at their
destination without getting wet. Also, cyclists are given twice as much green time during precipitation
(Cleantech Regio, 2017).

The goal of the municipality of Apeldoorn is to stimulate bicycle usage. Giving people more priority just
before and during rain is a method to achieve this. It is the intention of the municipality that people
continue cycling during (light) rain, as stated by a traffic consultant of the municipality. However, he
states that this is not really possible during heavy rain. Further, it has been attempted to investigate
how the waiting times for motorized traffic has been affected by the application. This is however
difficult because of multiple reasons. Firstly, people are more likely to take the car during rain, which
automatically increases the traffic intensities and most probably the waiting times. This occurs already
without installing any rain sensor. This makes it difficult to assess the individual effect of such
measures. Also, rain showers are very capricious which makes it difficult to make comparisons.

Grave
A bicycle-friendly traffic light has been installed at an intersection in Grave (Harms, 2008). Normally,
cyclists are given a green light once per cycle at traffic lights. In Grave, however, more realisations are
granted depending on weather conditions and traffic intensity. First, cyclists receive more realisations
during adverse weather conditions. Not only rain is considered for the adverse conditions, but also the
temperature. A weather station is installed at the intersection to measure both conditions. Second,
cyclists receive fewer realisations during high traffic intensities. Table 2 shows how many realisations
are provided per cycle based on the described factors.

 Page | 17
You can also read