Investigation of the chemical composition and nutritional value of - Core
←
→
Page content transcription
If your browser does not render page correctly, please read the page content below
Investigation of the chemical
composition and nutritional value of
  smoothhound shark (Mustelus
          mustelus) meat

                                by

                     Adina Cornelia Bosch

Thesis presented in partial fulfilment of the requirements for the
 degree Master of Science in Food Science at the University of
                         Stellenbosch

               Supervisor: Prof Louw Hoffman
      Co-supervisors: Dr Gunnar Sigge, Dr Sven Kerwath
                Faculty of Agricultural Science
                 Department of Food Science

                           March 2012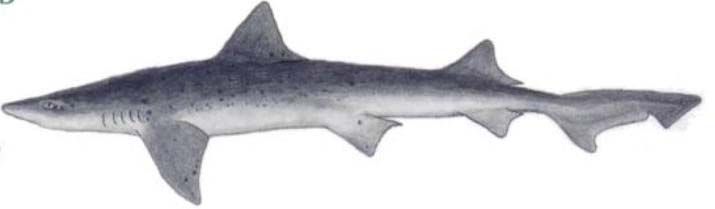
Stellenbosch University http://scholar.sun.ac.za

                                                   Declaration

By submitting this thesis electronically, I declare that the entirety of the work contained therein is my own,
original work, that I am the sole author thereof (save to the extent explicitly otherwise stated), that
reproduction and publication thereof by Stellenbosch University will not infringe any third party rights and that
I have not previously in its entirety or in part submitted it for obtaining any qualification.

Date: March 2012

                                    Copyright © 2012 University of Stellenbosch

                                                  All rights reserved

                                                          ii
Stellenbosch University http://scholar.sun.ac.za
SUMMARY
The aim of this study was to determine the proximate composition of five individual body sites of
the Mustelus mustelus shark in order to evaluate the cross carcass variation of the individual
proximate components (moisture, protein, lipid, ash) of the meat. This variation was determined in
order to find a representative sample of the edible part of the shark (fillet and body flap). Secondly,
this sample representing the entire shark fillet was used to investigate the endogenous factors
(gender, size and life cycle stage) and their effects on the individual proximate components and
other meat components (amino acids, fatty acids, minerals, histamine and mercury contents).
Finally, all this data was combined to describe the average chemical composition and nutritional
value of M. mustelus meat.
None of the proximate components showed any variation between the different fillet
positions. This indicated that the fillet is homogenous and samples for chemical analyses can be
taken anywhere on the fillet as representative of the entire fillet.
It was found that all three main effects (gender, size and life cycle stage) did not have major
influences on most of the components of the chemical composition of M. mustelus meat analysed.
Higher fatty acid levels (SFA, MUFA and PUFA) were observed in large females than in large
males as well as in non-pregnant large females compared to pregnant large females. According to
statistical analysis, large males had higher total mercury levels than large females. The only
component affected by size variation was the fatty acids, showing a trend to decrease in quantity
before maturity was reached. Variation due to life cycle stages was mostly evident in the fatty acid
component with some small effects on two mineral components, aluminium and copper, which had
slightly higher levels in pregnant large females than in non-pregnant large females.
M. mustelus meat has an average proximate composition of 75% moisture, 23% protein,
1.6% lipids and 1.4% ash (weight per wet weight). The protein is, however, an over-estimation of
the true protein value as the meat contains significant amounts of non-protein nitrogen (NPN) in
the form of urea which contributes to the N concentration. M. mustelus meat is a good source of
some essential amino acids, especially lysine and threonine (78% of the daily requirements for an
adult in a 100g portion), but low in minerals. The meat has a healthy lipid content with a good ratio
(>0.45) of PUFA:SFA (0.83) as well as a healthy (Stellenbosch University http://scholar.sun.ac.za
OPSOMMING
Die doel van hierdie studie was om die proksimale samestelling van die vleis vanaf vyf afsonderlike
posisies op die liggaam van die Mustelus mustelus haai te bepaal. Sodoende is die variasie, met
betrekking tot die verskillende proksimale komponente (vog, proteïen, lipiede en as), in terme van
die totale karkas, bepaal. Die proksimale variasie is bepaal om vas te stel hoe ʼn
verteenwoordigende monster van die totale karkas geneem kan word. Gevolglik is hierdie
verteenwoordigende monster gebruik om die effek van geslag, grootte en die verskillende fases
van die lewens-siklus op die afsonderlike proksimale komponente asook ander vleis komponente
(aminosure, vetsure, minerale, histamien en kwik inhoud) te ondersoek. Laastens is al hierdie
inligting gebruik om die algemene samestelling en voedingswaarde van M. mustelus vleis te
bespreek.
Geen van die proksimale komponente het enige variasie getoon tussen afsonderlike
liggaamsposisies nie. Hierdie resultaat dui daarop dat die vleis van ʼn M. mustelus haai homogeen
is regoor die karkas en dat ʼn vleis monster vanaf enige posisie op die karkas geneem kan word as
ʼn verteenwoordigende monster.
Daar is gevind dat geslag, grootte en fase van die lewens-siklus geen merkwaardige
invloed het op die vleis se samestelling nie. Hoër vetsuur konsentrasies (versadigde, mono-
onversadigde en poli-onversadigde vetsure) is gevind in groot vroulike haaie en nie-dragtige
vroulike haaie as in groot manlike haaie en dragtige vroulike haaie onderskeidelik. Statisties, het
groot manlike haaie hoër vlakke van totale kwik as groot vroulike haaie. Die enigste vleis
komponent wat beïnvloed is deur die grootte van die haai, is die vetsure, wat verminder het voor
volwassenheid bereik is en dan weer vermeerder soos die haai groter word. Variasie as gevolg
van die verskillende fases van die lewens-siklus is meestal gevind in die vetsuursamestelling, en
die minimale het ook gevarieer ten opsigte van die elemente aluminium en boor wat effense hoër
vlakke getoon het in dragtige haaie as in nie-dragtige haaie.
M. mustelus vleis het ʼn gemiddelde proksimale samestelling van 75% vog, 23% proteïen,
1.6% lipiede en 1.4% as (nat massa). Die proteïen waarde is ʼn oorskatting van die ware proteïen
waarde as gevolg van hoë nie-proteïen stikstof in die vorm van ureum wat bydra tot die totale
stikstof inhoud. M. mustelus vleis blyk ʼn goeie bron van sommige essensiële aminosure soos lisien
en treonien (78% van die daaglikse aanbevole dosis), maar laag in mineraal inhoud. Die vleis het ʼn
gesonde vet inhoud met ʼn goeie (>0.045) poli-onversadigde:versadigde vetsuur verhouding (0.83)
asook ʼn gesonde (Stellenbosch University http://scholar.sun.ac.za
ACKNOWLEDGEMENTS
I wish to express my sincerest appreciation to the following individuals and institutions who have
made the completion of this thesis possible:
Professor Louw Hoffman, Department of Animal Sciences, Stellenbosch University,
Dr. Gunnar Sigge, Department of Food Science, Stellenbosch University,
Dr. Sven Kerwath, Department of Agriculture, Forestry and Fisheries, Cape Town,
Staff members and postgraduate students at the Department of Animal Science: Gail Jordaan, Lisa
Uys, Donna Cawthorn and Beverly Ellis,
Ms Resia Swart, Elsenburg Agricultural College, Stellenbosch,
Staff members at the Department of Agriculture, Forestry and Fisheries: Charlene Da Silva, Dr.
Lutz Auerswalt, Melissa Goosen,
Professor Vincent Taylor, Langebaan, Western Cape,
Mr. Johnny Fouche, Xolile processing facility, Strand, Western Cape,
OSP Food Security initiative for funding,
South African Association of Food Science and Technology (SAAFoST) for financial support,
The National Research Foundation (NRF) for financial support (any opinion, findings and
conclusions or recommendations expressed in this material are those of the author(s) and
therefore the NRF does not accept any liability in regard thereto),
My family and friends for their support during this time,
My heavenly farther for giving me the gifts, abilities and opportunities that I did not deserve.
vStellenbosch University http://scholar.sun.ac.za
TABLE OF CONTENTS
Declaration ......................................................................................................................................... ii
Summary........................................................................................................................................... iii
Opsomming ....................................................................................................................................... iv
Acknowledgements ............................................................................................................................v
Table of Contents.............................................................................................................................. vi
Chapter 1: Introduction .................................................................................................................. 1
References........................................................................................................................................ 3
Chapter 2: Literature review .......................................................................................................... 5
Background ....................................................................................................................................... 5
Shark industry in sub-equatorial Africa ............................................................................................. 8
Shark industry in South Africa ........................................................................................................... 8
History ................................................................................................................................. 10
Shark catches...................................................................................................................... 10
Shark production ................................................................................................................. 14
Shark handling in a typical South African shark processing facility ..................................... 17
Exports ................................................................................................................................ 18
Shark products ................................................................................................................................ 18
Sustainability ................................................................................................................................... 20
Commercial species........................................................................................................................ 22
Mustelus spp. ...................................................................................................................... 22
Mustelus mustelus ............................................................................................................... 22
Commercial use .............................................................................................................................. 24
Nutritional composition of shark meat ............................................................................................. 24
Variation of proximate composition ..................................................................................... 24
General proximate composition of sharks ........................................................................... 27
Safety of shark meat ....................................................................................................................... 29
Biological safety .................................................................................................................. 29
Chemical safety ................................................................................................................... 31
Conclusion ...................................................................................................................................... 33
References...................................................................................................................................... 33
viStellenbosch University http://scholar.sun.ac.za
Chapter 3: Cross carcass variation in the proximate composition of Mustelus mustelus
meat ...................................................................................................................................... 38
Summary......................................................................................................................................... 38
Introduction ..................................................................................................................................... 38
Materials and methods.................................................................................................................... 39
Sampling ............................................................................................................................. 39
Harvesting .................................................................................................................. 39
Dissection................................................................................................................... 40
Sample demographics ............................................................................................... 41
Sub-sampling ...................................................................................................................... 41
Proximate Analysis .............................................................................................................. 43
Sample preparation .................................................................................................... 43
Moisture content......................................................................................................... 43
Total protein content .................................................................................................. 43
Total lipid content ....................................................................................................... 43
Ash content ................................................................................................................ 43
Statistical analysis of data ................................................................................................... 44
Results ............................................................................................................................................ 44
Discussion ....................................................................................................................................... 45
Conclusion ...................................................................................................................................... 48
References...................................................................................................................................... 48
Chapter 4: The effects of gender, size and life cycle stage on the chemical composition of
Mustelus mustelus meat ..................................................................................................... 50
Summary......................................................................................................................................... 50
Introduction ..................................................................................................................................... 50
Materials and methods.................................................................................................................... 52
Sub-sampling ...................................................................................................................... 53
Analytical methods .............................................................................................................. 54
Proximate composition ............................................................................................... 54
Fatty acids .................................................................................................................. 54
Amino acids................................................................................................................ 54
Minerals...................................................................................................................... 55
Mercury ...................................................................................................................... 55
Histamine ................................................................................................................... 56
Statistical analysis of data ................................................................................................... 56
Results ............................................................................................................................................ 56
viiStellenbosch University http://scholar.sun.ac.za
Proximate composition ........................................................................................................ 56
Amino acid composition ...................................................................................................... 57
Fatty acid composition ......................................................................................................... 59
Mercury content................................................................................................................... 64
Histamine ............................................................................................................................ 64
Discussion ....................................................................................................................................... 65
Conclusion ...................................................................................................................................... 68
References...................................................................................................................................... 68
Chapter 5: The investigation of the chemical compostition and nutritional value of Mustelus
mustelus meat...................................................................................................................... 70
Summary......................................................................................................................................... 70
Introduction ..................................................................................................................................... 70
Materials and methods.................................................................................................................... 71
Urea and ammonia analysis ................................................................................................ 71
Results ............................................................................................................................................ 72
Discussion ....................................................................................................................................... 77
Conclusion ...................................................................................................................................... 82
References...................................................................................................................................... 82
Chapter 6: General discussion and conclusions ....................................................................... 85
References...................................................................................................................................... 87
viiiStellenbosch University http://scholar.sun.ac.za
Chapter 1
INTRODUCTION
The first directed shark fishery in South Africa was reportedly initiated in the early 1930’s (Kroese
et al., 1995). Although the shark industry in South Africa has since fluctuated, the demand for
shark products has shown a steady increase since the early 1990’s (Stuttaford, 1995). The
smoothhound (Mustelus mustelus) shark, which is one of the shark species commonly caught off
the Southern African coastline, has only been targeted as a food source since the late 1980’s in
this country (Smale & Compagno, 1997). Over the last decade, smoothhound catches off South
Africa have steadily increased from 4 tons in 2001 to 85 tons in 2009 (Anonymous, 2011). This is
also one of the main shark species that is exported to Australia (Fouche, 2011), where there is a
large market for shark meat for use in ‘fish and chips’ and other minced fish products (Preston,
1984).
Even though M. mustelus meat is commonly consumed in many parts of the world, no
information currently exists in terms of the chemical composition and nutritional value of this shark
species. The newly published South African labelling legislation (R.146/2010) (DoH, 2010), as well
as the South African Consumer Protection Act (R.467/2009) (DTI, 2009), aim to ensure that local
consumers have access to honest, accurate information on foodstuff labels, which is not
misleading in any way, and which will empower them to make informed purchasing decisions (Van
der Riet, 2011).
According to the regulations promulgated under R.146/2010 (DoH, 2010), nutritional
labelling is mandatory on those products for which nutrient-related health claims are made, but not
on those where no such nutrient-related claims are made. Nonetheless, there is still an urgent
need for the publication of comprehensive nutritional data for raw food products, particularly for
when this information is included voluntarily on product labels and for incorporation into local and
international food composition tables created for dietetic planning purposes.
From the limited information that is available on the nutritional composition of shark meat, it
can be gathered that this is generally a healthy food source. Geiger and Borgstrom (1962) reported
that shark protein is a good source of essential amino acids and can serve as a cheap food
substitute to fulfil several amino acid deficiencies in protein-poor diets. Fish meat is known to be
rich in omega-3 fatty acids (n-3 FA), with particularly marine species having a favourable omega-6
to omega-3 fatty acid ratio (0.45) (Huss, 1988). An increased intake of
omega-3 polyunsaturated fatty acids has been recommended for the treatment and prevention of
coronary heart disease (Simopoulos, 1991). Nevertheless, the western diet has a great deficiencyStellenbosch University http://scholar.sun.ac.za
in omega-3 fatty acids (Simopoulos, 1991; Justi et al., 2003). The inclusion of larger proportions of
fish or shark meat into such diets could thus increase the intake of these important fatty acids and
potentially decrease the risks for heart disease.
Along with these probable health benefits of shark meat, there are also a number of
potential adverse effects associated with its consumption. The latter may include the formation of
histamine, a biogenic amine formed from the free amino acid histidine, which can accumulate as a
result of post-harvest bacterial contamination and time-temperature abuse of the meat. High levels
of histamine in fish have been identified as the causative agent in histamine poisoning (also called
scromboid or scrombotoxin poisoning) in humans (Ababouch et al., 2004).
A further hazard associated with the consumption of shark meat is the potential for high
levels of heavy metals to accumulate in their tissues, with mercury being the heavy metal of
greatest concern. Since sharks are long-lived species and feed at a high trophic level in the marine
food web, they are prone to the storage of high mercury levels in their muscles and organs due to
the processes of bioaccumulation and biomagnification (Ababouch et al., 2004). The consumption
of high levels of mercury, especially in its organic methylmercury (MeHg) form, can lead to mercury
poisoning in humans (Ruelas-Inzunza & Paez-Osuna, 2005).
Factors affecting the nutritional composition and the safety of shark meat are manifold and
include genetic variation, individual variation, anatomical differences, physiological factors, gender
differences, seasonal changes and environmental factors (Jacquot, 1961). In order to accurately
determine the proximate composition of M. mustelus meat, it is first necessary to identify that
sample that should be taken for such analyses that is the most representative of the entire edible
portion of the fish, as well as the entire population of the species. A representative sample will also
be one that takes all of the aforementioned possible factors of variation into account.
The first aim of this study was to determine the proximate composition of M. mustelus
sharks at five different body sites so as to evaluate the cross-carcass variation existing within the
meat for the individual proximate components (moisture, protein, lipid and ash). This variation was
determined in order to identify the most representative sample of the edible part of the shark (fillet
and body flap) that could be used for future chemical analyses. The second aim was to use the
sample deemed to be most representative of M. mustelus meat to investigate the endogenous
factors (gender, size and life cycle stage) and their effects on the individual proximate components
and other meat components (amino acids, fatty acids, minerals, histamine and mercury content).
The final aim was to utilise the data obtained from the two aforementioned study components to
describe the average chemical composition and nutritional value of M. mustelus meat, which would
prove extremely valuable for incorporation into the new South African Food Composition Tables
being compiled by the Medical Research Council (MRC).
2Stellenbosch University http://scholar.sun.ac.za
References
Ababouch, L., Gram, L. & Huss, H.H. (2004). Characterization of hazards in seafood. In:
Assessment and management of seafood safety and quality. Pp. 26-95. Rome: Food and
Agricultural Organization of the United Nations.
Anonymous (2011). Global Capture Production 1950-2009. [WWW document]. URL
http://www.fao.org/fishery/statistics/global-capture-production/query/en. 24 June 2011.
DoH (Department of Health) (2010). Foodstuffs, Cosmetics and Disinfectants Act, 1972 (Act 54 of
1972), regulations relating to the labelling and advertising of foodstuffs (R. 146/2010).
South African Government Gazette, 32975, 3-53.
DTI (Department of Trade and Industry) (2009). Consumer Protection Act. Act no. 68 of 2008. R.
467/2009. Government Gazette, 32186, 1-186.
Fouche, J. (2011). Xolile processing facility, Strand, South Africa. Personal communication.
Geiger, E. & Borgstrom, G. (1962). Fish Protein - Nutritive Aspects. In: Fish as Food (edited by G.
Borgstrom). Pp. 29-114. New York: Academic Press Inc.
Huss, H.H. (1988). Chemical composition. In: Fresh fish: quality and quality changes Pp. 15-25.
Rome: Food and Agriculture Organization of the United Nations Danish International
Development Agency.
Jacquot, R. (1961). Organic Constituents of Fish and Other Aquatic Animal Foods. In: Fish as
Food. Production, Biochemistry and Microbiology (edited by G. Borgstrom). Pp. 145-209.
New York, London: Academic Press.
Justi, K., Hayashi, C., Visentainer, J., De Souza, N. & Matsushita, M. (2003). The influence of feed
supply time on the fatty acid profile of Nile tilapia (Oreochromis niloticus) fed on a diet
enriched with n-3 fatty acids. Food Chemistry, 80, 489-493.
Kroese, M., Sauer, W. & Penney, A. (1995). An overview of shark catches and by-catches in South
African fisheries. Collective Volume of Scientific Papers-International Commission for the
Conservation of Atlantic Tunas, 45, 318-328.
Økland, H.M.W., Stoknes, I.S., Remme, J.F., Kjerstad, M. & Synnes, M. (2005). Proximate
composition, fatty acid and lipid class composition of the muscle from deep-sea teleosts
and elasmobranchs. Comparative Biochemistry and Physiology Part B: Biochemistry and
Molecular Biology, 140, 437-443.
Preston, G.L. (1984). Market Requirements for Shark Products. SPC Fisheries Newsletter, 30, 29-
31.
Ruelas-Inzunza, J. & Paez-Osuna, F. (2005). Mercury in fish and shark tissues from two coastal
lagoons in the gulf of California, Mexico. Bulletin of environmental contamination and
toxicology, 74, 294-300.
Simopoulos, A.P. (1991). Omega-3 fatty acids in health and disease and in growth and
development. The American journal of clinical nutrition, 54, 438.
3Stellenbosch University http://scholar.sun.ac.za
Smale, M. & Compagno, L. (1997). Life history and diet of two southern African smoothhound
sharks, Mustelus mustelus (Linnaeus, 1758) and Mustelus palumbes Smith, 1957 (Pisces:
Triakidae). South African Journal of Marine Science, 18, 229-248.
Stuttaford, M. (1995). Fishing Industry Handbook. South Africa, Namibia and Mozambique. Pp.
433. Stellenbosch: Marine Information cc.
Van der Riet, Y. (2011). Blowing the lid off SA food labelling. In: Food Safety Initiative (FSI).
Consumer Goods Council of South Africa.
4Stellenbosch University http://scholar.sun.ac.za
Chapter 2
LITERATURE REVIEW
Background
Shark fishing is practiced worldwide and forms a significant part of the fishing industry in many
countries. Sharks belong to the class chondrichthyes (cartilaginous fishes), subclass
elasmobranchii and superorder selachimorpha (sharks) (Nelson, 2006). Globally, reported landings
of chondrichthyan fishes exceeded 700 000 tons per annum in 1998, the majority of which was
fairly evenly divided between sharks and batoid elasmobranchs (rays and skates) (Walker, 1998).
Of the total recorded catch at this time, chondrichthyans and sharks provided approximately 1%
and 0.5% of the world’s fisheries products, respectively (Walker, 1998).
The countries with the highest shark catches in the world are ranked in the Top 20 list
(Table 2.1) (Lack & Sant, 2011). The term ‘shark’ in this list refers to all chondrichtyan species
(sharks, skates, rays and chimaeras). Catches by these 20 countries represent nearly 80% of the
world’s shark catches (Lack & Sant, 2011). The information in Table 2.1 is only based on shark
catch data reported to the United Nations Food and Agriculture Organisation (FAO) and therefore
does not likely truly represent all shark catches worldwide. According to this information, Indonesia
is the top shark-catching country in the world at present, representing about 13% of the total shark
catches worldwide (Lack & Sant, 2011). Most sharks caught are taken as by-catch by fisheries
targeting other species and, as a result, most of this by-catch is reported as unidentified shark or
not reported at all, providing very little accurate information on the shark catch industry (Walker
1998). A growing number of sharks caught incidentally in some fisheries are being landed for
human consumption, but many are still being discarded at sea, with only their fins being kept (Sonu
and Region 1998). The major shark groups caught are requiem sharks (family Carcharhinidae) and
dogfish, followed by smoothhounds (Mustelus spp.) (Vannuccini, 1999).
An indication of the total annual shark catches per continent is provided in Figure 2.1
(Anonymous, 2011). From observation of this figure, it is evident that Asia is the leading continent
in terms of shark catches. For many years, Japan was the world’s largest harvesters and
consumers of elasmobranchs, but the Japanese share of the world shark catch decreased during
the late 1900s. To fulfil the demand for sharks, Japan increased shark imports from $600 000
worth in 1976 to $18 million in 1997 (Sonu & Region, 1998). The decrease in Japanese shark
catches is portrayed in Figure 2.2 and is compared with the increases in catches in the rest of the
world during the late 1900s.
5Stellenbosch University http://scholar.sun.ac.za
Table 2.1 Top 20 countries by % of global reported shark catch (adapted from (Lack & Sant,
2011)
Top 20 % of global reported shark catch
Countries
Indonesia 13.0
India 9.0
Spain 7.3
Taiwan 5.8
Argentina 4.3
Mexico 4.1
Pakistan 3.9
United States 3.7
Japan 3.0
Malaysia 2.9
Thailand 2.8
France 2.6
Brazil 2.4
Sri Lanka 2.4
New Zealand 2.2
Portugal 1.9
Nigeria 1.7
Iran 1.7
U.K. 1.6
South Korea 1.4
6Stellenbosch University http://scholar.sun.ac.za
Annual shark catch per continent
500000
450000 Africa
400000 Americas
350000
Shark captured (t)
Asia
300000
250000 Europe
200000 Oceania
150000
100000
50000
0
Figure 2.1 Annual shark catch (tons) per continent from 1970 to 2009 (adapted from Anon.,
2011)
Japanese vs global annual elasmobranch
catches
800,000
700,000
600,000
Metric tons
500,000
400,000
300,000 Japan
200,000 World
100,000
0
Year
Figure 2.2 World and Japanes annual catches of elasmobranch (sharks, rays and skates) from
1948 to 1995 (metric tons) (adapted from (Sonu & Region, 1998)
7Stellenbosch University http://scholar.sun.ac.za
Shark industry in sub-equatorial Africa
There has been very little long-term data monitoring of chondrichthyan catches and fishing efforts
in sub-equatorial Africa (Fowler, 2005). That long-term data that is available for this area has been
recorded by the Natal Sharks Board in South Africa. In sub-equatorial Africa, increasing demands
for chondrichthyan products locally and internationally (Clarke et al., 2005) have motivated
changes in local fisheries efforts. Such changes include the landing, drying, stock-piling and
movement of large quantities of shark fins though major South African cities, such as Cape Town
(Fowler, 2005). Kenya and Tanzania have substantial shark meat markets, with imports to Kenya
from its neighbouring countries (Fowler, 2005). Kenya and South Africa act as African
transhipment points for dried fins (Fowler, 2005).
Probable and possible major fisheries for cartilaginous fishes in the sub-equatorial Africa
region include longline and drift gillnet by-catch of large oceanic sharks, semi-oceanic sharks and
batoids (rays and skates) as part of the international high seas fisheries for scombroids (important
marine food and game fishes found in all tropical and temperate seas). The bottom-trawl by-catch
of sharks, batoids and chimaeras, which form part of the hake fisheries off South Africa and
Namibia, also contribute to the catch. Chondrichthyans currently make up 11.6% of the total catch
by weight of this inshore trawl catch (Attwood et al., 2011). The sole fishery off South Africa and
the prawn fishery off the KwaZulu-Natal coast of South Africa and Mozambique also land
cartilaginous fish as by-catch (Fowler, 2005).
South Africa is not listed under the Top 20 shark fishing countries in the world (Lack & Sant,
2011), but it is, after Tanzania, the country with the most reported shark landings in sub-equatorial
Africa (Fowler, 2005). Those landings reported by the FAO (Table 2.2) are significantly
underestimated because these do not include the large chondrichthyan by-catch of demersal trawl
fisheries that is largely discarded in this region (Fowler, 2005).
Shark industry in South Africa
In a TRAFFIC Network Report, Rose (1996) listed South Africa as the only African country
reporting a directed shark fishery on an industrial scale. Recently, however, due to concerns about
high pelagic shark catches, these fisheries were phased out and incorporated into the tuna and
swordfish longline fishery with a 2 000 ton limit on by-catch (DAFF, 2011). Fowler (2005) also
reported that South Africa is the only country in sub-equatorial Africa reporting substantial yields
(>1 000 tons in aggregate over 1985 - 2000) in terms of shark production and trade. South Africa
produced 95 – 454 tons per annum of frozen shark meat and 52 – 66 tons per annum of shark fin
from 1998 to 2000 (Fowler, 2005).
8Table 2.2 Elasmobranch landings (metric tonnes) by country within the Subequatorial African region as reported to FAO (2002) (adapted from
(Fowler, 2005)
Country 1990 1991 1992 1993 1994 1995 1996 1997 1998 1999 2000
Angola 500 35 703 889 603 970 400 106 1 126 1 399 750
Comoros - - 58 58 - - - - - - -
Dem. Rep. of the
748 580 596 597 445 380 315 250 185 120 45
Congo
Rep. of Cote d’Ivoire 255 297 379 335 256 258 288 501 407 265 762
Gabon - - -Stellenbosch University http://scholar.sun.ac.za
History
Although sharks have long been utilised for their fins, skins, meat and for the production of
fertilisers and oils, the first reported directed shark fishery in South Africa was initiated in the early
1930s off Durban, catching 8 609 elasmobranches of which 6 681 were sharks (Kroese et al.,
1995). The shark industry was greatly stimulated during the Second World War by the increasing
demand for vitamin A due to the disruption of cod fishing activities in the North Seas (Kroese et al.,
1995). Research conducted in South Africa found that shark livers contain oil suitable for vitamin A
production and a shark fishery was initiated in around 1941 (Van Zyl, 1992). At this time, catches
of up to 1 500 sharks were made per trip, each trip lasting about a week (Van Zyl, 1992). The
artificial synthesis of vitamin A led the market for shark liver to collapse in 1950 (Lees, 1969; Van
Zyl, 1992). Vitamin A production from shark liver continued in decreasing quantities until 1975,
although sharks continued to be caught as by-catch and were exported as dried and/or salted meat
to central Africa and as frozen carcasses to Europe, the Far East and Australia (Kroese et al.,
1995). Between 1968 and 1972, the demand for dried fish from Africa decreased drastically,
presumably due to unacceptability of products from South Africa following decolonisation in these
consumer countries. Consequently, most of the catch was sold frozen to Europe, the Far East and
Australia (Kroese et al., 1995). Shark catches, however, still continued and were reported as
144 832 landings in 1973 (Kroese et al., 1995). The discovery of high mercury levels in shark meat
in Australia (Walker, 1976) led to the severe restriction on international marketing of shark products
(Kroese et al., 1995). As a result, the demand for shark meat fluctuated between 1975 and 1990.
Sharks processed for consumption were limited to smaller, younger sharks to avoid the risk of high
mercury levels accumulated in larger, older sharks. Since then, the demand for shark meat and
fins has shown a steady increase with approximately 18 tons of fins being exported from South
Africa in 1993, of which 14.6 tons was destined to Hong Kong and 3.3 tons to Japan (Stuttaford,
1995).
Shark catches
The total annual shark catches in South Africa is estimated at 3 500 tons with a significant increase
in numbers over the past decade (Table 2.3). These were reported to be 0.36% of global shark
catches in 2009 (Anonymous, 2011) and contributed approximately 0.3% (by mass) of South
Afica’s total commercial landings between 1979 and 1991 (MCM, 2010).
As most sharks caught are taken as by-catch, it has been difficult to record exact numbers
of sharks caught and landed. Fisheries that have an impact on sharks and elasmobranches in
South Africa include demersal fisheries, longline fisheries, commercial line fisheries and shore-
operated net fisheries as discussed below.
10Stellenbosch University http://scholar.sun.ac.za
Demersal fisheries
Based on fishery-independent demersal trawl survey data, South Africa’s commercial trawl by-
catch was estimated to be 22 000 tons in 1986 (Compagno et al., 1994). The annual by-catch in
the KwaZulu-Natal prawn fishery has been estimated to be approximately 315 tons, with about
75% consisting of teleosts and 15% elasmobranchs (Fennessy, 1994b; Fennessy, 1994a). Most of
the teleosts are discarded, except for some commercially important species (about 17% of catch)
and all the elasmobranches are discarded (Fennessy, 1994a; Fennessy, 1994b). In commercial
trawl fisheries in South Africa most of the elasmobranch by-catch is discarded, except for St.
Joseph (Callorhinchus capensis), soupfin (Galeorhinus galeus) and smoothhound (Mustelus spp.)
sharks, which are preferentially retained (Attwood et al., 2011). Shark landings in the trawl fishery
represent less than 0.2% for the offshore fishery, but approximately 10% for the inshore fishery
(Kroese et al., 1995), which is responsible for the greatest catch of a number of demersal sharks
and other cartilaginous fish species (MCM, 2010). The impact of demersal fisheries on the status
of elasmobranch stocks is unknown, however, it is known that the majority of elasmobranchs
caught in trawls are discarded at sea (Kroese et al., 1995). More recent recordings show that shark
catches from deep sea trawlers in South Africa in 1997, 1998, 1999 and 2000 were 8 tons, 5 tons,
4 tons and 4 tons, respectively (Warman, 2003; Warman, 2004).
Longline fisheries
Demersal – Limited data is available on elasmobranch longline catches in South Africa during the
80’s, but landings of approximately 73 tons of sharks per annum (1987 - 1990), mostly soupfin
sharks, were reported by Dudley & Compagno (1994). At the end of 1990, shark-directed demersal
longlining was prohibited (Japp, 1993) and specific permits were required for shark-directed
longlining in South African waters. By 1996, 31 permits issued between 1991 and 1994 were in use
(Kroese et al., 1995). An increase in international demand for fresh shark meat in the early 1990s
motivated the targeting of certain shark species, primarily soupfin shark (G. galeus) and
houndshark (Mustellus spp.) found in shallower inshore waters (Kroese et al., 1995). From 1998,
permits were again reduced due to poor fishery performance, with only six permits remaining since
2008 (MCM, 2010; DAFF, 2011).
The average catch per unit effort (CPUE) during 1992 to 1994 was 1 017 kg (dressed
weight)/1 000 hooks for mako shark (Isurus oxyrhinus) and 787 kg (dressed weight)/1 000 hooks
for soupfin shark (G. galeus) (Kroese et al., 1995). Since then these sharks, amongst others, have
been increasingly exploited, as seen for soupfin shark and three other shark species in Table 2.3.
From this data it is clear that smoothhound sharks are the most commonly caught shark in the
South African demersal longline fisheries over the past few years.
11Stellenbosch University http://scholar.sun.ac.za
Pelagic – The domestic pelagic longline fishery originally only targeted tuna and swordfish, with
sharks as a by-catch. The foreign pelagic tuna-directed fisheries consists mainly of Japanese and
Chinese vessels, which target offshore oceanic species such as mako sharks (l. oxyrhinus), blue
sharks (Prionace glauca), silky sharks (Carcharhinus falciformes) oceanic whitetip sharks
(Carcharhinus longimanus), thresher shark (Alopias vulpinus, A. pelagicus and A. superciliosus),
scalloped hammerhead (Sphyrna lewini) and porbeagle sharks (Lamna nasus) (MCM, 2010;
DAFF, 2011).
Table 2.3 Shark catches for demersal longline fisheries (kg dressed weight) (1992 – 2011)
Smoothhound Requiem
Year Soupfin sharks Cow sharks Total
sharks sharks
1992 13955 - - - 13955
1993 5497 - - - 5497
1994 47946 79 - 30 48055
1995 43476 1141 - 433 45050
1996 47582 35 3 30 47650
1997 2015 20 - - 2035
1998 18540 7068 862 243 26713
1999 77129 27111 6675 1118 112033
2000 53546 53263 22290 2607 131706
2001 17865 4723 1771 3171 27530
2002 8230 1503 1870 870 12473
2003 5497 - 1700 - 7197
2004 9922 5210 3007 180 18319
2005 2306 - 3103 1250 6659
2006 7992 21594 20327 46 49958
2007 9806 41579 31328 250 82963
2008 34025 64108 30098 2003 130234
2009 40496 56447 61586 1014 159543
2010 119703 121273 57398 1850 300224
2011 36995 75577 20429 25 133026
The total catches of pelagic sharks have increased sharply since 2003, from 394 to 537 tons in
2008, due to high market values and export markets to Europe and Asia (MCM, 2010). In 2010 the
pelagic shark fishery landed shortfin mako (515 tons), blue sharks (198 tons), bronze whalers (25
tons) and skates (9 tons) and the large pelagic longline fishery landed shortfin mako (66 tons) and
12Stellenbosch University http://scholar.sun.ac.za
blue sharks (100 tons) (DAFF, 2011). Aiming to decrease pelagic shark catches, this shark
directed fishery was terminated and incorporated into the tuna- and swordfish-directed longline
fishery in 2011 by issuing large pelagic rights to shark fishers, with a by-catch limit of 2 000 tons
(DAFF, 2011).
Commercial line fisheries
This is the oldest fishery to have fished specifically for sharks and has been responsible for the
biggest shark landings. Shark targeting has fluctuated greatly due to market demand. Even though
an increased demand for shark products since 1991 has caused an upswing in the targeting of
sharks and an increased numbers of shark landings, few commercial handline fishermen target
sharks, but rather these fishermen target line fish for the more lucrative fresh fish market (Kroese
et al., 1995).
Sharks are targeted by line-fishermen mainly when teleost catches are low, or they are
caught as a by-catch when targeting teleost species (Kroese et al., 1995). The main shark species
targeted by line-fishermen are soupfin sharks (G. galeus) and houndsharks (Mustellus spp.).
Directed shark fishing is mainly concentrated on the southwest coast, with other fisheries operating
primarily inshore off the south and east coast of South Africa. Other chondrichthyans being
domestically caught include dusky sharks (Carchanrhinus obscures), copper sharks (C.
brachyurus), spotted gully sharks (Triakus megalopterus), thresher sharks (family Alopiidae), cow
sharks (family Hexanchidae), dogfish (Squalus spp.), catsharks (Poroderma spp.) and rays (family
Dasyatidae). Of these, only a few are usually landed and the rest are discarded. Even though
these sharks are discarded at sea, most sharks brought on deck are killed to simplify hook removal
and then discarded, meaning that many more sharks are killed at sea than those that are being
landed (Kroese et al., 1995). Major shark catches in 2010 were reported as soupfin (89 tons),
houndsharks (25 tons), Carcharhinid sharks (64 tons), blue sharks (13 tons) and skates (59 tons)
(DAFF, 2011).
Shore-Operated Net Fisheries
A shark-directed commercial net fishery targeting St. Joseph shark (C. capensis) was established
in the 1980s with an original catch of approximately 650 tons of St. Joseph shark per annum
(DAFF, 2011). Commercial nets used traditionally include surface drift-nets, set-nets anchored at
the bottom and beach-seine nets (Kroese et al., 1995). The only nets targeting sharks in South
Africa are in a legal bottom-set drift-net fishery for St. Josephs, an experimental beach seine
fishery for sandshark (Rhinobatus annulatus), and an illegal gill-net fishery in the Langebaan
estuary targeting houndsharks (Mustelus spp.) (Kroese et al., 1995). Elasmobranch by-catch in
beach seine nets targeting southern mullet (Liza richardsoni) in the False Bay area represent about
1.4% of the total catch (larger percentage by weight) (Lamberth et al., 1994). Of the elasmobranch
catch, skates and rays constitute almost 70% and sharks 30%, of which 15.9% are St. Joseph and
12.6% are smoothhound (M. mustelus) sharks (Kroese et al., 1995).
13Stellenbosch University http://scholar.sun.ac.za
Kroese et al. (1995) reported that approximately 5 tons (dressed weight) of houndshark are
caught per month in an illegal houndshark fishery in the Langebaan estuary. These sharks are
caught in shallow waters, which is probably a breeding and nursery area for smoothhound sharks
(Kroese et al., 1995).
Annual shark catches by beach seine and drift nets in South Africa in 1998, 1999 and 2000
were recorded as 14 tons, 100 tons and 100 tons, respectively (Warman, 2003; Warman, 2004).
Total shark catches in South Africa
Annual catches of different species of sharks, rays and chimaeras recorded or calculated by the
FAO are depicted in Table 2.4 (Anonymous, 2011). From this data it is calculated that
smoothhound sharks make up about 3% of the total catch of sharks, rays and chimaeras per year
in South Africa. Table 2.5 provides information on the total catches, landings and values of shark
per fishery per year in South Africa. Although some data are absent, it can be seen that the landed
price as well as the landed value of shark has increased over these three years (1998 - 2000).
Shark processing
Fowler et al. (2005) reported that South Africa and Senegal were the only countries reporting
substantial production of more than 1 000 tons of shark products in aggregate over the period of
1985 to 2000. South Africa produced 95 – 454 tons per annum of frozen shark meat from 1998 to
2000 (Fowler et al. 2005).
In South Africa, areas of inshore and demersal shark landings include Port Elizabeth,
Mossel Bay, Vlees Bay, False Bay, Hout Bay, Gans Bay and Struis Bay. Large pelagic longliners
land in Cape Town and Richards Bay. South Africa has four shark processing facilities (Fig. 2.3), of
which three include Fishermen Fresh situated in Port Elizabeth, Eastern Cape (1), Selecta situated
in Mitchell’s Plain, Western Cape (2) and Xolile situated in Strand, Western Cape (3). Figure 2.3
shows the location of these three facilities as well as their areas of operation.
Small spotted gully sharks and two smoothhound species, M. mustelus and M. palumbes,
are all processed and sold under the name gummy sharks. Bronze whaler sharks (Carcharhinus
brachyurus), dusky sharks (Carchanrhinus obscures) and blacktip sharks (Carcharhinus limbatus)
are all processed under the name bronzies. Blue shark and mako shark make up a small
percentage of the sharks being processed (Da Silva 2007).
Shark meat is classified as “good”, “bad” or “big” by the industry (Da Silva 2007). “Good”
sharks are those with high value flesh (smoothhound sharks, bronze whalers and soupfin shark) or
good meat quality. The term “bad shark” describes sharks of lower value flesh (the larger spotted
gully shark, hammerhead sharks and blue sharks) or inferior meat quality. “Big” sharks refer to
sharks of large sizes that are not fit for human consumption due to the potential for high amounts
of mercury to be present in their flesh.
14Table 2.4 Catches of sharks, rays and chimaeras (tons) in South Africa (Anonymous, 2011)
Land Area Species 2000 2001 2002 2003 2004 2005 2006 2007 2008 2009
South Africa Sharks, rays, chimaeras
Blue shark - 83 94 265 169 212 117 199 140 257
Broadnose sevengill shark 0 0 0 0 0 0 0 4 12 12
Cape elephantfish (St. Joseph) 380 405 422 524 559 645 749 702 585 623
Copper shark 0 1 0 0 0 1 2 20 29 64
Rays, stingrays, mantas nei* 1009 1152 1300 1507 1653 0 1220 1021 0 1
Sharks, rays, skates, etc. nei* 410 167 357 209 435 1680 419 293 864 807
Sharptooth houndshark 0 0 0 0 0 0 0 6 0 2
Shortfin mako - 79 31 147 659 689 453 548 48 491
Smoothhound - 4 2 1 24 81 81 90 76 85
Thresher 0 2 - - - 4 1 3 5 2
Tope shark - 16 19 26 219 163 204 297 290 257
Total Sharks, rays, chimaeras 1800 1909 2226 2679 3718 3475 3246 3183 2049 2601
* Not elsewhere included
15Stellenbosch University http://scholar.sun.ac.za
Table 2.5 South African shark catches, landings and values per fishery per year (1998-2000)
(Warman, 2003; Warman, 2004)
Nominal catch Landed mass Landed price Landed value
Fishery Year
(t) (t) (R/t) (R’000)
SA Inshore 1998 214 89 479 43
1999 117 49 507 25
2000 117 49 3 000 147
SA line fish 1998 300 - - -
1999 323 - 6 000 1 711
2000 312 - 6 000 1 872
SA Misc nets 1998 6 9 3 100 19
1999 100 100 3 000 300
2000 100 100 3 240 324
Figure 2.3 Map of South Africa showing distribution of shark fisheries and processing plants
with their areas of operation marked with corresponding numbers (Da Silva, 2007) (1) =
fishermen fresh, (2) = Selecta and (3) = Xolile
16Stellenbosch University http://scholar.sun.ac.za
Low meat quality refers to meat that is flaky or is slightly translucent in colour. This quality
is usually determined by the initial handling and processing of the sharks. Larger sharks should not
be picked up by their tails as this can cause the meat to ‘tear’ and become flaky (a phenomenon
very similar to “gaping” found in traditional marine and fresh water fish).
For “good” quality shark meat, the sharks should be bled, beheaded and eviscerated
immediately after capture, or within two to three days if refrigerated (Vannuccini, 1999). Bleeding
must be performed immediately after capture by cutting the shark behind the head or just in front of
the tail, letting it bleed for about 2 minutes or until most of the blood has drained from the carcass.
The size of sharks classified as “big” is different for different species because some sharks grow
faster than others and will therefore only reach potentially toxic levels of mercury at a larger size
than other species. There is currently, however, a lack of information or guidelines on species-
specific sizes relating to which sharks are classified as “big”.
Shark handling in a typical South African shark processing facility
The following information was obtained from a shark processing facility, Xolile, situated in Strand,
Western Cape. Xolile is one of the four shark processing and export plants in South Africa. An
average of 7 – 8 tons of shark is processed at this processing plant per month. All of the sharks are
caught by hand line, being supplied by fishermen along the South Coast of South Africa, from Port
Elizabeth to Cape Town (Fouche, 2011).
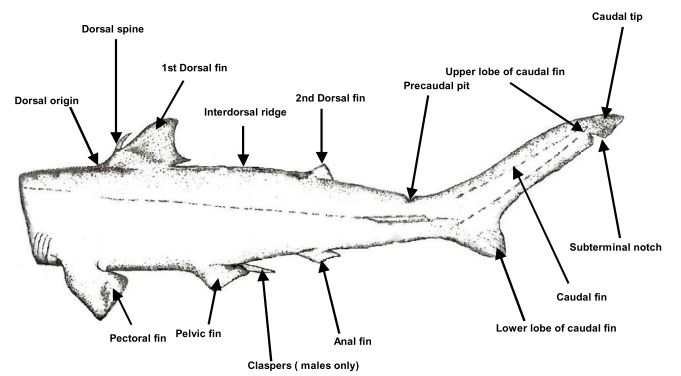
The sharks are euthanized and bled on the boat immediately after capture. Bleeding
involves cutting the sharks behind the head, in line with the last gill slit and at the precaudal pit,
perpendicular to the length of the shark. A cut is made along the ventral side from the anus (pelvic
fins) to the anal fin in order to prevent the collection of blood in this region. The sharks are gutted
and their heads are removed immediately after landing, after which they are transported to the
processing facility without ice or cooling. When the sharks are received at the processing unit (0 –
3 days after death, depending on where the sharks have been caught), they are immediately
packed in ice until further processing, which occurs immediately or a few hours after receiving. At
the processing plant, the sharks are filleted, skinned and the fillets are packed into boxes. The
packaged fillets are placed in a blast freezer overnight, following which they are labelled per
species and are stored in a freezer until distribution.
Sharks destined for the export market include St. Josephs, bronze whaler and
smoothhound sharks, which are purchased from fishermen at approximately R24 per kg (at the
time that this information was obtained). These sharks are mainly exported to Australia, which has
one of the biggest markets for shark meat. Sharks with meat of a lower quality, such as the blue
shark, are purchased at approximately R5 per kg, processed and distributed to local restaurants or
retailers as shark meat. Shark meat is sold in some local fish shops as ‘fish fillet’.
17Stellenbosch University http://scholar.sun.ac.za
Random spot checks are performed regularly to determine the total mercury and cadmium
contents of the shark meat, and the entire batch is discarded if mercury levels above 1 mg·kg-1
(1 ppm) are detected in the meat. Mercury serves as an indicator of the heavy metal content of
shark meat, as this metal is generally the first to reach the upper legal limit if the heavy metal
content is high (Fouche, 2011).
Exports
By 2005, the only countries in the sub-equatorial African region reporting exports exceeding 100
tons per annum of frozen shark were South Africa and Angola, with South Africa also playing a
major role in shark fin exports to China. The FAO reported annual shark fin exports from South
Africa at 52 - 66 tons whereas Hong Kong customs records showed imports from South Africa of
approximately 195 tons in 2000 (Fowler, 2005). South African records show that the quantities of
dogfish and other sharks exported as frozen fish in 2001 and 2002 amounted to 406 tons with a
value of about 6 million Rand, and for 2002 and 2003 amounted to 445 tons with a value of 9.6
million Rand (Warman, 2003; Warman, 2004). Exports of shark fins in 2001 and 2002 were
recorded at 49 tons with a value of 10 million Rand, while for 2002 and 2003 these were recorded
at 14 tons with a value of one million Rand (Warman, 2003; Warman, 2004).
As is evident from Table 2.6, shark meat is also being imported into South Africa from a
number of countries. It is, however, unclear what this shark meat is currently being used for. South
Africa is also part of the shark fin trade, as can be seen in Table 2.7, with exports mainly to Eastern
countries. The income for these products is extremely high as shark fins are one of the world’s
most expensive seafood products.
Shark products
Most parts of sharks have been used in some way in the past, including the flesh, skin, liver,
cartilage, teeth and fins. In some countries, the consumption of intestines, stomach, heart and skin
is also common. Other products commonly made from sharks include fish meal, fertiliser, as well
as liver oil, which is high in Vitamin A. Shark meat is consumed salted, dried or smoked in many
communities (Walker, 1998). Dried and salted shark meat is popular as this processing method
provides a convenient form in which to transport the product in areas where shelf-life would
otherwise be limited (Vannuccini 1999).
Shark fin soup has been regarded as a delicacy in China for more than 2 000 years
(Walker, 1998) with a value of up to R5 000 per kg (Hareide et al., 2007). In some fisheries, only
the meat is retained and the rest is discarded, while in other fisheries only the fins, liver or skin are
retained. Few fisheries utilise all parts of the animals (Walker, 1998).
In many Pacific-Island countries, such as Australia, shark meat is commonly consumed as
‘fish and chips’ (Preston, 1984). Shark meat is often sold under names such as ‘flake’, ‘grayfish’,
18You can also read