THE DEVELOPMENT BANK OF SOUTHERN AFRICA CORPORATE PLAN 2020 2023
←
→
Page content transcription
If your browser does not render page correctly, please read the page content below
THE DEVELOPMENT BANK OF SOUTHERN AFRICA

CORPORATE PLAN
2020 - 2023

                                    Page | 1
Contents
1.       Executive Summary ....................................................................................................................... 3
2.       Organizational Overview ............................................................................................................... 5
2.1.           Purpose ..................................................................................................................................... 5
2.2.           Vision ......................................................................................................................................... 5
2.3.           Mission ...................................................................................................................................... 5
2.4.           Values ....................................................................................................................................... 6
2.5.           Legislative mandate and other key development imperatives.......................................... 6
2.6.           Principle Activities and Sector Focus ................................................................................... 6
2.7.           Regional Mandate ................................................................................................................... 7
3.       Corporate Strategy ......................................................................................................................... 8
3.1.           The DBSA strategic objectives: ............................................................................................. 9
3.2.           DBSA’s Key Focus Areas .................................................................................................... 10
4.       Strategic review ............................................................................................................................ 15
4.1.           Key Economic discussion areas ......................................................................................... 15
4.2.           SWOT Analysis ...................................................................................................................... 17
4.3.           Global Economic Highlights ................................................................................................. 17
4.4.           Sub-Saharan Africa Outlook ................................................................................................ 18
4.5.           South Africa Outlook ............................................................................................................. 19
5.       The Balance Scorecard ............................................................................................................... 22
6.       Annexures ..................................................................................................................................... 26
ANNEXURE A: COMPLIANCE CHECKLIST ..................................................................................... 26
ANNEXURE B: FINANCIAL PLAN ...................................................................................................... 27
ANNEXURE C: CORPORATE GOVERNANCE FRAMEWORK ..................................................... 37
ANNEXURE D: EMPLOYMENT EQUITY PLAN ................................................................................ 52
ANNEXURE E: FRAUD PREVENTION PLAN ................................................................................... 53
ANNEXURE F: FUNDING PLAN AND BORROWING PROGRAMME .......................................... 57
ANNEXURE G: RISK REGISTER ........................................................................................................ 65
ANNEXURE H: BUSINESS CONTINUITY MANAGEMENT ............................................................ 76
ANNEXURE I: DBSA ENVIRONMENTAL & SOCIAL FRAMEWORK .......................................... 79

                                                                                                                                                    Page | 2
1. Executive Summary

The Development Bank of Southern Africa (DBSA) is a leading development finance institution
(DFI), wholly owned by the South African Government. The DBSA has a mandate to promote
economic growth as well as regional integration, by mobilising financial and other resources from
the national and international private and public sectors, for sustainable development projects
and programmes in South Africa, SADC and the wider African continent.

The development position of the DBSA was approved by the Board in 2018. The position outlines
the ethos of the DBSA and forms the departure point from which the DBSA delivers on its
mandate. Furthermore, taking from our renewed purpose statement “Building Africa’s
Prosperity” the DBSA looks to drive inclusive growth and find innovative solutions to spur socio-
economic development across the African continent.

Infrastructure is a critical driver of economic growth with State Owned Entities (SOEs),
government and other government agencies contributing the majority of capex funding for
infrastructure. As such, DBSA’s 2020 – 2023 strategy is designed to place Africa’s transformation
at the center of the Bank’s development agenda. To improve the quality of Africa’s growth, it aims
to broaden and deepen the process of transformation by ensuring that growth is shared and
equitable for all African citizens and countries. It also aims to bring about growth that is not just
environmentally sustainable, but also economically empowering.

Adverse domestic economic conditions in recent times have limited infrastructure projects and
hampered the DBSA’s growth projection, slowing DBSA’s asset book growth and thus placing
attention on maintaining the financial sustainability of the Bank. In solutioning for this, the 2020-
2023 strategy extends the Bank’s role to conceptualize infrastructure projects through a
programmatic approach that is needed to solve pressing socio-economic challenges at scale
and drive the implementation of government’s policy priorities.

The strategy addresses key factors in the macro- and micro-environment while capitalizing on the
successes and strengths of the Bank. The strategy builds the resilience and relevance of the Bank
for the future, in order to:

    ▪   stimulate economic activity in a challenging economic climate with muted growth
        forecasts;
    ▪   develop solutions for the creation and implementation of infrastructure projects;

                                                                                             Page | 3
▪   dedicate the Bank’s implementation expertise to facilitate government’s economic and
       social transformation policies;
   ▪   capitalize on its role as a DFI to convene and co-ordinate smart partnerships;
   ▪   drive development impact beyond hard infrastructure build;
   ▪   leverage evolutionary changes brought about by technology;
   ▪   ratify environmental policy in response to climate change;
   ▪   promote the financial sustainability of the Bank;
   ▪   build on DBSA strengths in mobilising large-scale programmes that have proved
       successful (IP4O; SHIP);
   ▪   optimize its core operations to drive a development dividend that can address socio-
       economic growth in innovative ways.

DBSA’s approach is to align with governments’ priorities such as the National Development Plan
(NDP) and the Sustainable Development Goals (SDGs) in promoting inclusive growth. These
priorities are further entrenched through DBSA’s Environmental and Social Management
Framework, as well as its management of the Green Fund in supporting green initiatives.

Partnerships are critical to driving this programmatic approach in a SMART manner. DBSA
seeks to partner with the private sector as well as government agencies and departments, to drive
the collaboration needed for project success. SMART partnerships enable the co-creation of fit-
for-purpose solutions which are both scalable and sustainable.

Implementation is a key government focus area within governments’ policy priorities and seeks
to deliver impactful development solutions and promote inclusive growth. In this way, DBSA seeks
to leverage our implementation capabilities to impact the lives of our people, which will drive the
relevance of DBSA for the future.

Driving a DBSA relevant to the future lies in recognizing constant change as the natural order of
things. As such, DBSA looks to create inclusivity in the work-environment that embraces this
change to face the uncertainty with confidence and enthusiasm. This transformation requires a
workforce that is adaptable, high performing, agile, and accountable and delivers with integrity.
Thus, we have to build a future fit DBSA to enhance our internal capacity and skills to ensure
delivery of the required infrastructure.

The DBSA’s innovation spearheads the Bank’s future trajectory in the secondary economy. This
“business unusual” concept seeks to create solutions that have a direct impact in transforming

                                                                                           Page | 4
our informal economy. There are moonshots initiatives that are driven to challenge the way in
which DBSA looks to deliver development impact.

   2. Organizational Overview

The DBSA has its primary purpose firmly embedded in stimulating socio-economic growth given
its infrastructure and human development mandates. This includes infrastructure finance and
development, human resource development and institutional capacity building.

   2.1.    Purpose
The renewed purpose statement of the DBSA is to “Build Africa’s Prosperity”. Underpinning
this purpose is the DBSA’s Development Position, an ethos to “Bend the Arc of History toward
Shared Prosperity.” At the DBSA, this means contributing to a just transition toward a renewed
and inclusive economy and society that embodies resilience, regeneration, and transcends
current trajectories. As a development practitioner, the DBSA regards this as the transformative
change needed to realize a prosperous, integrated and resource efficient region. This stance
progressively advances the common goals for sustainable and equitable wellbeing. The DBSA
will work in partnerships to co-produce impactful development solutions and sustained platforms
of an enabling environment for participation, a sense of purpose, empowerment and deep
connections. DBSA will bend the arc of history through our continued multi-faceted investments
in sustainable infrastructure and human capacity development.

   2.2.    Vision
“A prosperous and integrated resource efficient region, progressively free of poverty and
dependency”

   2.3.    Mission
DBSA’s mission is to advance development impact in the region, by expanding access to
development finance and effectively integrating and implementing sustainable development
solutions to:
   ▪   Improve the quality of life through the development of social infrastructure
   ▪   Support economic growth through investment in economic infrastructure
   ▪   Support regional integration
   ▪   Promote sustainable use of scarce resources

The DBSA seeks to effect economic growth that is correlated to the improvement in the quality of
the lives of our people.

                                                                                        Page | 5
2.4.    Values
The values that underpin the DBSA’s operations are:

   ➢ Shared Vision - we share and keep the sustainability, strategic intent and mandate of the
       DBSA top of mind in all our decisions and actions
   ➢ Service Orientation - we deliver responsive and quality service that speaks to the need
       of our clients and continuously build relationships that result in win-win outcomes
   ➢ Integrity - our deals, interactions and actions are proof of transparent and ethical
       behaviour that show respect and care for all our people (employees, stakeholders,
       shareholders, clients and communities)
   ➢ High-performance - we are enabled, empowered and inspired to deliver consistent
       quality, effective and efficient results for which we are accountable and rewarded
   ➢ Innovation - we challenge ourselves continuously to improve what we do, how we do it
       and how well we work together.

   2.5.    Legislative mandate and other key development imperatives
The DBSA Act sets out the role and function of the DBSA as a DFI with a sharp focus on
infrastructure development, especially in Southern Africa.

The DBSA’s mandate and strategy are aligned with the South African National Development Plan
(NDP) Vision 2030 and Integrated Urban Development Framework (IUDF), United Nations
Sustainable Development Goals (SDGs), the African Union’s Agenda 2063 and the Paris
Agreement on Climate Change. DBSA is further regulated by the Public Finance Management
Act No 1 of 1999 (PFMA) and operates in terms of the King Code of Governance Principles for
South Africa 2016 (King IV).

   2.6.    Principle Activities and Sector Focus
The DBSA participates across the infrastructure value chain and provides planning, project
preparation, financing, and implementation support for economic and social infrastructure in
South Africa, SADC and the rest of the African continent:

                                                                                             Page | 6
Convene public and private sector platforms to drive programmes
                    that solve infrastructure development needs

2.7.   Regional Mandate
South Africa has concluded various binational- and trade agreements with countries across
the continent to support broader regional integration in line with the SADC Integrated
Infrastructure Development Plan, the Programme for Infrastructure Development in Africa
(PIDA) and AU Africa 2063. DBSA’s regional development and integration strategy is largely
aimed at SADC, it broadly includes countries outside of SADC for selected regional economic
communities, for example the tripartite free trade area linking SADC, COMESA and EAC as
well as corridor development. The three main pillars of the Tripartite Strategy include market
integration, infrastructure development and industrial development. For continental and
national strategic consideration, the DBSA may consider investments outside the country only
with the authorisation from the National Treasury. Consequently, opportunities will be
explored in the following countries outside SADC:

                                                                                      Page | 7
EAC (6)              ECOWAS (15)           Other non-SADC countries
         Burundi                   Benin                 Cameroon
         Kenya                     Burkina Faso          Djibouti
         Rwanda                    Cote D’Ivoire         Eritrea
         Uganda                    Cabo Verde            Ethiopia
         South Sudan               Gambia                Gabon
                                   Ghana
         Tanzania (member of       Guinea
         SADC)
                                   Guinea-Bissau
                                   Liberia
                                   Mali
                                   Niger
                                   Nigeria
                                   Senegal
                                   Sierra Leone
                                   Togo

    3. Corporate Strategy

The DBSA’s Corporate Strategy centers the DBSA’s focus on a “market-making” role to
conceptualize sustainable infrastructure projects that are needed to build socio-economic
growth. This entails using our expertise and smart partnerships to co-create solutions for a just
transition.

By leveraging on its role as a DFI, DBSA addresses socio-economic gaps by convening the public
and private stakeholders needed to create infrastructure projects, in order to spur growth. As
such, initiating a programmatic approach to address infrastructure backlogs and implement
policy priorities enables the DBSA to build infrastructure that serves the country.         This
programmatic approach enhances the DBSA’s value proposition to society.

The strategy continues to build on the catalyzation model of 2016, to consider the DBSA’s role as
a DFI in mobilising funds. This allows DBSA to crowd-in private financial institutions to
participate in infrastructure financing for development impact. The strategy is further delivered
through driving implementation that makes a difference in the lives of our people.

                                                                                         Page | 8
3.1.    The DBSA strategic objectives:
The strategy of the DBSA is guided by pillars of financial sustainability, strong governance as well
as accelerating and enhancing development impact.

The following strategic objectives drive the strategy:

   1. Financial sustainability

Drive disbursements and asset growth to maintain profitability and operational efficiency thereby
enabling growth in equity and fund innovative developmental activities.

   2. Accelerating Development Impact

Accelerating development impact by stimulating infrastructure development through a
programmatic approach, which conceptualizes projects, for a secure and scaled development
trajectory, aligning with the socio-economic challenges in the country. The Bank seeks to give
effect to the government’s implementation ambition through an enhanced focus on
implementation of key government infrastructure priorities, including the One Plan under Local
Government.

                                                                                            Page | 9
3. Building Future Fit DBSA

Harnessing the power of 4IR to drive internal efficiencies. Maintaining DBSA’s relevance through
a future-fit workforce and an enabling environment.

   4. SMART Partnerships

SMART Partnerships are purpose-driven collaborations that co-create development solutions and
enhances private sector participation in infrastructure projects that promote inclusive growth.

   3.2.    DBSA’s Key Focus Areas
The DBSA has elevated seven key focus area’s that enhance the delivery of the DSBA’ strategy:

  1. Building organizational sustainability by converting transactions to drive disbursements.

   In the context of the DBSA’s vast experience in managing project preparation funds, including
   amongst others, the European Union-funded Infrastructure and Investment Project for South
   Africa (IIPSA), the DBSA has been tasked with leading this initiative, with R400 million
   allocated to the Bank for this purpose. In deploying the facility, the Bank will partner with the
   Government Technical Advisory Centre and the Presidential Infrastructure Coordinating
   Commission. This facility will assist in identifying and developing Bankable projects both in
   core-economic and social-infrastructure sectors. Proper project identification, comprehensive
   preparation, and appropriate structuring will be key to maximizing investment and ultimately
   magnify development outcomes within the narrow confines of our ever-shrinking fiscal
   headroom. Other initiatives include the development and rollout of new instruments and
   financing structures all seeking to solve for obstacles to accelerated development.

   ▪   SA Infrastructure Platform - a blended finance solution

   The purpose of the proposed vehicle is to create an infrastructure platform that serves as a
   national delivery agency for the preparation of economic, socio-economic and social
   infrastructure at scale. This will include concept development, preparation, structuring and
   procurement at scale for national infrastructure programmes.

                                                                                          Page | 10
2. Building a Digital DBSA
i. Overcoming our stumbling blocks and rewiring legacy systems through
transforming core business processes
ii. Responding to customer needs to fundThe municipal sector makes up 33% of the total loan book of the DBSA and is thus a critical
market segment. Whilst the focus of our lending activity remains on the funding of capital
expenditure programmes, given the constrained economic environment and the municipal
debt capacity, there is a need for the municipalities to diversify their revenue sources as well
as prioritise the projects for funding.
Municipalities tend to emphasise their funding on social transformation capital expenditure
projects in line with national priorities such as service delivery backlogs and increasing
access to services, whilst having a limited capacity to identify and structure economic
projects. The DBSA’s approach prioritises off-balance sheet or limited recourse programmes
and projects by focusing on developing innovative project finance and other structuring
solutions. Further to this, the Bank looks to capacitate the municipalities through the creation
of Project/Programme Management Units (PMU), providing revenue enhancement and
capacity support, infrastructure maintenance and project implementation support.
For Metro’s the Purpose of the PMU is to:
▪ Develop a project gateway – enhancing the systems, processes and increasing capability
▪ Develop a Long-Term Financial Strategy – packaging off balance sheet projects
▪ Providing Technical Assistance – project feasibility and de-risking projects
▪ Smart City – providing the capacity to transition to a smart city and prioritise required plans
Dedicated engagements with Metros seek to finance viable financial solutions that aim to
ensure delivery of critical infrastructure projects.
The support for under-resourced municipalities focuses on various initiatives both financial
and non-financial. Over and above the establishment of project management units in targeted
municipalities, there is also capacity building and support provided. The Bank has
established five Program Management Units in Limpopo, Eastern Cape, Northern Cape,
Western Cape and Mpumalanga. The intention is for the DBSA and private sector partners
to resource the PMU in provincial COGTA departments, and support lending and non-lending
products and services in municipalities. This strategic partnership is aimed at leveraging on
each partner’s resources and delivery capacity to drive the collaboration needed for program
and project success.
In addition to the aforementioned, the secondary municipalities are supported through
DBSA’s intent to improve municipal creditworthiness, scale up and accelerate infrastructure
Page | 12through DBSA’s origination teams actively crowding-in the private sector. In this role the
DBSA assumes the required financial risk positions to attract private sector investment.
DBSA will also support national COGTA department in its District Delivery Model through the
establishment and resourcing of the Program Coordinating Office (PCO), including the
development of the information management system for the monitoring and reporting on the
roll out of the model. As such, the DBSA will contribute R67mn during the 2020/21 financial
years towards profiling and providing diagnostic reports for 42 district municipalities and
seven metros. The project includes the establishment of a Program Implementation Unit as
well as the setting up of District Hubs in three to-be-identified pilot sites. Given, its focus on
a programmatic approach, the District Delivery Model is an ideal vehicle for DBSA to facilitate
local government support to ensure accelerated infrastructure development through
adequately resourced PIU’s. The overall objective is the creation of a single spatially
integrated government plan (One Plan), for each of the 52 IGR Impact Zones that guides
strategic investment spending, project delivery across government, and forms the basis for
accountability.
4. Catalyzing connectivity by unlocking the power of connectivity to stimulate economic
activity and growth relishing the potential of 5G and satellite technology
5. Revitalise Township and Rural Economies through supporting the development of
economic and social opportunities in underserviced areas (townships, small towns, rural)
(i) Development Labs (D-LABS)
The Bank is collaborating with like-minded private institutions, national government
departments and non-governmental organizations (NGOs) in establishing community
facilities across the country. These community facilities aim to provide access to the STEAMI
(science, technology, entrepreneurship, engineering, arts, math and innovation) educational
streams; and thereby stimulate the underserved economy to create meaningful opportunities
for entrepreneurship and job creation.
The D-LABS are development precincts within urban and rural communities where local
participants are connected to have access to digital services, emerging technologies and
coaching. The objective is to unlock entrepreneurial activity as well as access to financing
and funding. Each D-LAB is made up of key components that together create a precinct
Page | 13which supports the community and creates a safe space to unlock and realize socio-
economic potential. The D-LABS become the center of value chains with the potential to
create jobs within the Local Economic Development (LED) area of the precincts.
The key components are:
▪ Digital and Innovation Labs (4IR, maker spaces)
▪ Local Economic Development zones (SMME, micro funding, banking)
▪ Sports, Arts and Culture
▪ Health and wellbeing (Basic health care and psychosocial support)
▪ Green solutions (Water, energy and waste)
(ii) High Impact Investment Portfolio (HIIP)
The high impact investment portfolio (HIIP) aims to facilitate economic transformation by
meeting the micro-funding needs of emerging entrepreneurs. The portfolio is a response to
the current development challenges that we see in the South African and African contexts.
The fund will primarily focus on:
▪ Financing women and youth-led initiatives
▪ Servicing underserved markets
▪ Absorbing higher credit and technology risk
The Portfolio seeks to introduce key performance measures weighted with developmental
imperatives.
6. Navigating the Just Transition by contributing to an equal, sustainable and
prosperous South Africa (off the back of the transition out of fossil fuels).
This focus area includes the establishment, in collaboration with the United Nations’ Green
Climate Fund (GCF), of the first green Bank modelled sector climate finance facility in Africa.
The facility aims to de-risk and enhance the Bankability of climate smart projects to crowd-in
private sector investment.
The DBSA also intends to make its campus green. The greening of the campus will focus on
energy, water and waste management. This also allows for the opportunity to showcase
cutting-edge technologies that the DBSA is funding across our economic and social sectors.
Page | 147. Promoting the SA Incorporated Agenda with a focused SA Inc approach to inter-Africa
regional infrastructure development through bespoke credit and funding structures offered
by DBSA, Export Credit Insurance, and Industrial Development Corporation amongst
others.
4. Strategic review
The Strategic review is done to provide an analysis on the key issues that drive DSBA’s strategy.
4.1. Key Economic discussion areas
The combination of low growth and rising unemployment means that South Africa’s economic
trajectory is unsustainable. Total factor productivity growth has been negative over the past five
years – pointing to the allocative inefficiencies as well as inadequate production inputs and
innovation. This has exacerbated competitiveness issues which saw South Africa’s Global
Competitiveness rankings fall from 44th to 67 between 2007 and 20181, before improving to the
60th position in 2019.
Cabinet has agreed on a number of structural reforms that could help to arrest the downward
growth trend. The reforms aim to promote economic transformation, support labour-intensive
growth as well as create a stable and globally competitive economy. Government needs to
advance both macro- and microeconomic policy levers. Sustainable fiscal policy is intended to
reduce macroeconomic risk, lower borrowing costs and ensure that funding is available to support
the country’s development opportunities. The South African Reserve Bank has a demonstrated
track record in implementing credible and effective monetary policy and preserving financial
stability.
Compounded by drought episodes in certain parts of the economy, policy uncertainty on the
stabilization of the fiscal framework has weighed on confidence. Due to DBSA’s strong alignment
with the national economic strategy, the Bank’s credit rating is tied to the sovereign rating.
Rating agency, Moody’s, downgraded its economic outlook for South Africa from stable to
negative in 2019. The new outlook is a function of deteriorating government finances, the
1
National Treasury, 2019
Page | 15indebtedness of state-owned entities and the slow pace with which economic reforms are
implemented. However, Moody’s noted that the Baa3 rating affirmation takes into account the
“country’s deep and stable financial sector as well as the robust macro-economic policy
framework”. The flexible exchange rate has been an important shock absorber for international
financial volatility and for ensuring that capital continues to be attracted to South Africa despite a
series of domestic economic shocks.
Struggling SOEs pose serious economic risks. Government is acting decisively to mitigate such
risks. The 2019 MTBPS states that consolidated government spending totals R6,3 trillion over the
medium term, with education, social development and health sectors as priorities. The new
blended infrastructure Fund seeks to advance the prioritization of infrastructure development. The
Fund will be hosted by the DBSA. The government has set aside R100bn over the coming decade
to co-finance programmes and projects, with R10bn in the baseline.
The focus on fixing network industries will ensure that South Africa becomes a competitive global
player again. However, this requires cooperative governance where all government spheres
participate to achieve the same goals. This cooperation will provide opportunities to collaborate
with the private sector as well as to focus on enterprise development at local economy levels. The
high unemployment and poverty levels mean that the 14 000ha of land approved by Cabinet for
human settlement must be utilized urgently.
Disruptors, such as elements of the 4th industrial revolution require careful consideration in order
to prevent job losses. Climate change remains the single biggest and most unknown disruptor
with greenhouse gases raising temperatures by 2% and sparking natural disasters. Climate
change strategies will require management of the transition from coal to renewable energy
through targeted programmes. Innovation in water management technologies may combat the
drought episodes of South Africa experienced in recent years.
Page | 164.2. SWOT Analysis
The SWOT analysis is undertaken to provide a snapshot of the DBSA’s internal and external
strategic positioning.
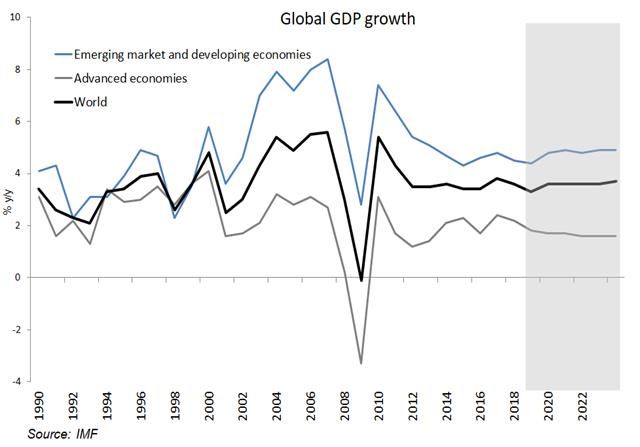
4.3. Global Economic Highlights
Following the financial crisis of 2007/08, the global economy steadily recovered through to 2017.
In 2017 and 2018, the pace of growth suddenly increased significantly, yielding the strongest
economic performance in a decade. However, there have been growing signs of a slowdown in
that pace of economic growth recently. The IMF describes the current global growth scenario as
“sluggish”. There are nonetheless positives in terms of:
• Initial signs of trade alignment between the US and China
• Early signs of manufacturing and trade recovery
• Lesser concerns with Brexit
However, these positives could be undermined by the potential coronavirus epidemic.
Page | 17Global economic growth is envisaged to be 2.9% in 2019, 3.3% in 2020 and 3.4% in 2021.
Advanced economies are expected to average 3.2% over the medium term - with economic
growth in the United States decelerating from 1,7% in 2019 to 1.6% in 2021 while the Euro Area
is expected to edge up slightly from 1.2% to 1.4% over the same period.
In 2008, monetary authorities in
developed economies lowered
interest rates and expanded
liquidity to keep bond and
equity prices up and safe from
the sub-prime crisis. Now
however, there is a slight threat
for the sustainability of the
world economy from loose
monetary policy, particularly as
it relates to debt-servicing costs
of major industrialised
countries.
The forecasts for economic growth in emerging markets and developing economies remain
considerably higher than those for advanced economies at an average of more than 4% in the
medium term. The coronavirus is likely to impact negatively on the economic growth of China
causing its forecast to be revised lower than the current 6% levels.
4.4. Sub-Saharan Africa Outlook
Economic recovery in sub-Saharan Africa (SSA) is set to continue with growth projected to be
3.3% in 2019 and 3.5% in 2020 and 2021. Across SSA economic performance is split into the
more diversified as well as the resource-dependent economies.
Real GDP (%) forecast for countries in the DBSA footprint
Oil exporters* and other resource Non-resource intensive countries
intensive countries
Country 2018 2019 2020 Country 2018 2019 2020
Angola -1.2 -0.3 1.2 Côte d'Ivoire 7.4 7.5 7.3
Botswana 4.5 3.5 4.3 Eswatini 2.4 1.3 0.5
Page | 18Congo, DRC 5.8 4.3 3.9 Ethiopia 7.7 7.4 7.2
Congo, Rep 1.6 4.0 2.8 Kenya 6.3 5.6 6.0
Ghana 6.3 7.5 5.6 Lesotho 2.8 2.8 -0.2
Namibia -0.1 -0.2 1.6 Madagascar 5.2 5.2 5.3
Nigeria 1.9 2.3 2.5 Malawi 3.2 4.5 5.1
South Africa 0.8 0.7 1.1 Mauritius 3.8 3.7 3.8
Tanzania 7.0 5.2 5.7 Mozambique 3.3 1.8 6.0
Zambia 3.7 2.0 1.7 Seychelles 4.1 3.5 3.3
Zimbabwe 3.5 -7.1 2.7 Togo 4.9 5.1 5.3
Uganda 6.1 6.2 6.2
Source: IMF Regional Economic Outlook for Sub-Saharan Africa, October 2019
Sustained commodity price recovery since 2016 helped resource intensive countries recover but
now such countries have to deal with sharp swings in commodity prices linked to concerns over
global growth rates. Oil, mineral and agricultural commodities prices have generally softened.
Non-resource-intensive countries, except perhaps the smaller nations, are expected to continue
growing rapidly in the medium term. Côte d'Ivoire and Ethiopia are expected to lead the growth
charge in Sub-Saharan Africa.
Some of the generalised risks to Sub-Saharan African economies influencing their capacity to
fund infrastructure expansion stem from the following factors:
• External buffers remain low. The current account deficit is projected to widen to -3.8%
from -2.7 in 2018. Current account deficits primarily reflect economic imbalances.
• Government debt, although envisaged to be stable, is around 50% of GDP.
4.5. South Africa Outlook
The GDP improvement of 3.1% in Q1 2019 from -3.2% in Q1 was short-lived because Q3
registered a deceleration of 0.6%. The load shedding that caused huge losses in Q1 2019 has
returned in the early weeks of 2020 again. The gap between the performance of the global
economy and that of South Africa has become steadily wider due to sluggishness in domestic
economic growth. Domestic political and economic factors have played a role in dampening
economic growth. The latest two points, October and November, of the leading business indicator
Page | 19had begun to show some
future life in the economy, but
the electricity situation will
dampen this potential.
4.5.1 Inflation
The inflation rate has
remained subdued for an
extended period of time
around the 4.5% midpoint of
the 3-6% inflation target and
the contributors were broad-
based. The low inflation is
reflective of the lackluster economic performance, particularly on the demand side. Producer price
inflation, as measured at the factory gate, has also been subdued and has exhibited a declining
trend over the past 18 months.
4.5.2 Interest rates
South Africa's short-term interest rates have remained relatively stable in recent years. The SARB
has reduced the repo rate by 25 basis points at each occasion twice over the past 12 months, in
July and January to 6.25%. There is ample room to lower interest rates further in the next 12
months and data outcomes should inform future interest rates stances.
4.5.3 Rand exchange rate
Key international and domestic events in recent years have explained trends in the rand exchange
rate. These range from the fiscal implications of government financial support to SOEs, to
sovereign downgrades and the US-China trade impasse. The rand is arguably oversold and firm
yields on South African government bonds help to attract a level of demand for the currency.
Quicker progress on government reform could see the rand improve further.
4.5.4 Fixed Investment
The growth rate of gross fixed capital formation improved in Q2 (5.8%) and Q3 (4.5%) from -4.1%
in Q1. Fixed capital formation as a percentage of overall GDP last reached the 25% mark aspired
to in the NDP in the mid-1980s. South Africa is investing far too little to sustain a much improved
Page | 20economic growth rate. Total fixed investment is forecast to remain at -1.4% growth in 2019, before
showing some recovery in 2020 and 2021 of 1.8% and 3.7%, respectively.
4.6 Generalized risks to the global, Sub-Saharan and South Africa outlook
Infrastructure financing activities in the short term will be influenced by the following factors:
• Demand from China affecting global production.
• Climate shocks are a persistent source of risk to SSA given its geophysical make up and
dependence on hydropower and agriculture.
• Security, especially at regional level, is an important risk to deal with for the DBSA in SSA.
Page | 215. The Balance Scorecard
The BSC that drives this strategy is provided below
Objective Key performance indicator Owner Weighting SDG Forecast Target Target Target
alignment to 2019/20 2020/21 2021/22
BSC 2022/23
FINANCIAL PERSPECTIVE (30%)
Maintain financial Financial
sustainability
• ROE (calculated on sustainable earnings) CFO 6% (8%) SDG 9 4.5% 4.5% 4.5% 4.5%
• Net Cash Generated from Operations CFO 4% (4%) SDG 9 R2.3 billion R2.5 billion R3.0 R3.5
billion billion
• Cost to income ratio – financing business1 CFO 4% (0%) SDG 9 27.2% 35.0% 35.0% 35.0%
Disbursements
• Total Disbursements 16% (21%) R 11.5 billion R13.5 billion R14.5 R16.0
billion billion
o Top 5 Metropolitan cities (direct and indirect lending) 2 GE: Coverage; GE 3% (3%) SDG 11 R3.5 billion R3.7 billion R3.9 R4.2
Transacting billion billion
o All RSA municipalities (excl. Top 5 metros) [direct and GE: Coverage; GE 4% (3%) SDGs 6, 11 R0.7 billion R0.8 billion R1.0 R1.4
indirect lending] Transacting billion billion
o Other social infrastructure (excl. municipalities) GE: Coverage; GE 3% (3%) SDGs 3, 4, 6 R0.2 billion R0.7 billion R1.0 R1.3
Transacting billion billion
o Economic infrastructure GE: Coverage; GE 3% (4%) SDG 5, 7, 9,13 R3.2 billion R3.5 billion R3.7 R4.0
Transacting billion billion
o Rest of Africa GE: Coverage; GE 3% (8%) SDGs 7, 9, 10, R3.9 billion R4.8 billion R4.9 R5.1
Transacting 13, 17 billion billion
1 Ratio excludes IDD and includes developmental expenditure, PPD and grants. Where developmental expenditure is underspent, this ratio will be calculated using the budgeted expenditure
2 Alternative to direct financing of municipalities
Page | 22Balanced scorecard (continued)
SDG Forecast Target Target Target
alignment 2019/20 2020/21 2021/22 2022/23
Objective Key performance indicator Owner Weighting to BSC
CUSTOMER/DEVELOPMENT PERSPECTIVE (35%)
Accelerating Under-resourced Municipalities
development • Value of infrastructure unlocked for under- GE: Coverage 3% (3%) SDG 7 R0.9 billion R1.2 billion R1.5 billion R1.8 billion
impact resourced municipalities GE: Project Prep
& Smart
partnerships Project Preparation
• Value of projects prepared and committed GE: Project Prep 3% (2%) SDGs 7, 13 R1.5 billion R3.0 billion R4.0 billion R5.0 billion
Infrastructure Delivered
• Value of infrastructure delivered GE: IDD 3% (3%) SDG 1, 3, 4, R4.0 billion R4.1 billion R4.3 billion R4.4 billion
5, 8, 9, 11
Total Funds Catalysed
GE: Coverage SDG 17
• Total 3rd party funds catalysed3 GE: Transacting 3% (3%) R16.7 billion R13.5 billion R14.5 billion R16.0 billion
GE: Project Prep
Development Position
CIO SDG 8 Rating of 3 out of Rating of 3 out of Rating of 3 out of
• Development position5 3% (3%)
GE: Fin Ops 5 5 5
Economic Transformation
• Value of projects for black-owned entities GE: Project Prep 2% (2%) SDG 7 R2.7 billion R1.2 billion R1.5 billion R1.7 billion
(50% shareholding and above) approved for
project preparation funding
• Number of transactions that are committed SDGs 7, 9 - 5 6 7
GE: Coverage
for DBSA funding to black-owned entities 2% (2%)
GE: Transacting
(50% shareholding and above)
• Percentage of procurement spend on black- GE: IDD 2% (0%) SDG 1 60% 65% 65% 65%
owned suppliers for IDD third party fund4
Gender Mainstreaming
• Percentage of procurement spend on black GE: IDD 2% (0%) SDGs 1, 5 - 20% of total 25% of total 30% of total
woman owned suppliers for IDD third party procurement procurement procurement
fund (30% and above shareholding) spend from B- spend from B- spend from B-
BBEE suppliers BBEE suppliers BBEE
suppliers
• Number of transactions that are committed GE: Coverage 2% (0%) SDG 5 - 2 3 4
for DBSA funding to black women-owned
entities (30% shareholding and above) GE: Transacting
3
Third party funds catalyzed = Target for total infrastructure unlocked for the year less (value of infrastructure delivered +Value of projects prepared and committed+ value of
infrastructure unlocked for under-resourced municipalities + disbursements)
4 Value of funds paid to black owned suppliers as a percentage of value of infrastructure delivered
5 Detailed methodology of calculating the target for the development position will be included in the key performance indicator profile.
Page | 23Balanced scorecard (continued)
SDG Forecast Target Target Target
alignment 2019/20 2020/21 2021/22 2022/23
Objective Key performance indicator Owner Weighting to BSC
CUSTOMER/DEVELOPMENT PERSPECTIVE (35%)
Accelerating Breakthrough Initiatives
development
impact & Smart Moonshot programmes 6% (8%)
partnerships • Number of identified programmes for the CIO 2% (2%) SDG 9, 11 - Established the 7 9
New Investment Platform Dedicated
Implementation
Unit (DIU) as
agreed with
National Treasury
= 3 rating
• Number of transactions approved through CIO 2% (2%) SDG 9, 11 - 5 deals approved 7 9
the High Impact Investment Portfolio for ERR, 2 deal
approved for
funding & 2 deal
committed for
funding = 3 rating
• Number of the D-Labs CIO 2% (2%) SDGs 1, 11 - Set up of 5 D- 10 12
labs sites and 5
D-Lab site fully
operational = 3
rating
Green Climate Fund
• Value of projects approved for funding by GE: Project 2% (0%) SDGs 13, 17 - R500 million R600 million R700 million
Green and Climate Change Funds Prep
Smart Client satisfaction survey
Partnerships
• Client satisfaction survey GE: Coverage 2% (2%) Not applicable 3.9 3.5 3.5 3.5
GE: Transacting
GE: Project
Prep
GE: IDD
Page | 24Balanced scorecard (continued)
SDG Forecast Target Target Target
Key performance alignment 2019/20 2020/21 2021/22 2022/23
Objective indicator Owner Weighting to BSC
LEARNING AND GROWTH PERSPECTIVE (10%)
Future Fit • Skills bench strength GE: 6% (6%) Not applicable - Development of the 50% of key positions to be 60% of key positions to be
DBSA Corporate successional plan and filled by internal candidates filled by internal candidates
Services approved by management
committees strength = 3
Implementation of the plan = 4
Results or successes of
implementation of the plan = 5
• Staff turnover ratio GE: 4% (0%) Not applicable - Ranging 5%- 10% Ranging 5%-10% Ranging 5%-10%
Corporate
Services
INTERNAL PROCESS PERSPECTIVE (25%)
Future Fit • Maintain the BBBEE score GE: HC 3% (5%) SDG 5 Maintain level Maintain a minimum of Level 2 Maintain a minimum of Maintain a minimum of
DBSA Chief 2 BBBEE = 3 rating. Level 1 = 4 rating. Level 2 = 3 rating. Level 1 = Level 2 = 3 rating. Level 1 =
Financial score 4 rating. 4 rating.
Officer
• Programmes that drive a Chief 2% (0%) Not applicable - 2 business processes 2 business processes 2 business processes
digital DBSA Financial automated for our core automated for our core automated for our core
Officer business business business
Governance
• Irregular, unauthorised and Chief 5% (3%) Not applicable 0% of total Classify 0.0% (R value) of Classify 0.0% (R value) of Classify 0.0% (R value) of
fruitless and wasteful Financial expenditure expenses as irregular, expenses as irregular, expenses as irregular,
expenditure Officer unauthorised and fruitless and unauthorised and fruitless and unauthorised and fruitless and
wasteful expenditure wasteful expenditure wasteful expenditure
• Ethical behaviour Corporate 5% (0%) Not applicable - Decisive consequence Decisive consequence Decisive consequence
Secretariat management for unethical management for unethical management for unethical
behaviour behaviour behaviour
• Compliance with the PFMA Chief Risk 5% (0%) Not applicable - Submit all PFMA submissions Submit all PFMA submissions Submit all PFMA submissions
Officer within the stipulated deadline within the stipulated deadline within the stipulated deadline
• Unqualified Audit opinion Chief 5% (5%) Not applicable Clean audit Achieve unqualified audit opinion Achieve unqualified audit Achieve unqualified audit
Financial without matter of emphasis opinion without matter of opinion without matter of
Officer emphasis emphasis
Page | 256. Annexures
ANNEXURE A: COMPLIANCE CHECKLIST
No Description Reference Status
1 Strategy Point 2 ✓
2 Key Performance Indicators Point 3 ✓
3 Compliance check list Annexure A ✓
4 Capital Expenditure Plan (covering the next three Annexure B ✓
years) Section 5.3
5 Financial Plan (covering the next three years)
including: ✓
Annexure B
• Projected income statement ✓
Section 5.4
• Projected balance sheet
✓
• Projected cash flow statement
6 Dividend Policy Annexure B ✓
Section 5.5
7 Materiality and Significance Framework Annexure B ✓
Section 5.7
8 Governance Structures
• Governance structures and roles/responsibilities
Annexure C ✓
• Structure of Board of Directors committees
Structure of Executive Management
9 • Employment Equity Plan (recommended) Annexure D ✓
10 Fraud Prevention Plan Annexure E ✓
11 Borrowing Programme (covering the next three years) Annexure F ✓
12 Risk Management Plan Annexure G ✓
• Description of risk management process
• Key operational risks
13 Other Supporting Plans Annexure I ✓
Environmental Framework (recommended)
Page | 26ANNEXURE B: FINANCIAL PLAN
Financial Overview
In preparing the three-year financial plan of the DBSA, the main economic conditions impacting
the budget include uncertainties regarding the outlook for South Africa’s credit rating status, the
rising interest environment (both locally and internationally), the volatility of exchange rates as
well as the possible deterioration of the asset portfolio, compounded by the uncertain economic
environment.
With the objective of achieving financial sustainability and meeting the Bank’s goal of generating
and sustaining inflation-linked growth in equity, the financial plan incorporates the financial results
of the business strategy outlined previously.
The DBSA and National Treasury are engaging on an ongoing basis concerning the use of
callable capital in the Bank’s gearing ratio. Should the need arise to utilize the callable capital,
this will be discussed with National Treasury and is highlighted in the Corporate Plan.
In addition, various internal initiatives are currently underway to help mitigate the risk of the Bank
reaching its debt/equity limit (including callable capital of R20 billion) beyond 2019/20, including
by seeking ways to act more as a catalyst for infrastructure development instead of taking up an
extensive portion of the available instrument. This role will also assist the Bank to earn non-
interest income as part of income diversification.
3-year Financial Plan
The financial projections in this plan are premised on the following assumptions:
• The Bank applied the inflation rates as stated in the table below in the preparation
of the corporate plan. This constitutes the general factor used to grow expenses,
except where specific adjustments, or a budget for specific non-recurring
expenditure, were done;
27 | P a g e2020/21 2021/22 2022/23
Inflation 5.26% 5.11% 5.27%
• Budgeted foreign exchange rates for:
- 2020/21: R15.26/$,
- 2021/22: R15.92/$,
- 2022/23: R16.66/$.
The base rates were based on an Econometrix forecast report, except for the
government rate linked debt, which was forecast by the DBSA Treasury Unit. The
Bank engaged Econometrix to forecast key parameters used for the financial
planning/budgeting process.
• Funding rates:
2020/21 2021/22 2022/23
Jibar 6M 7.33% 7.46% 7.60%
Gov’t rate 10 to 13 years 9.20% 9.30% 9.40%
Libor 1.82% 2.34% 2.95%
• Funding Mix (new borrowings):
2020/21 2021/22 2022/23
Jibar 6M 70% 70% 70%
Capital Market debt 30% 30% 30%
Total 100% 100% 100%
The salient features of the plan for the financial years 2020/21 to 2022/23 include:
• Targeted annual infrastructure disbursements of R13.5 billion, R14.5 billion and
R16.0 billion for the respective financial years;
• Net interest income of R4.4 billion (2020/21) is expected to increase to R5.0 billion
by 2022/23, based on the projected loan book, capital repayments and
disbursements, taking additional liquidity requirements into account. The net
interest margin is projected to increase from 5.3% in 2020/21 to 5.4% in 2022/23,
mainly attributable to the increase in the endowment effect as the balance sheet
grows, as well as increased margin squeeze due to increased competition as well
as higher funding costs. Strategies to supplement interest income with non-interest
income are currently being implemented;
28 | P a g e• The table below reflects the budgeted gross loan book and impairment provision
over the medium term. The impaired amount reflected in the Financial Plan is based
on preliminary IFRS9 impairment numbers. The implementation team is currently
assessing the full extent of the impact and significant changes will be communicated
accordingly
• The Bank targets to maintain a gross non-performing loan ratio of less than 6%.
R’ million March 2020 2021 2022 2023
Forecast
South Africa Financing
Gross loan book 60 099 66 113 68 682 73 756
Provision (3 166) (3 570) (3 937) (4 178)
Net loan book 56 933 62 542 64 745 69 577
International Financing
Gross loan book 20 841 22 623 24 385 26 078
Provision (3 398) (4 341) (5 195) (5 759)
Net loan book 17 444 18 282 19 190 20 318
Total DBSA 74 377 80 825 83 935 89 896
Capital Expenditure Plan
The capital expenditure plan as set out below is mainly to support the collective operations of the
Bank and the envisaged growth over the next three years. The following table provides a summary
of the planned fixed capital expenditure per main fixed asset category:
Asset type Budget 2020/21 Projection 2021/22 Projection 2022/23
Building 148.9 163.8 180.2
Computer equipment 25.1 27.7 30.5
Intangible assets 28.0 30.8 33.9
Total R202.1 mil R222.3 mil R244.5 mil
29 | P a g e3-year Financial Plan
BALANCE SHEET
2018/19 2019/20 2020/21 2021/22 2022/23
Actual Forecast Budget Projection Projection
R mil R mil R mil R mil R mil
Cash & cash equivalents 2 923 2 898 1 916 2 042 2 218
Financial market assets 2 638 2 560 2 484 2 394 2 308
Equity investments 5 938 5 649 5 338 5 107 4 940
Project preparation - - - - -
Development loans 75 817 74 290 81 087 84 504 90 810
Development bonds 1 290 1 290 1 290 1 289 1 289
Fixed assets 518 529 695 881 1 088
Other assets 366 346 381 419 461
Total assets 89 488 87 561 93 190 96 636 103 114
Medium- to long term debt 51 283 47 754 51 426 52 887 57 307
Deferred income - - 69 129 183
Other liabilities 1 032 787 991 1 089 1 195
Liabilities 52 316 48 542 52 486 54 105 58 685
Shareholders’ equity 200 200 200 200 200
Retained earnings 22 718 24 529 26 213 28 040 29 938
Other reserves 14 255 14 291 14 291 14 291 14 291
Equity 37 173 39 020 40 704 42 530 44 429
Total equity & liabilities 89 488 87 561 93 190 96 636 103 114
Balance sheet ratios:
Debt / equity (excl. callable capital) 138% 122.4% 126.5% 124.7% 129.4%
Debt / equity (incl. R20 billion callable capital) 90% 81% 85% 85% 89%
Return on average equity – Net profit 8.66% 4.04% 4.22% 4.39% 4.37%
Note 1: Cost-to-income ratio includes operating expenditure plus development expenditure and project preparation
costs (and excludes income and costs related to IDD) divided by operating income
30 | P a g eINCOME STATEMENT 2018/19 2019/20 2020/21 2021/22 2022/23
(Amounts in R mill) Actual Forecast Budget Projection Projection
Interest income 8 410 8 233 8 394 9 050 9 820
Interest expense (3 915) (3 914) (3 977) (4 298) (4 803)
Net interest income 4 494 4 320 4 418 4 752 5 017
Net fee income 208 225 301 341 365
Other income 126 90 52 47 39
Operating income 4 828 4 635 4 770 5 140 5 421
Impairments (1 441) (1 358) (1 079) (1 221) (1 306)
Operating expenses (1 063) (1 241) (1 381) (1 453) (1 531)
Financing
Personnel cost (630) (705) (799) (843) (889)
Other expenses (244) (308) (324) (340) (358)
Depreciation (18) (28) (35) (35) (36)
IDD
Personnel cost (121) (143) (160) (168) (178)
Other expenses (49) (56) (62) (65) (69)
Depreciation (1) (0.8) (1) (1) (1)
Project preparation costs (1) (70) (160) (165) (170)
Corporate Social Investment - (31) (33) (34)
Development expenditure: interest
subsidy (5) (27) (24) (25) (27)
Development expenditure planning and
capacity support (15) (56) (160) (147) (150)
Revaluation on equity investments 41 (57) 29 27 25
Strategic initiatives (moonshots) - (52) (150) (170) (180)
Stakeholder relations cost (18) (31) (15) (17) (18)
Sustainable earnings 2 324 1 742 1 799 1 935 2 030
Revaluation (loss) / gain on other
financial instruments 28 (73) (67) (68) (69)
Foreign exchange gain / (loss) 744 (130) (49) (40) (62)
Net profit 3 097 1 539 1 684 1 827 1 899
Income statement ratios
Net interest margin 5.5% 5.3% 5.3% 5.4% 5.4%
Cost to income ratio: Total 22.9% 30.7% 40.3% 39.1% 38.9%
Cost to income ratio: IDD 96.0% 96.0% 95.5% 94.9% 94.5%
Cost to income ratio: (including lending
and project preparation) 20% 28.9% 37.4% 36.3% 36.1%
Cost to income (DBSA) – excluding
project preparation, development
expenditure and grants 22% 26.8% 28.9% 28.3% 28.2%
31 | P a g eCost to income (excl. IDD) – excluding
project preparation, development
expenditure and grants 19% 23.5% 25.5% 24.9% 24.9%
Note 1: Net interest margin formula changed to align to industry definition.
Note 2: Cost-to-income ratio includes operating expenditure plus development expenditure and project preparation
costs (and excludes income and costs related to IDD) divided by operating income
32 | P a g eCASH FLOW STATEMENT 2018/19 2019/20 2020/21 2021/22 2022/23
Actual Forecast Budget Projection Projection
R’ million R’ million R’ million R’ million R’ million
Profit/(loss) for the year 3 097 1 539 1 684 1 827 1 899
Adjusted for: (3 865) (2 924) (3 138) (3 309) (3 444)
Depreciation 20 28 36 36 37
Grants 40 184 196 219 232
Dividends (92) (80) (52) (47) (39)
Loss on asset disposals 0 0 - - -
Fees accrued (development loans) 62 41 - - -
Equity gain (63) (48) (29) (27) (25)
Revaluation gains / (losses) (35) 71 - - -
Foreign exchange (gains) / losses equity
investments (742) (160) (25) (127) (131)
Forex (gains) / losses on USD assets - - (56) (555) (630)
Forex (gains) / losses on USD funding - - 130 723 823
Impairments 1 441 1 358 1 079 1 221 1 306
Net interest income (4 494) (4 320) (4 418) (4 752) (5 017)
Subtotal (768) (1 385) (1 455) (1 482) (1 546)
Change in other assets 9 (2) (35) (38) (42)
Change in other payables 13 (78) 273 158 159
Interest & dividends received 8 271 8 251 8 446 9 097 9 859
Interest paid (3 728) (3 631) (3 977) (4 298) (4 803)
Net cash from operating activities 3 797 3 155 3 253 3 437 3 628
Cash flows from development activities 1 217 (461) (7 650) (3 916) (6 891)
Development loan disbursements (8 808) (9 023) (13 500) (14 500) (16 000)
Development loan principal repayments 9 967 8 620 5 681 10 418 9 018
Net increase in equity investments 135 102 366 385 323
Grant paid (20) (142) (196) (219) (232)
Net advances to National Mandates (58) (18) - - -
Cash flows from investing activities (345) 418 (126) (132) (159)
Purchase of PPE & intangibles (27) (29) (202) (222) (245)
Proceeds from PPE 0 - - - -
Movement in financial market assets (318) 448 76 90 86
Cash flows from financing activities (5 516) (3 052) (3 541) 738 3 598
Capital raised - - - - -
Financial market liabilities repaid (18 619) (21 475) (3 631) (6 954) (15 102)
Financial market liabilities raised 13 102 18 423 7 172 7 692 18 700
Net increase/decrease in cash & cash
equivalents (848) 60 (981) 127 175
33 | P a g eEffect of exchange rate movements 29 (85) - - -
Movement in cash & cash equivalents (819) (25) 981 127 175
Opening cash & cash equivalents 3 742 2 923 2 898 1 916 2 043
Closing cash & cash equivalents 2 923 2 898 1 916 2 043 2 218
Liquidity per IFRS 4 847 4 815 3 757 3 794 3 884
Cash and cash equivalents 2 923 2 898 1 916 2 043 2 218
Financial market assets 2 1 924 1 917 1 841 1 751 1 666
Dividend Policy
The purpose of the dividend policy is to set out guidelines that DBSA uses to decide on how much
of its earnings it will distribute to its shareholder as a development dividend.
The DBSA considers the following in declaration of a development dividend:
• the Corporate Plan commitments and strategic objectives, including investments
and expenditures in fulfilling the mandate of the DBSA;
• whether the DBSA will reasonably satisfy the solvency and liquidity test
immediately after completing the proposed development dividend and
• whether the DBSA will reasonably satisfy the liquidity requirements in accordance
with the DBSA liquidity risk policy.
In the event that the Bank declares a development dividend, it shall be when:
(i) Available cash resources cannot be effectively utilized;
(ii) Sources and uses of future cash flow requirements have been satisfied; and
(iii) It is not in contravention of the DBSA Act.
Procurement Policy
In line with the requirements of the Public Finance Management Act (1999), the Bank has
developed and implemented procurement policies and procedures that also addresses the BEE
requirements set out in government policy and relevant legislation.
The DBSA also strives to promote Exempt Micro Enterprises and Qualifying Small Enterprises
through its preferential procurement practices. It is currently rated as a Level 1 contributor in terms
of the Broad-Based Black Empowerment Act and has plans to maintain the level 1 rating whilst
improving participation to 51% black women owned enterprises
2
Includes investment securities, derivative assets held for risk management and post-retirement medical benefit
investment
34 | P a g eYou can also read