Sector Skills Plan 2019 to 2024 Final 1 August 2018 - MICT Seta
←
→
Page content transcription
If your browser does not render page correctly, please read the page content below
Sector Skills Plan
2019 to 2024
Final
1 August 2018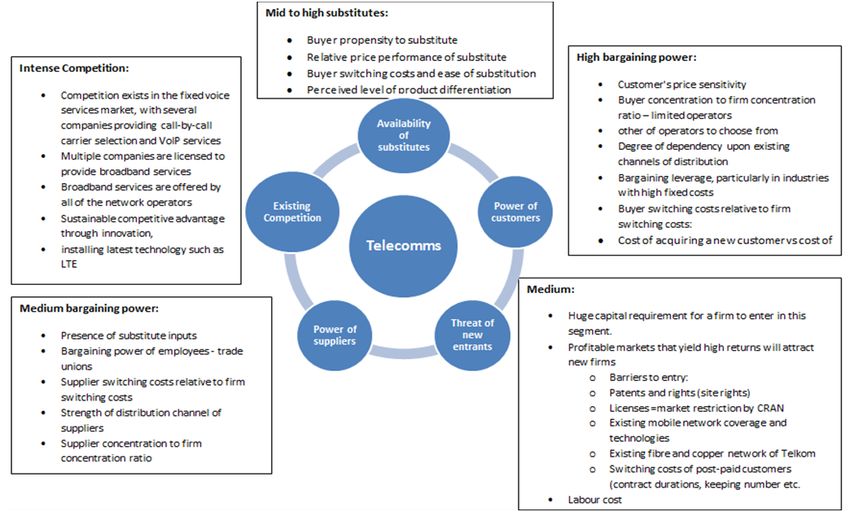
Foreword
In this annual update of the MICT SETA Sector Skills Plan, we have conducted more rigorous research to
ensure that the scarce and critical skills are true reflections of demand. Data on labour shortages is often a
subject of debate. Are we tapping into the same sources when we ask and then verify which skills are
needed? Are skills shortages a reflection of churning in the labour market? Do the skills lists give us a
snapshot in time rather than longer-term demands?

This year, we revised the methodology and research data sources to acquire deeper insight into the real
skills shortages and to support industry in closing those skills gaps. The more confidence we have in the
scarce skills list, the more assured we are of the Strategic Plan. The combined efforts from all stakeholders
to produce this document are gratefully acknowledged. The following deserve special mention:

    –   The Ministerial representatives on MICT SETA’s Board
    –   Industry, via representation on MICT SETA’s Board
    –   Organised Labour, through representation on MICT SETA’s Board

Our thanks go to all the stakeholders whose collective wisdom has been incorporated into this document.
Sharing of knowledge is the catalyst for achieving South Africa’s skills development potential and economic
growth.

Mr. Charlton Philiso

Acting CEO: MICT SETA

Mr. Sihle Ngubane

Chairperson: MICT SETA Board

i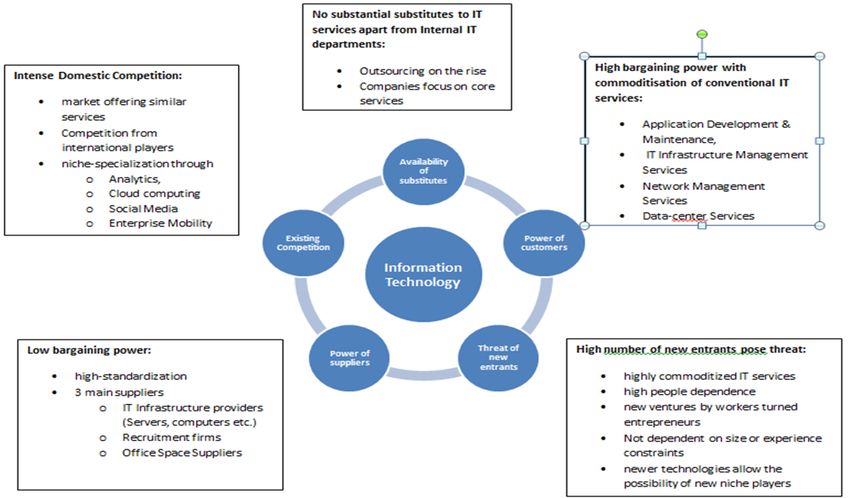
Acronyms
Abbreviation   Description
ATR            Annual Training Report
B-BBEE         Broad-Based Black Economic Empowerment
CAGR           Compound Annual Growth Rate
CECS           Centre of Excellence in Cyber Security
DTT            Digital Terrestrial Television
EE             Employment Equity
ETQA           Education and Training Quality Assurance
GDP            Gross Domestic Product
HEMIS          Higher Education Management Information System
HET            Higher Education and Training (Institution)
HRDSSA         Human Resource Development Strategy of South Africa
ICT            Information and Communication Technology
IPAP           Industrial Policy Action Plan
ISOE           Institute of Sectoral and Occupational Excellence
IT             Information Technology
MICT           Media, Information and Communication Technologies
NDP            National Development Plan
NQF            National Qualifications Framework
NSI            National System of Innovation
NSDS           National Skills Development Strategy
OFO            Organising Framework for Occupations
OGS            On-line Grant System
PC             Personal Computer
PICC           Presidential Infrastructure Coordinating Commission
SDF            Skills Development Facilitator
SDL            Skills Development Levy
SETA           Sector Education and Training Authority
SIC            Standard Industrial Classification
SIP            Strategic Integrated Projects
SKA            Square Kilometre Array
SMME           Small, Medium and Micro-enterprises
SSP            Sector Skills Plan
STB            Set Top Box
TVET           Technical Vocational Education and Training
WIL            Work Integrated Learning
WSP            Workplace Skills Plan

ii
Executive Summary
The MICT Sector Skills Plan (SSP) has been developed over the period of NSDS III to map out and plan for the
occupational skills needs in Advertising, Film and Electronic Media, Electronics, Information Technology and
Telecommunications industries. Each year it is updated to analyse the changes in the sector’s labour market
and does so against the backdrop of the economic performance of the sector and developmental agenda of
the country. It sizes up the gap between the demand and supply for skills and finally outlines strategies for
dealing with the identified challenges.

Sector Profile and Analysis

The MICT sector is currently made up of almost 29,000 companies spread across the five sub-sectors. These
estimates represent only companies allocated to the MICT SETA through the SARS registration process.
About 50% of the sector employer base is constituted by organisations in the Information Technology sub-
sector, followed by Electronics at 14% and Advertising with 11%; while the Film and Electronic Media 7%
and Telecommunications 18%. Overall, the number of levy paying employers has increased by 10.2%% in
2018 (7089 employers), up from 6602 the previous financial year.

Economic growth in the MICT sector has been lagging. While the Film and Electronic Media as well as the
Electronics sub-sectors have been vibrant, the other sub-sectors have not performed as they might have
been expected to.

There is also a general perception that there has been an adverse trend on the labour market. Employer
data submitted in 2018 reflects employment at 193604 down from 238,785 people employed in companies
submitting WSPs in 2017.

Skills Demand, Supply and Scarcity

The following is a list of top 10 occupations with hard to fill vacancies in the MICT sector (and the quantity
needed).

      –   Software developer (1131)
      –   Computer Network and Systems Engineer (352)
      –   ICT Systems Analyst (316)
      –   Programmer Analyst (165)
      –   ICT Security Specialist (150)
      –   Business Analyst (126)
      –   Multimedia Designer (121)
      –   Advertising Specialist (106)
      –   Database Designer and Administrator (91)
      –   Telecommunications Network Engineer (91)

The MICT SETA has engaged in several partnerships with TVET colleges and institutes for sectoral and
occupational excellence (ISOEs) to improve delivery of training programmes. Furthermore, the SETA has
mapped occupations against career pathways so that it is easy to identify PIVOTAL interventions, and in that
way, ensure seamless funding of skills development through the 80% PIVOTAL allocation of the discretionary
grants.

iii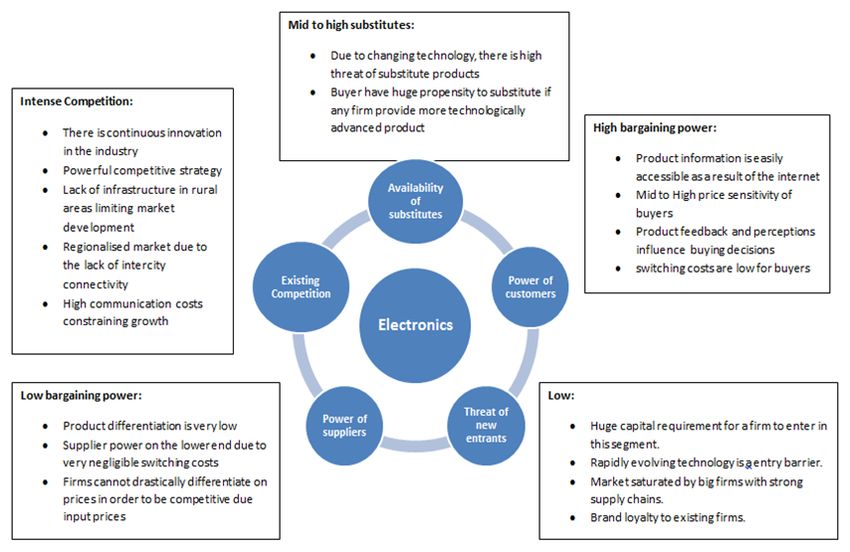
Sector Skills Priority Actions
The following sets out the proposed broad skills development objectives for the sector:

-       Improve the trustworthiness of the data used for skills planning. Each of the occupations with hard
        to fill vacancies will be mapped to learning pathways.
-       Partner with stakeholders in each sub-sector to set realistic targets, assess provision and access
        across provinces, regions, industries, occupations and different size companies, and identify
        weaknesses. Ensure the implementation of effective internships through structured mentorship and
        coaching programmes to guarantee they serve as effective bridges into employment.
-       Develop appropriate qualifications (via stakeholder processes led by the QCTO). Current
        learnerships will be reviewed and new ones developed. The SETA will also put in place criteria,
        systems and processes to review vendor programmes.
-       Scope the skills development needs and priorities in rural areas to provide career and vocational
        guidance. Support government in addressing the e-governance issues and assist aspirant training
        providers to attain accreditation and deliver on MICT SETA programmes.
-       Provide support to enable the research and skills development around the establishment and
        sustainability of green production methods and products.
-       Support initiatives to apply technology in a manner that supports an expansion of employment of
        people with disabilities in the MICT sector.
-       Improve provision of skills development to SMMEs.
-       Develop cross-sectoral partnerships and projects in the delivery of learning interventions. There is a
        need for some inter-SETA projects that fund interventions relating to MICT skills located in other
        sectors as well as skills interventions developed in other SETAs (management, finance, and other
        skills) that can be delivered in the MICT sector.
-       Review Grants Policies and Procedures to enable impact across the range of sector development
        initiatives. There is a need to strengthen project management capacity to design, establish and
        facilitate implementation of specially designed projects.

iv
Table of Contents

Foreword ..................................................................................................................................... i
Acronyms.................................................................................................................................... ii
Executive Summary.................................................................................................................... iii
List of Figures ............................................................................................................................. vi
List of Tables .............................................................................................................................. vi
SSP Research process and methods ............................................................................................. 1
   Purpose of the SSP................................................................................................................... 1
   Objectives of Sector Skills Plan................................................................................................. 1
   Conclusion ............................................................................................................................... 4
Chapter 1: Sector Profile .......................................................................................................... 5
   1.1 Scope of coverage ......................................................................................................... 5
   1.2 Key role players ............................................................................................................. 8
   1.3 Economic performance of the sector ........................................................................... 10
   1.4 Employer profile.......................................................................................................... 18
   1.5 Labour market profile.................................................................................................. 19
   1.6 Conclusion................................................................................................................... 22
Chapter 2: Key Skills Issues .................................................................................................... 23
   2.1 The Fourth Industrial Revolution and its Change drivers in the MICT sector.................. 23
   2.2 Alignment with National Strategies and Plans .............................................................. 25
   2.3 Conclusion................................................................................................................... 28
Chapter 3: Occupational Shortages and Skills Gaps ................................................................ 29
   3.1 Occupational shortages and skills gaps ........................................................................ 29
   3.2 Extent and nature of supply......................................................................................... 36
   3.3 Pivotal List................................................................................................................... 44
   3.4 Conclusion................................................................................................................... 48
Chapter 4: Sector Partnerships .............................................................................................. 49
   4.1 Existing partnerships ................................................................................................... 49
   4.2 New Partnerships ........................................................................................................ 52
   4.3 Conclusion................................................................................................................... 52
Chapter 5: Skills Priority Actions ............................................................................................ 53
   5.1 Findings from previous chapters .................................................................................. 53
   5.2 Recommended Actions ................................................................................................ 54
   5.3 Measures to support National Strategies and Plans ..................................................... 55
   5.4 Conclusion................................................................................................................... 57
Bibliography ............................................................................................................................. 58

v

List of Figures
Figure 1: MICT Convergence Chain............................................................................................................8
Figure 2: Forecast sub-sector growth rates..............................................................................................11
Figure 3: Advertising Porter’s Analysis ....................................................................................................12
Figure 4: Film and Electronic Media Porter’s Analysis ..............................................................................13
Figure 5: Electronics Porter’s Analysis .....................................................................................................14
Figure 6: Information Technology Porter’s Analysis .................................................................................16
Figure 7: Telecoms Porter’s Analysis .......................................................................................................17
Figure 8: The MICT Sector of Employers per Sub-Sector ...........................................................................18
Figure 9: Employment in the MICT related industries ..............................................................................19
Figure 10: Number of employees by Sub-sector ......................................................................................20
Figure 11: Race and gender distribution of employees ............................................................................20
Figure 12: Disability distribution by race of employees............................................................................21
Figure 13: Age distribution of Employees ................................................................................................21
Figure 14: Occupations by OFO major Groups .........................................................................................22
Figure 15: Proportion of Hard to Fill Occupations by Major Group ...........................................................30
Figure 16: ICT vacancies..........................................................................................................................30
Figure 17: Top 5 Qualifications enrolled for.............................................................................................36
Figure 18: Enrolment by annual breakdown ............................................................................................37
Figure 19: Total population of enrolments – 2015/16 ..............................................................................38
Figure 20: Learnerships and Skills Programmes Completions 2012/13-2015/16........................................38
Figure 21: Learning programmes enrolments by NQF level ......................................................................39
Figure 22: Graduations for 2016 in public HEIs by major field of study .....................................................40

List of Tables
Table 1: The MICT SETA SIC Code List........................................................................................... 5
Table 2: Key role players in the MICT sector ................................................................................ 8
Table 3: The MICT sector size of employers per Sub-Sector ........................................................ 18
Table 4: MICT Sector Policy interventions .................................................................................. 25
Table 5: Estimation of Advertising Need .................................................................................... 31
Table 6: Film and Electronic Media hard to fill vacancies............................................................ 32
Table 7: ICT Occupations with Hard to Fill Vacancies .................................................................. 33
Table 8: Skills gaps .................................................................................................................... 35
Table 9: Enrolments in public HEIs by major field of study ......................................................... 40
Table 10: Number of students enrolled in TVET colleges, 2010 to 2016 ...................................... 41
Table 11: Possible Qualifications mapped to Occupations .......................................................... 43
Table 12: Top 10 PIVOTAL List for the MICT Sector..................................................................... 45
Table 13: Partnership with TVET colleges (2017/18)................................................................... 49
Table 14: Partnership with Organs of the state (2017/18) .......................................................... 50
Table 15: Partnership with Universities (2017/18) ..................................................................... 50
Table 16: Partnerships with SMMEs (2017/18) .......................................................................... 51
Table 17 : MICT SETA’s efforts to support National Strategies and Plans .................................... 56

vi
SSP Research process and methods
Purpose of the SSP
The Media, Information and Communication Technologies (MICT) Sector Skills Plan (SSP) 2019-2024, has been developed over the period of the third
iteration of the National Skills Development Strategy (NSDS III) to map out and plan for the occupational skills needs in Advertising, Film and Electronic
Media, Electronics, Information Technology, and Telecommunications. Each year it is updated through analysis of the changes in the sector’s labour market,
economic performance, and demand in skilled labour. The SSP thus provides an analysis of current data to plan interventions that address the imbalances in
the skills eco system.

Objectives of Sector Skills Plan
The DHET provides a framework and guidelines for the development and preparation of the SSP, including which questions each chapter ought to answer.
Various research studies are conducted to obtain sufficient information for the development of the SSP of the MICT sector. In line with the requirements for
the development of the SSP, the research studies overall focus on the following objectives:

    •   Quantify the demand for (skilled) labour in the MICT sector;
    •   Document factors that impact on the volume of labour supply;
    •   Assess whether the MICT sector is expanding or contracting in terms of demand for services and / or products;
    •   Describe the shifts in the economy, in trade, technology and in policies that are driving changes in the demand for skilled labour in the MICT sector;
    •   Assess the quantity and quality of skills intervention programmes, with specific emphasis placed on MICT-aligned NQF programmes;
    •   Detail the strategic plan for the MICT SETA to meet the occupational shortages.

                                                                                                                                                             1
The following are some of the research studies that have been conducted by the MICT SETA to inform the development of the SSP.
a) b) c) d) e) Sample size and f) g)
Topic Nature (Design) Objectives of study Data collection scope List of data Time
of the study tool sources and frame
data sets
Mini reports on Qualitative A profile of all 5 sub-sectors providing • Literature search, 5 MICT SETA sub- •MICT SETA 2017/18
the dynamics of a brief overview of MICT SETA sectors. review and data sectors: Advertising, online grant
the MICT sub- It covers the key trends and analysis Electronics, Film and system
sectors challenges, the drivers of change and Electronic, Information (WSP/ATR)
the key role players in the sectors. Technology, •Stats SA
Telecommunications •SARS database
•MICT SETA MIS
•Key literature
MICT SETA Mixed methods To measure the impact of MICT SETA • Literature search, About 20000 learners •MICT SETA 2016
Learner impact learning programmes on the learners review, survey learner
study participating in funded programmes. and data analysis management
To provide insights on reasons why system
learners are dropping out, gaining
employment or starting own
businesses.
Employer Qualitative The objectives of these interviews are • In-depth 25 interviews. All • SARS 2018
interviews to get an understanding of key interviews using a employers selected database of
developments in the sector and to structured from a list on the SARS employers in
insights in regard to hard to fill questionnaire database the MICT
vacancies and change drivers in the sector
MICT sector. This study covers the
views of large and small employers
across all the subsectors of the MICT
sector.
2Employer survey Quantitative The goal of this survey is to assess • Survey Guide Scope covered all 5 • SARS 2017
stakeholders’ opinions on (convenient MICT SETA sub-sectors database of
developments in the sector, hard to fill sampling.) and the sample employers in
vacancies and change drivers across • Survey monkey the MICT
the five sub-sectors. (online survey About 3800 employers sector
tool) with valid email
addresses
Employer survey Quantitative The goal of this survey is to assess • Survey Guide Scope covered all 5 • SARS 2018
stakeholders’ opinions on (convenient MICT SETA sub-sectors database of
developments in the sector, hard to fill sampling.) and the sample employers in
vacancies and change drivers across • Survey monkey the MICT
the five sub-sectors. (online survey About 4000 employers sector
tool) with valid email
addresses
Annexure 2 Qualitative and An analysis report to extract both • WSP/ATR All participating MICT • MICT SETA 2017/18
(WSP/ATR) data quantitative quantitative and qualitative sector submissions SETA companies. online grants
analysis trends from WSP/ATR system
Employer Focus Qualitative The objectives of these group • Focus group Seven focus groups in • SARS
Groups discussions are to test the findings guide three provinces database of
from literature review and interviews • Structured covering all the sub- employers in 2018
in regard to hard to fill vacancies and discussion with sectors. the MICT
change drivers in the MICT sector. This selected sector
study covers the views of large and employers Each focus group with
small employers across all the up to 15 participants
subsectors of the MICT sector.
Training provider Quantitative The objective of the study is to Survey Scope: covered all 5 Survey monkey 2018
survey understand what is happening in the MICT SETA sub-sectors (online survey
supply of skills to the 5 MICT SETA sub- and the sample tool)
sectors.
This study covers the views of training About 1000 training
providers are MICT SETA accredited. providers
3OFO Mapping Qualitative The objectives of this study were to • Interviews Sample of • SARS 2016/17
identify and map all the common jobs • Desk Research database of
in the MICT sector to the OFO for ease • Structured employers in
of use and to inform future discussions with the MICT
identification of emerging vacancies SDFs sector
The objective of the study was to • Survey 2017
JCSE Survey Qualitative and gather the latest information on skills • Survey All participating MICT Centre
quantitative shortages and how skills evolve in SA's Stakeholders Web
MICT environment. It aimed at site.
providing insight on how skills are
acquired and practised.
Conclusion
The MICT SETA utilises various research outputs to compile the SSP. This approach enables the SETA to produce a plan that is detailed and informed by data
and yet written in a language that is clear and simple; which can be understood by multiple stakeholders who use the SSP as a source. For the preparation
of this SSP in 2018, the MICT SETA benefitted from receiving additional feedback from the DHET ministerial panel, which provided key research points.
Given that the SSP is made up of multiple research sources and a combination of methodologies, the process takes up to eight months to complete. A
bibliography of sources is provided at the end of the SSP with the specific details of the sources that were utilised in the preparation of the SSP.
4Chapter 1: Sector Profile
This chapter presents and profiles the shape and size of the Media, Information and Communication
Technologies (MICT) sector including its scope of coverage and key role players, economic
performance, employer profile and labour market profile. It also provides an economic trend
analysis and projection of how the economy of the sector might unfold and concludes with
implications for skills development. In profiling the five sub-sectors of the MICT sector, research data
from multiple sources is utilised, and where possible, disaggregated with provisos.
1.1 Scope of coverage
The MICT sector is made up of five sub-sectors that are interrelated but also quite distinct and
identifiable. These are:
− Advertising
− Film and Electronic Media
− Electronics
− Information Technology
− Telecommunications
The standard industry classification (SIC) codes that demarcate the MICT sector fall under four
different sub-industries, namely: (1) manufacturing; (2) transport, storage and communication; (3)
finance, insurance, real estate and business services; and (4) community, social and personal
services. Table 1 lists the economic activities and SIC codes allocated to the MICT SETA and the
derived MICT sub-sectors.
Table 1: The MICT SETA SIC Code List
Sub-Sector SIC- Description
Code
Advertising 8831 Advertising
0
8831 Activities of Advertising Agents
1
8831 Commercial Design
3
Film and 9611 Motion Picture and Video Production and Distribution
Electronic 0
Media 9611 Related Activities - Film and Tape Renting to Other Industries, Booking,
2 Delivery and Storage
9611 Film and Video Reproduction
3
9612 Bioscope Cafes
3
9613 Production and Broadcast of Radio and Television Broadcast Content
2
9620 News Agency Activities
0
8894 Photographic Activities
0
Electronics 3579 Manufacture of Alarm Systems
1
5Sub-Sector SIC- Description
Code
7521 Security Systems Services except Locksmiths
6
7521 Office Automation, Office Machinery and Equipment Rental Leasing
7 including Installation and Maintenance
8600 Electronic and Precision Equipment Repair and Maintenance Computer
4 Maintenance and Repairs
8601 Consumer Electronics Repair and Maintenance
0
8601 Other Electronic and Precision Equipment Repair and Maintenance
3
8601 Repair and Maintenance of Electronic Marine Equipment
4
8714 Research and Development of Electronic Equipment and Systems
2
8714 Import and Product Integration of Pre-Manufactured Electronic It and
3 Telecommunications Equipment
8714 Research and Development in The Physical and Engineering Sciences
6
8714 Electronics Importation and Product Integration of Pre-Manufactured
7 Electronics It and Telecommunications Equipment
9613 Installation, Maintenance and Repair of Tracking Devices for Cars
3
Information 8600 Software Publishers Prepacked Software
Technology 1
8600 Computer Systems Design and Related Services Computer Integrated
2 Design
8600 Computer Facilities Management Services
3
8600 Computer Rental and Leasing
5
8600 Computer Programming Services
6
8600 Other Computer Related Activities
7
8600 Call Centre Systems Development and Installations Activities Call Centre
8 and Customer Relationship Management System Development
8600 Computer System Design Services and Integrated Solutions
9
8601 Computer and Office Machine Repair, Maintenance and Support Services
1
Tele- 7520 Telecommunication
communicatio 0
ns 7520 Wired Telecommunication Carriers Telegraph
1
7520 Television Broadcasting, Television and Radio Signal Distribution Television
2 and Radio Signal Distribution
7520 Cable Networks and Programme Distribution Cable TV Services
6Sub-Sector SIC- Description
Code
3
7520 Telephone
4
7520 Wireless Telecommunication Carriers except Satellite Radiotelephone
5
7520 Television Broadcasting
9
7521 Telecommunications and Wired Telecommunication Carriers
1
7521 Paging
2
7521 Cellular and Other Wireless Telecommunications
3
7521 Satellite Telecommunications
4
7521 Other Telecommunications
5
8601 Communication Equipment Repair and Maintenance
2
8714 Telecommunications Importation and Product Integration of Pre-
8 Manufactured Electronics It and Telecommunications Equipment
9613 Providing Radio and Television Transmission Signals
1
Source: Government Notice, No. 33756, Government Gazette, 11th November 2010
While the MICT SETA works with employers located in the sector to develop skills, it needs to be
noted that most of the skills needs, particularly ICT skills are required throughout the economy and
when doing research into supply and demand and developing supply side strategies, the SETA is
required to consider these.
Though the sub-sectors are wide-ranging, they are nevertheless interconnected. The sector can be
disaggregated into Information Communication Technologies (ICT) producing activities and ICT using
activities. It is located on the convergence between content, commerce, community and the tools
that support them.
7Figure 1: MICT Convergence Chain
Figure 1 shows the covered array of segments, including news, market research, business process
automation, media, data services, software, hardware, telecoms, financial and risk information, and
security among others. Essentially, the sector is anchored by the role of unified communications
which enable access, storage, transmission and manipulation of information.
1.2 Key role players
The key stakeholders that contribute to the sector policy and regulatory environment include
industry and employer bodies, professional bodies, and state organs. There are four key government
departments that have links with the work of the sector. Professional associations advance
professional learning and continuous development amongst professionals in the sector whilst the
two major trade unions representing the interests and rights of workers in the sector are
Broadcasting Electronic Media and Allied Workers Union (BEMAWU), and the Communication
Workers Union (CWU). Some of the key industry bodies and associations advancing the particular
interests of their members, as well as state organs and professional bodies are listed in Table 2. (The
list is however not exhaustive).
Table 2: Key role players in the MICT sector
Stakeholder Role
Department of The Department has responsibility for policy development in the
Communications communications sector. The work of the Department interfaces with the
telecommunications sub-sector in terms of providing policy direction for
the sector. The Department also has shareholder control over the South
African Broadcasting Service (SABC) a major player in the film and
electronic media sub-sector.
Department of The Department is the custodian of the National Innovation Policy and
Science and has a number of agencies that are at the forefront of research,
Technology development and technological advancement. The Department funds
research, development and innovation in technology through various
programmes.
Department of The Department through the Industrial Policy Action Plan (IPAP) plays a
Trade and Industry developmental role, particularly in the electronic media and electronics
8Stakeholder Role
sub-sectors. Industrial incentive packages are offered by the Department
to encourage industrial development and investment in these sub-
sectors.
Department of The Department is the custodian of the Integrated ICT Policy White
Telecommunications Paper and has a number of agencies that are at the forefront of
and Postal Services research, development and technological advancement.
Broadcasting The Broadcasting Complaints Commission was set up by the National
Complaints Association of Broadcasters (NAB) in 1993 to adjudicate and mediate
Commission of complaints against any broadcaster who has signed its code of conduct.
South Africa It is entirely independent from the NAB and the broadcasters, with
commissioners appointed by an independent panel, and chaired by a
retired judge of the Appellate Division of the Supreme Court.
Media Development MDDA was set up by an Act of Parliament (Act 14 of 2002) to enable
and Diversity "historically disadvantaged communities and persons not adequately
Agency (MDDA) served by the media" to gain access to the media. Its beneficiaries will be
community media and small commercial media. To achieve its objective,
the MDDA encourages ownership and control of, and access to, media by
historically disadvantaged communities, historically diminished
indigenous language and cultural groups; encourages the channelling of
resources to community and small commercial media; encourages
human resource development and capacity building in the media
industry especially amongst historically disadvantaged groups; and
encourages research regarding media development and diversity.
Film and The FPB is a statutory body whose role is to regulate the media sector
Publications Board through classification of content. The Board regulates the creation,
(FPB) production, possession, and distribution of certain publications and
certain films by means of classification, the imposition of age restrictions
and giving of consumer advice. In addition, the FPB advances the rights
of children through making exploitative use of children in pornographic
publications, films, or on the internet, punishable.
Independent ICASA is the regulator for the South African communications,
Communications broadcasting and postal services sector. ICASA was established by an Act
Authority of South of statute, the Independent Communications Authority of South Africa
Africa (ICASA) Act of 2000, as amended. The Postal Services Act for the regulation of
the postal sector spells out ICASA’s mandate in the Electronic
Communications Act for the licensing and regulation of electronic
communications and broadcasting services. Enabling legislation also
empowers ICASA to monitor licensee compliance with license terms and
conditions, develop regulations for the three sectors, plan and manage
the radio frequency spectrum as well as protect consumers of these
services.
Government GITOC is a body made up of Chief Information Officers of government
Information departments across South Africa. It aims to discuss issues of mutual
Technology interest and to mainstream excellence in information technology across
Officers Council the public service. One of the main programmes of the GITOC is free
(GITOC) open access software (FOSS), which they are trying to implement across
government.
National The NAB is a non-profit group of organisations and individuals working in
Association of broadcasting and related industries. NAB helps the industry regulate and
9Stakeholder Role
Broadcasters (NAB) promote itself grounded in the principles of democracy, diversity and
freedom of expression.
National Electronic NEMISA came into being as an institution of education and learning,
Media Institute of specialising in teaching production and technical skills applicable to the
South Africa TV, radio and broadcasting industries. Formed as part of a government
(NEMISA) initiative in 1998, its fundamental purpose was to train previously
disadvantaged individuals, particularly women, and equip them with the
skills necessary to play significant roles in the broadcasting environment.
The newly revitalised institute offers meaningful, targeted and relevant
coursework covering the entire spectrum of the production activities
serving the converging technologies for digital content production. It
offers training in all the disciplines essential in the emerging world
where video, sound, graphics, animation, telephony and data meet in
the merger of computers, satellites, television and Internet.
Advertising Even though this initiative was started outside of government, ASA
Standards works closely with the Department of Communication in monitoring and
Authority of SA complying with national priorities and guidelines as well. Their chief
(ASASA) function is to ensure that advertising agencies abide by national and
international norms and standards, that competitive advertising adheres
to national statutes and that fair play is maintained amongst competing
industries. The ASA is set up to allow the sector to become self-
regulatory within a country where freedom of expression is guaranteed,
but where responsible marketing and advertising is closely monitored to
protect the public laws related to children, gender, faith and race.
South African SACF is a non-government industry association, which was formed in
Communications 2001. The key members of this forum are the stakeholders in the
Forum (SACF) Telecommunications, Information Technology, Electronics and the
Broadcasting industries.
Institute of IITPSA actively engages with commerce, industry and government in
Information order to influence policy formulation on behalf of both its own members
Technology and other stakeholders. The Society also encourages the growth of
Professionals South professionalism and the responsible and professional use of Information
Africa (IITPSA) and Communications Technology throughout the South African
economy.
Black Information The Black Information Technology Forum is an association of Black
Technology Forum individuals formed specifically to address the poor representation of
(BITF) Blacks in the information and communications technology industry as
both professionals and business operators.
1.3 Economic performance of the sector
Although the MICT sector is characterised by rapid technological change, research points to lagging
economic growth for the MICT sector. Factors such as the rise in internet advertising, the increase in
private funding to the film industry, the increase in users in the consumer electronics market, the
enhancements in 4G coverage and overall mobile broadband penetration, and the increase in
mobile data subscriptions and traffic positively impacts the various sub-sectors within the MICT
sector. However, this is plagued with several factors that negatively impact growth within the sector,
including delays regarding large mergers and acquisitions, deterioration of the local currency against
the dollar and euro, and on-going labour disputes in the key market sectors. Moreover,
10communications service providers (the largest ICT market segment in terms of spending), faced
regulations that imposed decreased rates for interconnection and experienced the accelerating
decline of fixed services revenue. There has also been increased pressure for data prices to be
reduced.
The South African economy moved out of the technical recession in the second quarter of 2017
when GDP growth was recorded at 2.9 per cent. The annual real estimate of GDP for 2017 increased
by 1.3 per cent following an increase of 0.6 per cent in 2016. Slower growth was recorded in quarter
three of 2017 at 2.3 per cent, after which GDP growth in the country increased by 3.1 per cent 1 in
the fourth quarter of 2017. The 2017 fourth quarter growth was primarily lead by the 37.5 per cent
growth of the Agriculture, forestry and fishing sector which contributed 0.8 of a percentage point to
GDP growth. The Manufacturing and Finance, real estate and business services industries each
contributed 0.5 of a percentage point to GDP growth.
Figure 2: Forecast sub-sector growth rates
8.00%
7.00%
6.00%
5.00% Advertising
4.00% Electronics
3.00% Film and Electronic Media
2.00% Information Technology
1.00% Telecommunications
0.00%
-1.00% 2014 2015 2016 2017 2018 2019
-2.00%
Source: Marketline, 2016; BMI, 2018; PwC,2017; IDC, 2017
South Africa’s GDP at constant 2010 prices is estimated at R3.125 trillion in 2017 (StatsSA, 2017).
The MICT sector is however estimated to have a combined GDP exceeding R300 billion. Figure 2
shows the growth rates for the sub-sectors as well as their respective forecasted growth. The
economic performance in the MICT SETA sectors are briefly discussed below:
– At the end of 2018, the overall ICT market in South Africa is forecast to reach R248 billion
($21.4 billion), and R273 billion ($23.4 billion) by 2021. This represents a CAGR of 2.9% (IDC,
2017).
– The total GDP contribution of the film industry in 2016/17 was R5.485 billion (NFVF, 2017).
– Revenue in the South African Advertising industry is forecast to increase to R54.194 billion in
2021 from R45.283 billion in 2016, which represents a 3.7% compound annual growth rate
(CAGR) (PwC, 2017).
– Revenue in the Electronics and Media industry is forecast to show a CAGR of 8.8% between
2018 and 2022 (Statista, 2017).
– The CAGR, over a three-year period between 2015 and 2017, shows an increase in revenue
by 5.5 per cent for the total telecommunication sector (ICASA, 2018).
The analysis of economic performance of the MICT sub-sectors uses Porter’s Five Forces as a
framework. The Porter’s framework analyses the subsectors beyond economic growth and considers
1 Quarter-on-quarter, seasonally adjusted and annualised at constant prices.
11competition in the industry, potential of new entrants into the industry, power of suppliers, power
of customers and threat of substitute products. This is used to foreground the key skills
development issues in the sector.
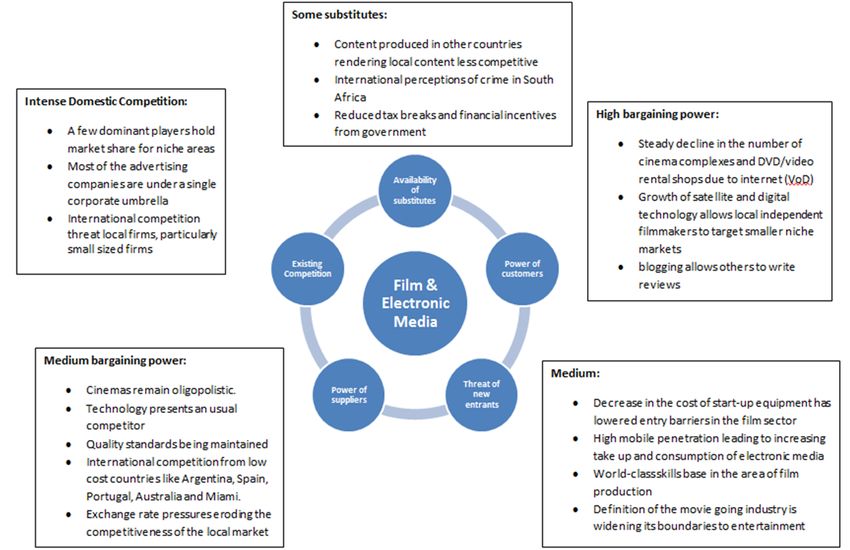
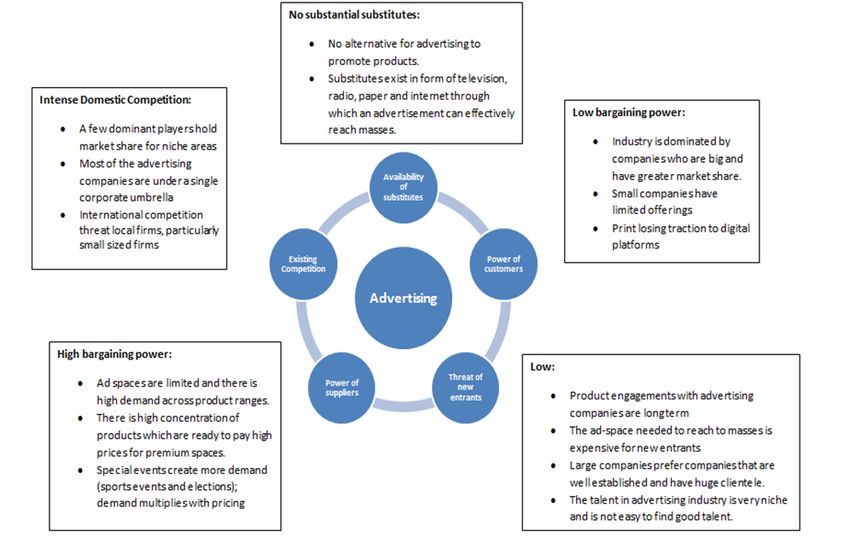
1.3.1 Advertising
South Africa’s total advertising revenue increased by 5.1 per cent year-on-year in 2016. Revenue in
this industry is forecast to increase to R54.194 billion in 2021 from R45.283 billion in 2016, which
represents a 3.7 per cent CAGR). In terms of absolute growth, internet advertising provided the
biggest contribution, with a CAGR of 12.9 per cent. Without the internet advertising revenue line,
the total industry will only grow at 2.4 per cent CAGR (PwC, 2017). Much of the rise in internet
advertising revenue, excluding Google and Facebook, is due to inferior quality “clickbait” content.
This is significantly more revenue generating than expensive, high quality content. Figure 3 provides
the sub-sector’s analysis according to Porter’s Five Forces.
Figure 3: Advertising Porter’s Analysis
What is evident from the PwC research (PwC, 2017) is that although internet advertising is growing
the most, TV advertising still dominates the advertising industry. This is the case even though
consumers spend more time on mobile devices than watching television. Reasons for this include
uncertainty around the effectiveness of internet advertising and South African advertisers feel more
comfortable using the traditional media that they understand. TV advertising revenue is forecast to
increase from R17.671 billion in 2016 to R22.130 billion in 2021, with a CAGR of 4.6 per cent over the
forecast period.
1.3.2 Film and Electronic Media
The film market in South Africa will see growth at a 5.6% CAGR to 2019 (2015: 6.1%; 2016: 3.6%;
2017: 5.2%). In 2016/17, the direct production injected into the film industry was R4.356 billion. This
caused an indirect production impact of R4.912 billion and an induced production impact of R2.952
billion, with a total production impact for 2016/17 being R12.220 billion. The total GDP contribution
12of the film industry in 2016/17 was R5.485 billion 2. The 2016/17 multiplier was R2.81 million which implies that a R1 million investment into the film industry created a R2.81 million in other production. According to the National Film and Video Foundation (NFVF), the film industry has the potential to generate significant returns for the country in which the films get shot. The production of a popular film can make a nation an ideal tourist destination as well as increase investment into the economy. In terms of economic growth, “From the beginning of the production stage to the actual editing of the final film and exhibition, the industry contributes to the economy, revenue, job creation and economic activity” (NFVF, 2017). Figure 4 provides the sub-sector’s analysis according to Porter’s Five Forces. Figure 4: Film and Electronic Media Porter’s Analysis The development of the film industry in South Africa is mostly concentrated in the Gauteng (54.8 per cent), Western Cape (23.8 per cent), KwaZulu-Natal (9.5 per cent) and Limpopo (9.5 per cent) provinces in 2016/17 (NFVF, 2017). Most of the companies are within the pre-production (38 per cent), production (38 per cent) and post-production (36 per cent) stages. Feature films (27.3 per cent) and documentaries (27.3 per cent) are what is filmed most in the country, with animation (3.0 per cent) being the least produced. 1.3.3 Electronics South Africa’s persistently poor economic performance, rising utility prices and increased costs of living negatively affects the economy, however, despite these challenges consumer electronics 2 Based on the Social Accounting Matrix (SAM) model used by NFVF. 13
continue to record positive growth rates. According to Statista (The statistical portal, 2017), the
Electronics and Media industry in South Africa consists of physical media, consumer electronics and
communication devices, amongst others. In 2017, revenue in the Electronics and Media industry
amounted to $964.3 million, of which consumer electronics made up the bulk of this at $709.2
million. Total revenue in this industry is estimated to increase to R1.056 billion with consumer
electronics revenue predicted to increase to $789.7 million in 2018, which represents a revenue
growth rate of 9.5 per cent and 11.3 per cent, respectively. After 2018, the revenue growth rate is
forecast to decline to 7.4 per cent for the total industry and 8.6 per cent for consumer electronics in
2022, a positive growth rate nevertheless. Revenue in the Electronics and Media industry is forecast
to show a CAGR of 8.8 per cent between 2018 and 2022, which results in a market volume of $1.477
billion in 2022.

The number of users in the consumer electronics market is estimated at 7.02 million in 2017,
increasing to 7.48 million in 2018. By 2022, the number is predicted to reach 9.51 million. The user
penetration rate of the consumer electronics market is estimated at 12.42 per cent in 2017 and
13.07 per cent in 2018. Figure 5 provides the sub-sector’s analysis according to Porter’s Five Forces.

                                    Figure 5: Electronics Porter’s Analysis

When looking at the age categories of users in the Electronics and Media industry, 25-34-year olds
make up the greatest portion (35.78 per cent) followed by 18-24-year olds (25.14 per cent). In terms
of the gender divide, males account for the bulk of the users (57.2 per cent) with females not too far
behind at 42.8 per cent. Also, 43.43 per cent of the users are high income earners 3.

3   Found online at: https://www.statista.com/outlook/245/112/electronics-media/south-africa#

14
1.3.4 Information Technology (IT) The South African ICT sector is well established. The sector market is the largest in Africa and contributes approximately 8.2% to South Africa’s GDP. South Africa serves as the African leader of the ICT industry. Also, in 2017, the country is predicted to have had the greatest ICT expenditure across the Middle East, Turkey and Africa regions. It is forecast to have had a $10.5 billion spend in 2017 “as technologies such as cloud, big data, social, and mobility become investment imperatives and dominate the ICT decision-making agenda” (Huawei, 2017). At the end of 2018, the overall ICT market in South Africa is forecast to reach R248 billion ($21.4 billion), and R273 billion ($23.4 billion) by 2021. This represents a CAGR of 2.9 per cent (IDC, 2017) 4. Figure 6 provides the sub-sector’s analysis according to Porter’s Five Forces. 4 Found online at: https://www.itweb.co.za/content/xnklOvzbkd8v4Ymz 15
Figure 6: Information Technology Porter’s Analysis

The country is ranked 31st out of 50 in the latest Global Connectivity Index, up by 2 points since 2015
when the country ranked 33rd (Huawei, 2017). Factors that impacted this improved position is the
enhancement in “4G coverage and overall mobile broadband penetration” as well as average
performance in terms of data centres, broadband and cloud services. However, it should be noted
that the country’s Fibre to the House (FTTH) and fixed broadband significantly falls behind, which
could negatively impact further progress in the usage of data and cloud services. As it stands, the
market earned revenues in the cloud computing market in South Africa is expected to double by
2018. Going forward, South Africa should start the development of 5G as this is predicted to
dominate mobile subscriptions by 2022 in Africa (Huawei, 2017).

1.3.5 Telecommunications
According to StatsSA, 87.0 per cent of households in the country had access to a cellular phone
whilst 9.4 per cent had access to both a cellular phone and landline in 2016 (GHS, 2017). Household
consumption expenditure on communication was R70.869 billion in 2016 and increased to R74.386
billion in 2017. In terms of economic growth, the communication sector grew by 3.8 per cent in
2016 5 and contributed 2.7 per cent to Gross Domestic Product (GDP) 6.

Revenue in the telecommunications sector is broken up into total mobile services revenue, total
fixed internet and data revenue, total fixed line revenue as well as total any other revenue (ICASA,
2018). The total telecommunication sector revenue increased by 10.1 per cent between 2016 and
2017, from R148.849 billion to R163.987 billion. A breakdown of this shows an increase in total
mobile services revenue by 10.4 per cent, which is mainly due to the increase in revenue from

5   At constant 2010 prices
6   At constant 2010 prices and Calculated using GDP at market prices

16
mobile data services, voice services as well as from other mobile services. Total fixed internet and
data revenue increased by 62.1 per cent, which further explains the increase total in the
telecommunication sector. This increase is due to the growth in revenue from fixed (wired)-
broadband services, revenue from other telecommunication services, including leased lines and
fixed value-added telecommunication services, and revenue from other wireless-broadband
services. In contrast, total fixed line revenue declined between 2016 and 2017, from R13.736 billion
to R13.416. This negatively impacted the growth of the telecommunication sector. The decline in
total fixed line revenue was due to decreased revenue from fixed-telephone subscription charges,
revenue from fixed-telephone calls and from retail fixed-telephone services. Figure 7 provides the
sub-sector’s Five Force analysis.

Figure 7: Telecoms Porter’s Analysis

In terms of telecommunications subscriptions, mobile cellular subscriptions increased by 0.1 per
cent between 2015 and 2017 due to the increase in prepaid mobile cellular subscriptions. Machine
to machine (M2M) mobile-network subscriptions increased by 15.4 per cent over the three years,
being at 5.806 million at 30 September 2017. The CAGR of fixed broadband subscriptions increased
significantly by 65.1 per cent over the three-year period due to an increase in DSL internet
subscriptions, fibre-to-the-home/building internet subscriptions as well as other fixed (wired)
broadband subscriptions. In contrast, the CAGR of fixed line subscriptions declined by 2.6 per cent
over a three-year period mainly due to an 87.0 per cent decline of fixed wireless local loop
subscriptions. This contributes to the decline in fixed line traffic by 10.2 per cent between 2015 and
2017. Mobile data and smart phone subscriptions increased between 2016 and 2017, being at
61.391 million and 42.094 million in 2017, respectively. Between 2016 and 2017, Mobile data traffic
increased significantly by 67.3 per cent. With respect to 3G and 4G/LTE population coverage,
between 2016 and 2017, 3G coverage remained stable at 99 per cent and 4G/LTE coverage
increased to 77 per cent from 75 per cent.

17
1.4       Employer profile

In 2018, the MICT sector is made up of 29000 employers, which are spread across the five sub-
sectors. The sub-sector that accounts for the least number of employers in the MICT sector is the
Film and Electronic media at 7 per cent, whilst the Information Technology sub-sector is the largest,
accounting for 50 per cent of employers. Telecommunication is the second largest at 18 per cent,
Electronics at 14 per cent and Advertising is at 11 per cent.

                                   Figure 8: The MICT Sector of Employers per Sub-Sector
Employers                                                       Levy Payers

Source: The MICT SETA OGS, 2018

Figure 8 shows the organisations’ paying levies and represents approximately 25% of all employers
in the sector. The number of levy paying employers has increased by 10.2% in 2017 (7089
employers), up from 6602 employers in 2016. The R500, 000 total payroll threshold has not been
changed in many years implying that with payroll inflation new employers are likely to be added
annually. (The levy is based on 1% of employee earnings.) The Information Technology sub-sector
contributes the highest total value at 44 per cent, amongst levy paying employers. This sub-sectors’
contribution declined from 49 per cent in 2017 and 51 per cent in 2016. The telecommunication sub-
sector showed a significant increase to 29 per cent in 2018 from 14 per cent in 2017 and 12 per cent
in 2016, an increasing trend.

Table 3 shows that between 2017 and 2018, there has been a 7.5 per cent increase in the employer
base of the sector, with small sized employers’ accounting for the bulk of this increase. In 2018,
small sized enterprises employing less than 50 people made up around 96 per cent of the total
number of employers in the sector. Large employers’ accounts for 1.5 per cent of the total employer
base whilst medium companies make up 2.7 per cent. Between 2017 and 2018, the number of
medium sized employers increased by 2.1 per cent with large employers increasing by 5.8 per cent.

                                  Table 3: The MICT sector size of employers per Sub-Sector

                                            Large (150+)             Medium (50-149)          Small (0-49)

Sub-Sector                                  2017           2018      2017        2018         2017       2018
Advertising                                 18             19        53          52           2 831      3 029
Electronics                                 76             77        113         113          2 946      3 173
Film and Electronic Media                   47             55        56          56           2 615      2 827
Information Technology                      170            171       351         357          12 178     12 881
Tele-communications                         54             64        100         109          2 493      2 922
Grand Total                                 365            386       673         687          23 063     24 832
Source: The MICT SETA OGS, 2018

18
More than half of the employers are located within the Gauteng province (53%) followed by
Western Cape (21%) and KwaZulu-Natal (10%). The Gauteng province hosts about two-thirds of the
country’s ICT employers. The less industrialised provinces predominantly host small employers.
1.5 Labour market profile
The labour market profile of the MICT sector is complicated by the agglomeration of media, ICT and
electronics industries into one. However, the majority of the people employed in the sector are
under communications (SIC 75). The profile has to be understood in the context of a high
unemployment in the country. In the first quarter of 2018, unemployment was recorded at 26.7 per
cent (StatsSA, 2018). Employment in the communications sector fluctuated, gradually increasing
between 2006 and 2013 before declining between 2013 and 2016 (Figure 9).
Figure 9: Employment in the MICT related industries
Employment in Communications (SIC 75)
180,000
160,000
140,000
120,000
100,000
80,000
60,000
40,000
20,000
-
2006 2007 2008 2009 2010 2011 2012 2013 2014 2015 2016
Source: Quantec Easy Data, 2017
1.5.1 Employment trends across WSP submitting employers
The number of employees in the sector is estimated using WSP submissions by employers as there is
no disaggregated employment data from Stats SA. Total number of employees recorded from
employer levy records in 2018 is 193 604. In 2017, there were 238 785 people employed in
companies submitting WSPs, down from 297 831 based on 2016 submissions. The consistency of
employers in submitting annually is important and the lack thereof always leads to anomalies. Figure
10
Figure 10 below shows that employment in the Information Technology sub-sector is the largest of
the sub-sectors with 44.9 per cent of employees in 2018 and Advertising the smallest with about 5.7
per cent of employees. As with the relative share of the number of companies in each sub-sector,
the relative share in terms of number of employees has remained stable between 2017 and 2018.
19You can also read