Updated Through 11/14/2017 Town of Georgetown Housing Production Plan - PREPARED FOR: Georgetown Affordable Housing Trust - Georgetown MA
←
→
Page content transcription
If your browser does not render page correctly, please read the page content below
Updated Through 11/14/2017
Town of Georgetown
Housing Production Plan
PREPARED FOR: Georgetown Affordable Housing Trust

                           Georgetown Town Hall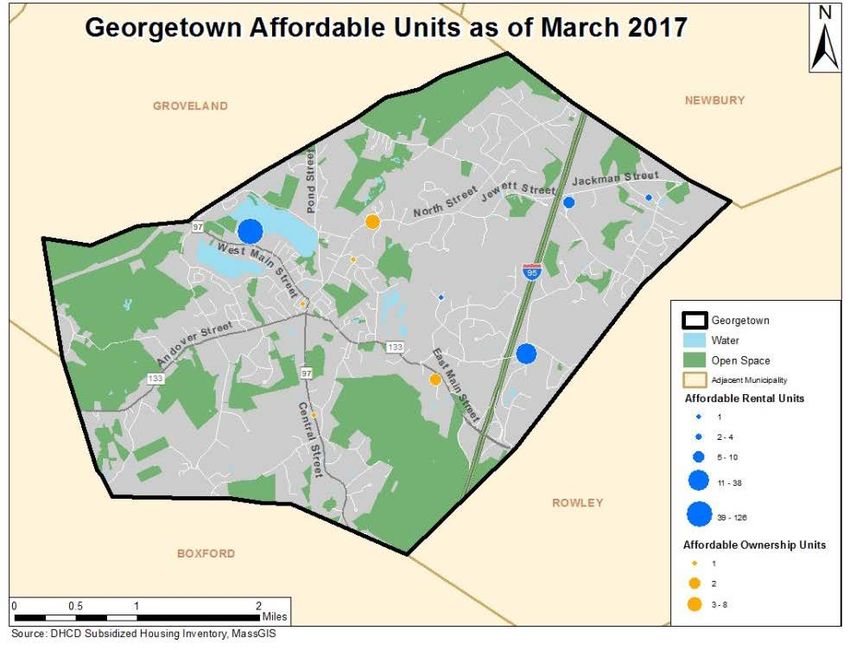
Table of Contents
Section 1: Executive Summary................................................................................................................................ 4
  Affordable Housing Trust ..................................................................................................................................... 4
  Methodology ........................................................................................................................................................... 4
  Acknowledgements................................................................................................................................................ 6
  Affordable Housing – Definitions and Glossary of Terms ............................................................................... 6
Section 2: Summary of Key Findings .................................................................................................................... 9
  Community and Demographics ........................................................................................................................... 9
  Housing ................................................................................................................................................................... 9
  Subsidized Housing Inventory ........................................................................................................................... 10
  Affordable Housing Supply ................................................................................................................................ 10
  Affordability Gap ................................................................................................................................................. 11
  Demand for Housing ........................................................................................................................................... 11
  Tools and Funding ............................................................................................................................................... 12
  Constraints ............................................................................................................................................................ 12
  Accomplishments ................................................................................................................................................. 12
  Affordable Housing Goals .................................................................................................................................. 13
  Implementation Strategies .................................................................................................................................. 13
Section 3: Demographic Analysis ........................................................................................................................ 15
  Community Description ...................................................................................................................................... 15
  Senior Services ...................................................................................................................................................... 16
  Veterans Services .................................................................................................................................................. 17
  Population Growth............................................................................................................................................... 17
  Population Density ............................................................................................................................................... 18
  Age Distribution ................................................................................................................................................... 19
  Race ........................................................................................................................................................................ 21
  Household and Family Growth.......................................................................................................................... 21
  Household Type and Size ................................................................................................................................... 22
  Household Income ............................................................................................................................................... 23
  Rent Burden .......................................................................................................................................................... 25
  Poverty of Individuals and Families .................................................................................................................. 26
  Education ............................................................................................................................................................... 27
  Employment, Industry, and Occupation........................................................................................................... 27
  Commuting ........................................................................................................................................................... 29
  Unemployment ..................................................................................................................................................... 30
Section 4: Housing Characteristics ...................................................................................................................... 31
  Housing Units ....................................................................................................................................................... 31
  Age of Housing Stock .......................................................................................................................................... 31
  Housing Type........................................................................................................................................................ 32
  Tenure and Residency ......................................................................................................................................... 33
  Building Permit History ...................................................................................................................................... 34
  Assessed Valuation .............................................................................................................................................. 35
  Tax Rate and Tax Bills.......................................................................................................................................... 36
Section 5: Affordable Housing Inventory .......................................................................................................... 39
  Chapter 40B ........................................................................................................................................................... 39
  Subsidized Housing Inventory ........................................................................................................................... 39
  State Public Housing ............................................................................................................................................ 42

2|Page
Federal Public Housing ....................................................................................................................................... 42
  Public Housing in Georgetown .......................................................................................................................... 42
  Private Affordable Rental Housing in Georgetown ........................................................................................ 43
  Market-Rate Rental Housing .............................................................................................................................. 44
  Private Affordable Ownership Housing ........................................................................................................... 46
  Market-Rate Ownership Housing ...................................................................................................................... 46
  Planned Affordable Housing .............................................................................................................................. 48
Section 6: Demand Analysis ................................................................................................................................. 49
  Affordability Gap ................................................................................................................................................. 49
     Homeownership .................................................................................................................................................. 49
     Rental.................................................................................................................................................................. 50
  Demand for Housing ........................................................................................................................................... 51
Section 7: Zoning Review ...................................................................................................................................... 54
  Inclusionary Housing Balance Bylaw ................................................................................................................ 54
  Independent Senior Housing Bylaw .................................................................................................................. 55
  Open Space Residential Development Bylaw .................................................................................................. 55
  Other Zoning Initiatives ...................................................................................................................................... 56
Section 8: Funding Mechanisms For Affordable Housing.............................................................................. 57
  Community Preservation Act ............................................................................................................................. 57
  HOME Funds ........................................................................................................................................................ 58
  Community Development Block Grant Program ............................................................................................ 59
  Affordable Housing Trust ................................................................................................................................... 59
  Senior Citizen Property Tax Incentive Program .............................................................................................. 59
  Historic Tax Credits ............................................................................................................................................. 59
Section 9: Constraints on Future Development ................................................................................................ 61
  Transportation Constraints ................................................................................................................................. 61
  Wastewater Management Constraints .............................................................................................................. 61
  Water Constraints ................................................................................................................................................. 62
  Conservation Constraints .................................................................................................................................... 62
  Other Constraints ................................................................................................................................................. 62
Section 10: Affordable Housing Trust Accomplishments............................................................................... 63
Section 11: Affordable Housing Goals ............................................................................................................... 64
  Georgetown Housing Production Program...................................................................................................... 64
Section 12: Implementation Strategies ............................................................................................................... 67
  Education and Capacity Building Strategies .................................................................................................... 67
  Zoning and Planning Strategies ......................................................................................................................... 70
  Housing Inventory Preservation Strategies ...................................................................................................... 73
  Housing Production Strategies ........................................................................................................................... 74
  Short Term Action Plan ....................................................................................................................................... 77
Other Matters ........................................................................................................................................................... 79
  Works Cited .......................................................................................................................................................... 79
Appendix A – Glossary of Terms.......................................................................................................................... 82
Appendix B – Town of Georgetown Subsidized Housing Inventory as of February 23, 2017 .................. 90
Appendix C–Subsidized Housing Inventory ..................................................................................................... 91
Appendix D – Town of Georgetown Zoning Map ............................................................................................ 92
Appendix E – Potential Affordable Development Sites................................................................................... 93

3|Page                                                                                         LDS Consulting Group, LLC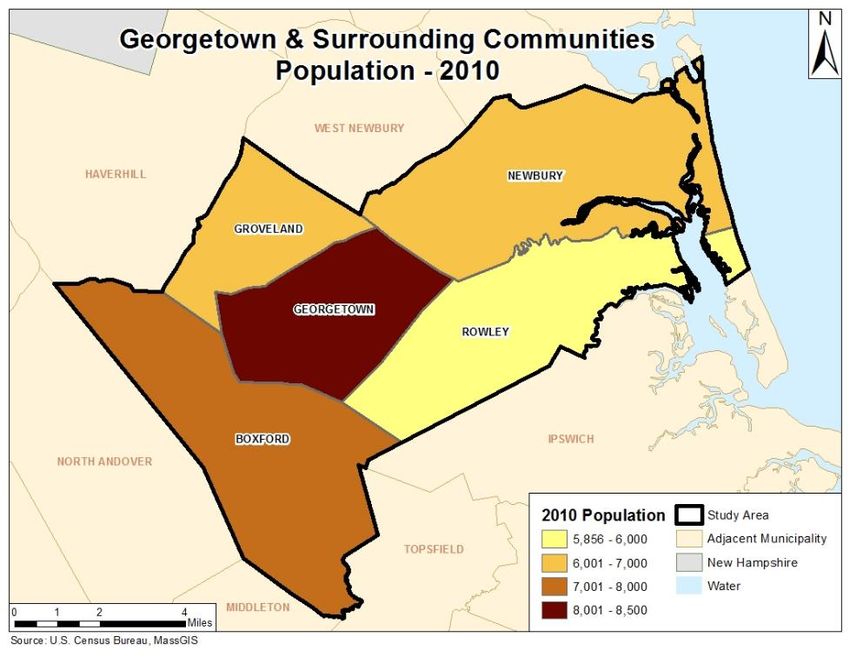
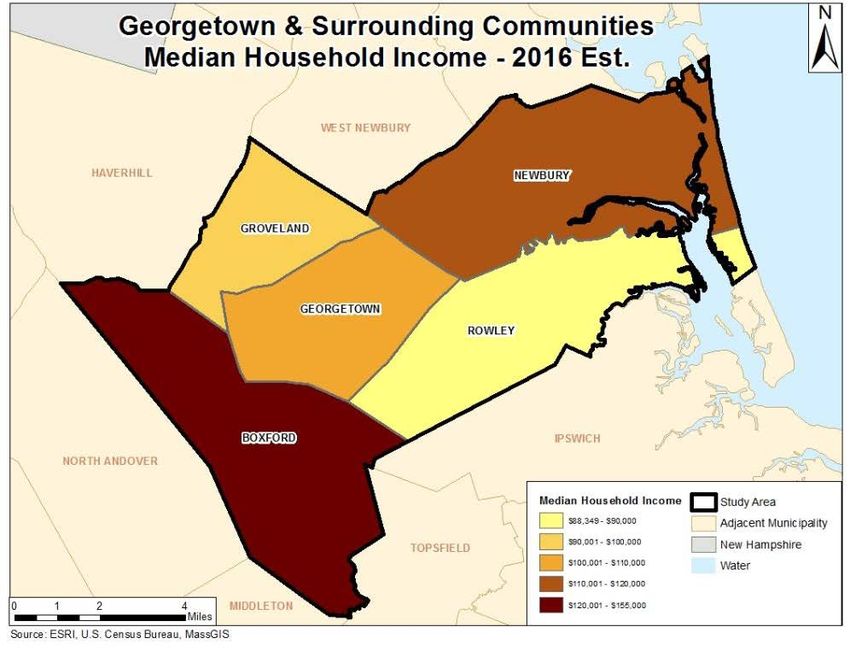
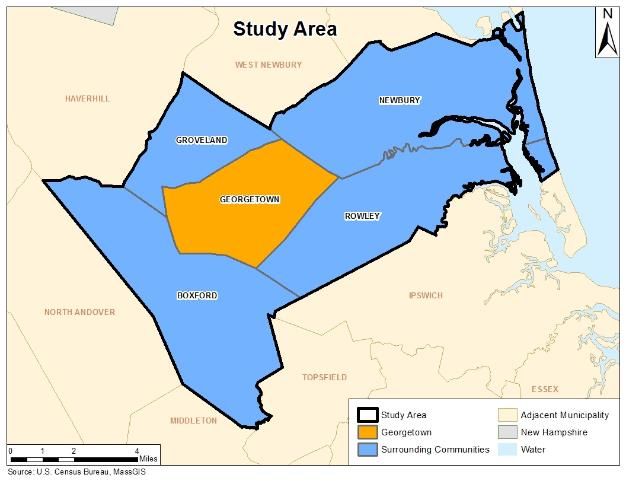
Section 1: Executive Summary
The Town of Georgetown Affordable Housing Trust (the “Trust”) hired LDS Consulting Group,
LLC (LDS) to update the 2011 Affordable Housing Production Plan completed by LDS – into an
updated, new Housing Production Plan (the “Plan”) for submission to the Massachusetts
Department of Housing and Community Development (DHCD) in accordance with 760 CMR
56.00. The first part of the Plan contains an Affordable Housing Needs Assessment (“HNA”),
which identifies the supply and demand for affordable housing in Georgetown. The second half
of the Plan, contains a strategic plan to assist the Trust in determining how it should best direct
and leverage its resources to meet the affordable housing needs in Georgetown.

One of the guiding principles LDS followed in its work is described in the Town of Georgetown
Vision Statement, which was published in the 2004 Community Development Plan. That plan
stresses the importance of offering housing choices while remaining true to the community’s
character (Georgetown Master Plan Committee, 2004). Specifically, the plan provides the
following vision statement for “Living in Georgetown” in 2023 (Georgetown Master Plan
Committee, 2004, pp. V-2):

“In addition to Georgetown’s neighborhoods of single family homes, the Town now offers a
greater variety of housing choices, including condominiums and rental apartments affordable
to longtime residents and seniors who wish to downsize their housing, young people starting
out in life, and town employees. The town continues to achieve state goals for affordable
housing through housing development that complements Georgetown’s character, aided by
CPA funding. Zoning standards and guidelines ensure that new construction is sensitive to the
surrounding landscape and neighborhood.”

Affordable Housing Trust
The Town of Georgetown formed an Affordable Housing Trust (“Trust”) in September 2009 as
an outgrowth of the Affordable Housing Task Force. The Trust, which has a five-member
Board of Trustees, has a mission to “provide for the preservation and creation of affordable
housing in the Town of Georgetown for the benefit of low and moderate-income households”
(Town of Georgetown, 2009). It has several powers, including the ability to buy, retain,
construct and improve property. Its current members are Paul Nelson Secretary of the Trust,
Shawn McGee, Timothy Gerraughty Chair of the Trust, Charles Keilty, and Board of Selectman
Chair David Surface who is also the Treasurer of the Trust (Georgetown, 2017).

Methodology
LDS reviewed previous planning studies in Georgetown, including the 2003 Georgetown
Affordable Housing Plan prepared by LDS, 2004 Community Development Plan, 2007 Master
Plan, and 2011 Housing Production Plan prepared by LDS. LDS has provided updated
demographic and housing data for the town of Georgetown and surrounding communities (the
“Study Area”), shown in the map below, by reviewing the latest Census data, including data
4|Page                                               LDS Consulting Group, LLC
from the American Community Survey (“ACS”), local assessment information, ESRI reports
and other sources. ESRI projects trends in population, households and other matters in five-
year increments. Using this demographic data, LDS has then compared Georgetown to its
neighboring towns as well as Essex County and the Commonwealth of Massachusetts.

                         Map 1 – Georgetown and Surrounding Communities

The ACS is a nationwide survey designed to provide communities with a fresh look at how they
are changing. It is a critical element in the Census Bureau’s reengineered decennial census
program. The ACS collects and produces population and housing information every year
instead of every 10 years. However, the data sample is significantly smaller than the summary
field data collected in the regular census and therefore, in smaller municipalities, there are
larger margins of error.

LDS also examined the housing inventory for the Town of Georgetown. This was done by
reviewing past studies and interviewing local officials and property managers. The Multiple
Listings Service, Warren Group and other sources were also used to understand the historic and
current housing market. In addition to creating a housing inventory, LDS has provided an
overview of the Town of Georgetown Zoning Bylaw and local initiatives that promote and fund
affordable housing in Georgetown. This information was gathered through interviews with

5|Page                                              LDS Consulting Group, LLC
local officials, a review of the Zoning Bylaw and other research. We also included a summary of
the potential constraints on future development. LDS interviewed Georgetown officials and
examined past studies to obtain this information.

This information will be used to develop affordable housing goals and implementation
strategies for the Town of Georgetown.

All research was completed in February and March of 2017. This report is reflective of the data,
market conditions and conclusions considered at this point and time. The information
furnished by others is believed to be reliable. However, no warranty is given for its accuracy.
The report, or a copy thereof, may not be used for any purposes other than those set forth
herein without the written consent of the author, and in any event, only with the proper written
qualifications and only in its entirety.

We have reported our findings in summary form in Section 2, and matters are explained in
more detail in the sections that follow. A summary of the sources utilized in this report can be
found at the end of the study in a section titled “Other Matters”.

Acknowledgements
We would like to thank the members of the Trust as well as Town Administrator Michael
Farrell for helping pave the way for us to gather information from various Town departments
and answering many questions. We could not have accomplished this without your time and
dedication. We also want to acknowledge the efforts of the Town of Georgetown Planning
Department, Building Inspector, Council on Aging, Assessors Department, Town Clerk,
Veterans Services, Water Department and School Department.

Affordable Housing – Definitions and Glossary of Terms
In order to assist readers in understanding terms used through the study, we have provided an
overview of affordable housing. A complete glossary of affordable housing terms can be found
in Appendix A, at the end of this report. The term “affordable housing” can have different
meanings in different contexts. Typically we refer to affordable housing by the income one
needs to earn in order to qualify to live in affordable housing. According to HUD, housing is
therefore considered affordable if a household pays no more than 30% of its income toward
housing costs.

Affordable housing can be subsidized (i.e. a resident pays 30% of their income for rent and the
government subsidizes the rest) or “self – pay” (i.e. the rent is lower than market and the tenant
pays the lower rent). Examples of subsidized housing are most public housing units and
persons that utilize a Section 8 mobile voucher to pay rent. Note that affordable housing that is
“self – pay”, insofar as it is not subsidized on the rental side, often has received capital or
development subsidies that enable developers/owners to charge below market rents.

6|Page                                               LDS Consulting Group, LLC
Area Median Income (AMI”) is tied to the income limit in a particular location. HUD starts by
calculating income limits based on median family income which is a four person household. It
then adjusts for household size. It then adjusts for income limit. Extremely low income is 30%
of AMI, very low income is 50% of AMI, and low income is 80% of AMI.

The term “low-income” housing generally refers to housing that is affordable to households
earning up to 80% of AMI. According to HUD, Georgetown is located in the Lawrence Primary
Metropolitan Service Area (“PMSA”) for purposes of calculating affordable income limits, rents
and homeownership prices. A household qualifying at 80% of AMI in this area could earn no
more than $52,600 for a two-person household, or $65,700 for a four-person household.

“Very low-income” housing is typically affordable to qualifying households earning no more
than 50% of AMI; that would be $33,650 for a two-person household or $42,050 for a four-
person household. These two income levels – 50% and 80% of AMI – are used in “Chapter 40B
projects” (see glossary for information on Massachusetts General Law Chapter 40B later in this
report). For units to qualify for inclusion on the Commonwealth’s Subsidized Housing
Inventory, among other things, they need to be income restricted to less than 80% of AMI. Table
1 below shows the income limits for households in Georgetown by household size.

                                            Table 1
                  2016 INCOME LIMITS FOR AFFORDABLE HOUSING IN GEORGETOWN
            Area Median Income 1 Person 2 Person 3 Person 4 Person 5 Person 6 Person
            30% AMI             $17,700 $20,200 $22,750 $25,250 $28,440 $32,580
            50% AMI             $29,450 $33,650 $37,850 $42,050 $45,450 $48,800
            60% AMI             $35,340 $40,380 $45,420 $50,460 $54,540 $58,560
            80% AMI             $46,000 $52,600 $59,150 $65,700 $71,000 $76,250
            110% AMI            $64,790 $74,030 $83,270 $92,510 $99,990 $107,360

Table 2 below identifies the maximum allowable rents for affordable housing in Georgetown in
2016, the most recent data available. It shows, for example, that the monthly rent of a one-
bedroom unit in Georgetown that is affordable to households earning no more than 80% AMI
cannot exceed $1,232. The rents listed below assume that the landlord pays all utilities.

                                           Table 2
            2016 MAXIMUM ALLOWABLE RENTS FOR AFFORDABLE HOUSING IN GEORGETOWN
            # Bedrooms      SRO     Studio      1 BR  2 BR     3 BR      4 BR
            30% Rent        $331     $442      $473   $568     $671      $814
            50% Rent        $552     $736      $788   $946    $1,093    $1,220
            60% Rent        $662     $883      $946  $1,135   $1,312    $1,464
            80% Rent        $862    $1,150    $1,232 $1,478   $1,708    $1,906
            110% Rent      $1,214   $1,619    $1,735 $2,081   $2,406    $2,684

Table 3 below shows Fair Market Rents (“FMRs”) for the Lawrence PMSA (which includes
Georgetown). These rents are used for several purposes, including determining the amount of
contract rent used for the Housing Choice Voucher program, commonly known as the Section 8
mobile voucher program. This is the amount of rent a landlord can get for a unit occupied by a

7|Page                                              LDS Consulting Group, LLC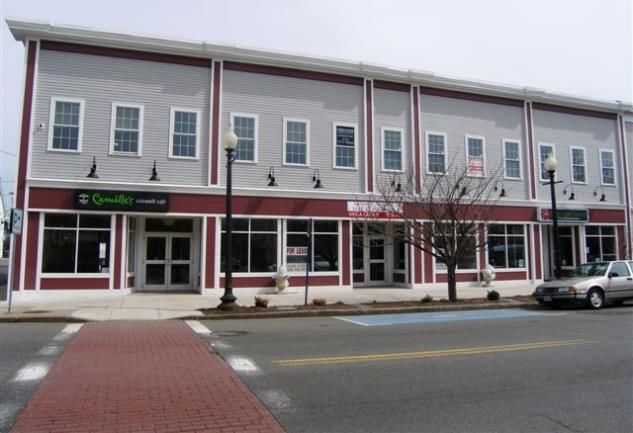
tenant with a mobile voucher. Updated and published annually, FMRs represent HUD’s
estimate of the actual market rent for an apartment in the conventional marketplace. HUD sets
FMRs by unit size (0-bedroom, 1-bedroom, etc.) and regions within each state. They include the
shelter rent plus the cost of all tenant-paid utilities, except telephones, cable or satellite
television service, and internet service.

Under this kind of arrangement, the tenant typically pays 30% of their gross income towards
rent and the federal government pays the remaining amount to the landlord. Some
communities are located in high wealth/housing cost areas and agencies administering
vouchers may be able to charge 110% or 120% of the HUD-determined FMR. Other
communities that are lower wealth with lower housing costs may not be able to charge up to
100% of FMR if the market rents are less than HUD’s FMR for the service area.

                                             Table 3
                       FY 2017 FAIR MARKET RENTS (FMR) FOR GEORGETOWN
                              Efficiency  1 BR     2 BR   3 BR   4 BR
                       FMR       $890    $1,024 $1,305 $1,633 $1,799

8|Page                                             LDS Consulting Group, LLC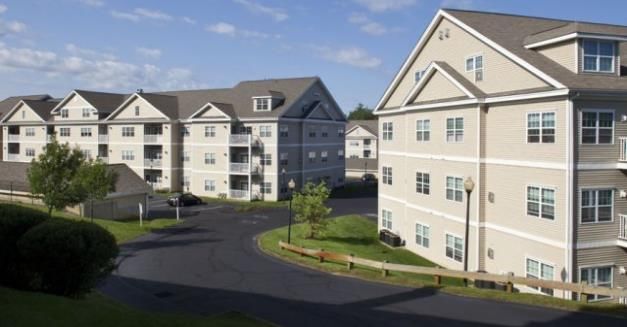
Section 2: Summary of Key Findings
Community and Demographics
Georgetown is a largely residential community that has retained its small-town feel despite
growing significantly in the last two and a half decades. Growth is attributed to excellent
highway access, proximity to major employment centers and the local school system. The town,
which had an estimated population of 8,531 in 2016, experienced a 11% population increase
from 2000 to 2010 and is projected to grow another 9% from 2010-2021. This growth rate is five
times the average rate of all communities in Essex County. In particular, Georgetown has seen
its over 45 population increase in size, shifting the demographic makeup of the community.
The number of children between the ages of 5 and 17 has continued to rise since 2000, but the
rate of growth has slowed in the last decade. In the future, the number of school-age children
will likely decrease due to a declining population of children under age 5.

The number of new households has increased at the same pace as the population, but
households have gotten smaller. Roughly 33% of Georgetown households have two people,
and 38% have three or four people. Many town residents are educated professionals with
moderately-high incomes. Median household income has also increased since 2000, reaching an
estimated $107,343 in 2016, a 30% increase since 1990. However, an estimated 51% of
households in Georgetown paid at least 30% of their income toward rent as estimated in the
2011-2015 ACS and are therefore considered rent burdened, and 13% paid more than 50% of
their income towards rent and are therefore severely rent burdened. This indicates an
immediate demand for more affordable rental housing and also supports the continued need to
fund the Trust’s rental assistance program.

Approximately half of Georgetown workers – an estimated 48% – worked in the management,
business, science, and arts occupations over the five-year period from 2011 to 2015. On average,
Georgetown residents have a longer commute to work than their counterparts in Essex County
and the Commonwealth of Massachusetts with 51% commuting over half an hour to work. As
of December 2016, the unemployment rate in Georgetown (not seasonally adjusted) is lower
than that of Essex County and the Commonwealth of Massachusetts. It declined to 3.8% in
2015, and it has further declined to 2.8% as of December 2016.

Housing
There has been a significant increase in the number of housing units in Georgetown over the
last two and a half decades. From 2000-2010, the number of units increased by 16%, which is
more than double the state’s rate of housing growth. Much of this growth occurred in the early
to mid-2000s before the major slowdown in the economy and housing market. Over 35% of the
housing stock was built within the last two and a half decades. However, an average of only 10
units per year have been constructed since 2010. Despite these changes, the town’s housing
stock continues to lack diversity. The town largely consists of single-family homes, and the vast
majority of housing units are ownership units. There are few rental options, particularly for
9|Page                                              LDS Consulting Group, LLC
lower-income residents. It should be noted that the apartments at Longview at Georgetown,
which opened in 2004, added housing diversity to the town. There has been a minimal amount
of foreclosures in the community, and foreclosed homes tend to be purchased right away.

Housing values and real estate tax bills have been increasing. The average assessed value of a
single-family home in Georgetown doubled from 2000-2017, but has only risen 6% from 2011-
2017 to $402,386. Real estate tax bills have seen a similar increase, more than doubling from
2000-2017 and increasing by 48% from 2011-2017. This has made it increasingly difficult for
lower-income residents, particularly those older residents living on fixed incomes, to remain in
Georgetown. The town has few options for first-time homebuyers. Consequently, most new
home purchases in Georgetown are by second-time home purchasers. To address increasing
real estate taxes, the Town offers lower-income seniors a tax abatement program. While the
program lowers property taxes by $500 per household, it is limited to persons who are at least
60 years old. The program has been growing steadily since it was first implemented in 2003 and
was fully subscribed with 30 participants in 2016.

Subsidized Housing Inventory
The Massachusetts Legislature enacted Massachusetts General Law Chapter 40B in 1969 to
“help address the shortage of affordable housing statewide by reducing unnecessary barriers
created by local approval processes, local zoning and other restrictions”. The state’s Subsidized
Housing Inventory (SHI) is used to measure if a municipality has reached the 10% affordable
housing threshold. According to the SHI, the Town of Georgetown had 3,031 Year-Round
Housing Units – based on the 2010 Census – and 353 SHI units as of February 23, 2017. That
means 11.65% of the town’s housing stock is considered to be affordable, and the Town of
Georgetown has exceeded the state’s 10% goal.

Affordable Housing Supply
There are a total of 216 actual affordable housing units in Georgetown. This number differs
from the SHI because not all affordable units are on the SHI, and some rental units are counted
on the SHI despite not actually being affordable due to the nuances of Chapter 40B. We also
note that two units on Lisa Lane are in the process of being added to SHI. The Georgetown
Housing Authority has 126 elderly and handicapped rental units on Trestle Way, which are
100% occupied. The wait time is two years for elderly applicants and two plus years for young-
disabled applicants with 50 households currently waiting for a unit. The Housing Authority
also has 10 family rental units on Jewett Street, which are 100% occupied. The average wait time
for a family unit is seven to 10 years with 15 families waiting for a unit.

Georgetown has one apartment building with affordable rental units; the development,
Longview at Georgetown, is owned by a private developer. The 186-unit project was permitted
under Chapter 40B in 2002 and opened in 2004. It includes 38 units that are affordable to
households earning up to 50% of AMI. There are only five Section 8 mobile voucher holders,
and therefore the majority of units are private pay. Rents for one- and two-bedroom affordable

10 | P a g e                                        LDS Consulting Group, LLC
units are $698 and $821, with tenants paying for utilities. Market-rate rents for one- and two-
bedroom units are $1,530 and $1.755 - $1,860, with tenants paying utilities. The affordable units
are in high demand with 30 households waiting for a unit and appear to have filled a much-
needed gap in the town’s housing stock.

There are 14 affordable homeownership units in Georgetown. They include eight affordable,
age-restricted units at Parker River Landing. Completed in 2010, the project was developed
under the Town’s ISH bylaw and includes two-bedroom townhomes. However, the units have
not been listed on the SHI due to having non-standard deed riders. There is one project at 34
East Main Street, that if permitted, would create two affordable homeownership units at 80% of
AMI.

Affordability Gap
Home sales prices have been fairly volatile in recent years. The median sales price of single-
family homes in Georgetown peaked at $405,000 in 2015, but dropped to $378,000 in 2016.
Single-family homes, though, have still been selling for more than $398,000 on average in 2016,
according to the Multiple Listings Service. There is therefore a substantial gap between the
sales price of an affordable home and the actual price of a home on the market in Georgetown.
For example, the gap between what is affordable to a low-income family of four earning 80% of
area median income (AMI) and the average sales price of a three-bedroom, single-family home
is roughly $200,000.

Market rents are also out of reach for low-income residents in Georgetown. The gap between
the level of rent a low-income, two-person household earning 80% of AMI can afford and the
actual rent of a two-bedroom apartment at Longview at Georgetown – a newer apartment
complex – is $749. It is important to note that Longview at Georgetown offers many amenities
in addition to being fairly new. Older apartments like Georgetown House, which was built
more than 50 years ago, have lower rents that are affordable to lower-income residents, but the
unit sizes are smaller, and there are no amenities.

Demand for Housing
Demand is directly related to housing supply. If there is not a supply of affordable housing
units, then we will not be able to find households at a lower income. Based on our demand
calculations, there is highest demand for multi-family units for households earning 50%-80% of
AMI. The most significant demand is for age-restricted units at the 50%-80% AMI level.
Therefore, we suggest an immediate need for multi-family rental housing and age restricted
housing at the 50%-80% income level.

We do not recommend homeownership products for households earning at or below 70% of
AMI as they are not able to absorb the costs required to maintain a property long term. There
may be a market for entry level homeownership units, and it is unclear if there is a zoning tool
today that would encourage this type of development. Homeownership units would have a set

11 | P a g e                                        LDS Consulting Group, LLC
purchase price at 70% of AMI but households earning up to 80% of AMI could purchase them.
The homeownership market for affordable age restricted housing is very small for a variety of
reasons, including the fact that there is an asset limitation so we do not recommend any
affordable age restricted homeownership units. In addition, as we have noted, there is a large
and growing elderly population, and there is a need for a product that provides a higher level
of care such as supported elderly housing or assisted living.

Tools and Funding
The Town of Georgetown has a wide range of tools and funding sources to create and preserve
affordable housing in the community. The Town, for example, passed zoning amendments in
May 2011 to allow mixed-use buildings and assisted living facilities in certain zoning districts.
There are other local bylaws that specifically require the inclusion of affordable housing.
Notably, the Town’s Inclusionary Housing Balance Bylaw requires any proposed residential
development with three or more units to designate at least 10% as affordable. As an alternative,
developers can contribute a payment in lieu of affordable units. This has been one of the ways
the Town – specifically the Affordable Housing Trust – has accumulated money to use for
affordable housing. The other major revenue source is the Community Preservation Act. To
date, the Community Preservation Act has raised $1.15 million for community housing projects
in Georgetown and a large amount of the funds have been spent on renovations to Trestle Way.
As of January 31, 2017, the Trust had accumulated over $400,000. This and other housing-
related funds can be used to further the Town’s goals of offering a greater variety of housing
choices to its residents.

Constraints
There are several constraints or limitations to development in Georgetown, including the lack of
a public sewer system and wastewater treatment plant. This wastewater infrastructure issue
has effectively prevented any potential development from occurring in the downtown area. In
addition, the lack of public transportation in town presents a barrier to lower-income residents
who may not be able to afford to buy and maintain a vehicle. This issue – the auto-dependency
of the community – points to the need for mixed-use development, particularly in the
downtown area. If housing were developed near jobs, shopping and other amenities, lower-
income residents would not necessarily need to have their own vehicle.

Other constraints include water capacity issues during peak usage times and limited
developable land due to wetlands. In addition, the Town lacks the staffing capacity to work on
affordable housing issues. While an Affordable Housing Trust has been created, it could benefit
from having a dedicated, part-time staff person.

Accomplishments
The Trust with the help of Town Meeting and other town departments has made many strides
towards accomplishing the goals identified in the 2011 Housing Production Plan, prepared by
LDS. These include sending two Trust members to MHP’s two-day affordable housing institute,

12 | P a g e                                        LDS Consulting Group, LLC
partnering with an outside firm to conduct lotteries for new affordable units, instituting a six-
month delay for demolition of historic structures, and examining the cost of buying down
affordable units not listed on the SHI. The Trust has also created a rental assistance program
which subsidized the rent for five renters in Georgetown in 2016. In 2016, the Trust also spent
$200,000 to purchase a home at 32 Lisa Lane and is currently renting it out. In addition, the
Trust is working with the owners of 34 East Main Street in support of a friendly 40B to create 8
small homeownership units, of which 2 would be affordable.

Affordable Housing Goals
The Town of Georgetown has taken significant steps to promote affordable housing and
housing diversity in the community. This is reflected by the Town’s commitment to
strategically direct its funds to support the creation and preservation of affordable housing.
Despite its efforts, however, the Town continues to face challenges in meeting all of the
community’s affordable housing needs. Based on the housing inventory, demand analysis and
other findings in this study, we have suggested that the Town work towards achieving six
affordable housing goals. These goals include preserving affordable, homeownership units for
low-income households; increasing affordable rental housing for very low-income and low-
income families; and increasing affordable rental housing for very low-income seniors. These
latter two goals reflect the fact that there is very little affordable, rental housing available in the
community. The Town should also strive to provide low-income seniors with housing options
that include supportive services; increase affordable homeownership opportunities for low-
income, first-time homebuyers; and increase housing and support opportunities for special
needs populations.

Because the percentage of affordable housing units in Georgetown has exceeded the minimum
requirement of 10% set by the state under M.G.L. Chapter 40B, the Town is considered a
“Certified Community” and can determine its own yearly production schedule. Even if no
additional SHI units were added, Georgetown would remain a Certified Community above 10%
through at least 2027, with a surplus of 35 SHI units.

Implementation Strategies
To meet the housing goals mentioned above, the Town can consider a variety of
implementation strategies. These strategies – 26 have been recommended – are based on the
local needs, existing resources, constraints and compliance issues discussed throughout this
Housing Production Plan. They have been grouped according to the type of strategy proposed:
Education and Capacity Building Strategies, Zoning and Planning Strategies, Housing
Inventory Preservation Strategies, and Housing Production Strategies. While some of the
strategies – like those aimed at capacity building – do not directly create affordable units, they
provide the support and environment needed to achieve housing goals.

We have suggested the following goals for consideration by the Trust. Each goal has been
described in detail in Section 12, which starts on page 67.

13 | P a g e                                            LDS Consulting Group, LLC
Education and Capacity Building Strategies
1. Secure professional assistance
2. Continue to educate and train Housing Trustees
3. Educate the public
4. Partner with providers of First Time Home Buyer classes
5. Partner with housing providers and agencies
6. Create a guide of financing options for homeowners/landlords
7. Examine energy efficiency/green building programs
8. Create a Fair Housing Needs Assessment and Action Plan
9. Publish an Annual Report

Zoning and Planning Strategies
1. Continue pursuing a 40R Smart Growth District and a broader mixed-use district downtown
2. Investigate wastewater treatment options
3. Amend the zoning bylaw to encourage multiple-family dwellings with affordable units
4. Amend the Inclusionary Housing Balance Bylaw
5. Create an accessory unit program
6. Consider a fee waiver or reduction program for affordable units

Housing Inventory Preservation Strategies
1. Ensure that all eligible affordable units are added to the SHI as soon as they become eligible.
2. Develop a system to monitor and enforce regulatory agreements and deed riders
3. Buy down existing affordable housing units with new deed riders and record confirmatory
deeds
4. Pursue CDBG funding to reinstate a housing rehabilitation program

Housing Production Strategies
1. Identify and make available Town owned land for affordable housing development
2. Identify vacant, abandoned or underutilized land for affordable or mixed-income housing
development using GIS
3. Continue Rental Subsidy program
4. Establish a down payment assistance program for first-time homebuyers
5. Explore a “buy down” program for first-time homebuyers
6. Continue to partner with private developers
7. Leverage existing funding sources

14 | P a g e                                          LDS Consulting Group, LLC
Section 3: Demographic Analysis
Community Description
Georgetown is a largely residential community in Essex County in northeastern Massachusetts.
Roughly 28 miles north of Boston, it is nestled between Boxford to the southwest, Groveland to
the northwest, Newbury to the northeast and Rowley to the southeast. The town of
approximately 8,500 people is roughly 13 square miles in size, with a population density of 653
people per square mile. The community is growing, as people continue to move to
Georgetown.

Georgetown was incorporated as a town in 1838 (Massachusetts Department of Housing and
Community Development). The shoemaking industry thrived in the town during the 19th
century, with other industries like clothing, soap and furniture manufacturing setting up shop
during the latter part of the century (Maina, 1999). Other industries included ice cutting and
newspaper publishing. While the community grew, however, several fires devastated the town
during the late 1800s and early 1900s.

Today, there are still industrial areas near Interstate 95, but much of the manufacturing
businesses have been replaced with residential uses. Georgetown has retained its small town
character, and it has a quaint downtown with an antiques center and a supermarket. Given its
location near Interstate 95 and Routes 97 and 133, the town is accessible to both employment
centers in Boston, Andover and other communities as well as recreational areas in New
Hampshire and Maine. This highway access has made Georgetown an attractive community to
working professionals.

Georgetown is a largely auto-dependent community, as public transportation is very limited.
The town is a member of the Merrimack Valley Regional Transit Authority (MVRTA), but it is
not served by the transit authority’s fixed-route bus service. Instead, there is Georgetown Ring
and Ride, which is a curb-to-curb transportation service that allows residents to commute
within Georgetown and to Amesbury, Haverhill, Lawrence, Methuen, North Andover and the
Rowley Commuter Rail Station (Merrimack Valley Regional Transportation Authority, 2017).
Available Monday through Saturday, the service also connects residents to the MVRTA fixed-
route bus system in Haverhill. Riders can either pay $2 in cash when boarding a MVRTA
vehicle or purchase a 10-Ride Ticket Book for $20. Reservations must be made at least 24 hours
in advance. The service is not restricted to seniors or disabled persons and instead, can be
accessed by anyone. Table 4 below offers a breakdown of MVRTA ridership, showing that the
overwhelming majority of trips originate and end in Georgetown as of 2011.
                                                 Table 4
                          MVRTA RIDERSHIP                  Number Percent
                          Total Trips                       2,247
                          # Persons who used MVRTA            41
                          # Trips originated in Georgetown 1,585   71%
                          # Trips originated elsewhere       662   29%
                          # Trips ended in Georgetown       1,546  69%
                          # Trips ended elsewhere            701   31%

15 | P a g e                                         LDS Consulting Group, LLC
There is also a Park and Ride lot – with 110 spaces – in Georgetown where residents can take advantage of fixed-route bus service to Boston provided by the Coach Company commuter bus (Massachusetts Department of Transportation, 2017). The commuter bus takes an average of seven to 10 people from Georgetown to Boston each weekday (Foucault, 2011). Other alternative transportation options include Flight Line, which offers bus service to Logan Airport and Manchester Airport (Flight Line, Inc., 2017). The Georgetown Council on Aging also provides transportation services for seniors and disabled residents, including weekly shopping trips and rides to medical appointments. The Town of Georgetown government includes a Board of Selectmen, Town Administrator and Open Town Meeting. It also has numerous boards and committees, including everything from an Energy Committee to a Recreational Path Committee. The local school system – Georgetown Public Schools – includes Georgetown Middle/High School and Penn Brook Elementary School, which relocated to a new, state-of the art facility at the beginning of the 2015 school year. The former Perley Elementary School is in the process of being converted into a preschool for the 2017-2018 school year and also serves as the new home of the Georgetown Senior Center (Georgetown Public Schools, 2017). Senior Services The Town of Georgetown Council on Aging (“COA”) provides a broad range of services to more than 700 seniors in the community, which accounted for approximately 40% of seniors in Georgetown in FY 2016. Programs and services include fitness classes, income tax preparation, community education programs, health insurance counseling, a monthly newsletter and a monthly men’s breakfast program among many others. Transportation is a major component of the COA’s services, as its van provided 269 weekly shopping trips and 211 weekly recreational outings in FY 2016. Six volunteer drivers further provided 11 seniors with 36 rides to medical appointments. However, the director of the COA noted that the number of Georgetown seniors seeking transportation services has declined in recent years. The COA also provides lunches three days per week in partnership with Elder Services of the Merrimack Valley, serving 959 meals through its congregate meal program in FY 16. The COA also offers housing referrals to local housing authorities, private housing developments and assisted living facilities. In FY 2016 the COA received 20 requests from seniors looking for housing, with the majority seeking information about the 126-unit Georgetown Housing Authority Trestle Way Senior Housing development (Ranshaw-Fiorello, 2017). The COA’s programs and activities are provided at a new senior center at the former Perley Elementary School at 51 North Street, which opened on February 27th, 2017. The senior center was funded with $350,000 of Community Preservation Act (“CPA”) funds. The new senior center consists of five 900-square-foot rooms in a wing of the Perley School, which was vacated with the opening of the Penn Brook Elementary School in September 2015. Two rooms are being used as offices and the remaining three rooms contain a reading/hobby room, workout/yoga room with two treadmills and other exercise equipment, and space for private consultations. The center also shares spaces such as the kitchen, cafeteria, gym and meeting rooms with the 16 | P a g e LDS Consulting Group, LLC
school. The new senior center has provided the opportunity for new programming including a
tai chi class, food pantry, fall prevention class, mural painting program, quilting group,
dementia/Alzheimer’s group, and TRIAD group – a partnership with the Georgetown fire and
police departments and Essex County sheriff department to educate the elderly on various
safety issues (Ranshaw-Fiorello, 2017).
Veterans Services
The Eastern Essex District, based in Ipswich, provides veterans services to the Town of
Georgetown. According to the Veterans’ Agent, veterans in Georgetown have not had
difficulty finding housing in Georgetown (Tyler, 2017). Some have moved into local
apartments, including Longview at Georgetown, while others have made their second home
purchase in the community. Therefore, there is not a need for veteran’s housing in
Georgetown.
Population Growth
Georgetown has seen continual and significant population growth since 1990, growing by over
28% between the 1990 and 2010 censuses. According to Esri, that population growth has
continued through 2016, reaching an estimated 8,531 people, and is projected to continue
growing through at least 2021 when it will exceed 8,900. While the five neighboring towns
shown in the chart below also grew rapidly in the 1990’s, none matched Georgetown’s growth
from 2000 to 2010, as shown in the map on the next page. Georgetown’s projected population
growth rate of 9.2% from 2010-2021 puts it in the middle of its neighbors, and ahead of the
growth rates for Essex County and Massachusetts as a whole (ESRI, 2016).
Table 5
POPULATION GROWTH
1990 2000 % Change 2010 % Change 2021 % Change
1990-2000 2000-2010 Projection 2010-2021
Georgetown 6,384 7,377 15.6% 8,183 10.9% 8,932 9.2%
Boxford 6,323 7,982 26.2% 7,965 -0.2% 8,107 1.8%
Groveland 5,233 6,056 15.7% 6,459 6.7% 6,680 3.4%
Newbury 5,624 6,718 19.5% 6,666 -0.8% 7,642 14.6%
Rowley 4,421 5,463 23.6% 5,856 7.2% 6,817 16.4%
Topsfield 5,806 6,313 8.7% 6,085 -3.6% 6,766 11.2%
Essex County 670,080 723,419 8.0% 743,159 2.7% 802,017 7.9%
Massachusetts 6,016,425 6,349,097 5.5% 6,547,629 3.1% 7,009,033 7.0%
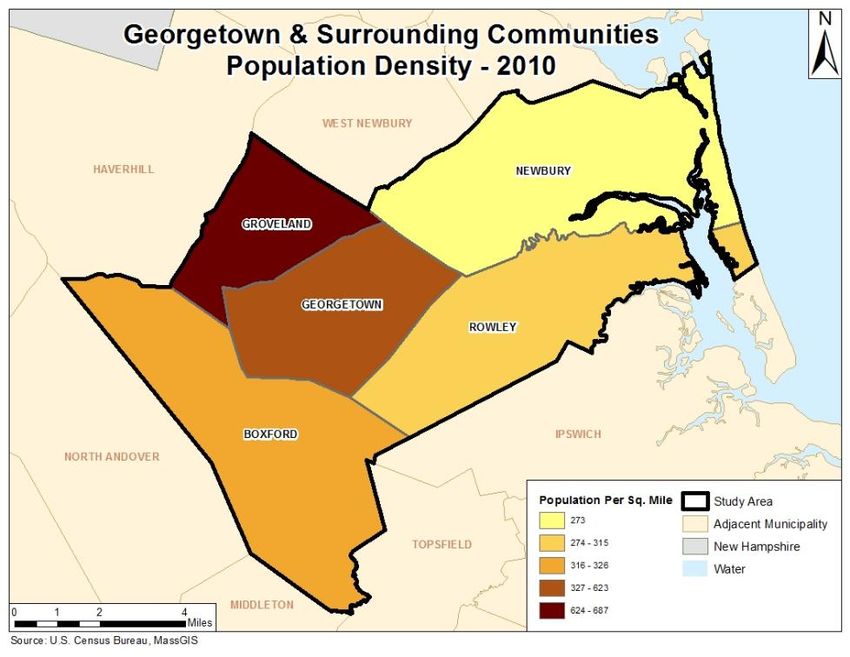
17 | P a g e LDS Consulting Group, LLCMap 2 Population Density With a 2010 population of 8,183 people and 13.14 square miles of land area, Georgetown had a 2010 population density of 622 people per square mile. The map below shows that Georgetown is denser than all of its neighbors, except for Groveland. This is not surprising given that Georgetown was the most populous community in the area in 2010 (US Census Bureau, 2010). 18 | P a g e LDS Consulting Group, LLC
Map 3

Age Distribution
Like many other towns in Massachusetts, Georgetown is experiencing a considerable increase in
its senior population. This trend is evidenced in the chart and table below, which show the three
oldest cohorts measured (ages 55-64, 65-74, and 75+) each roughly doubling in population
between 2000 and 2021 (ESRI, 2016). In that same time period, the total number of Georgetown
residents age 55 and over is expected to go from 1,307 to 3,033, or from 17.7% of the total
population to 34%. With seniors making up over one third of the total Georgetown population
by 2021, demand for senior services may increase, along with demand for accessible and/or
senior housing.

19 | P a g e                                         LDS Consulting Group, LLC
Figure 1

                                                Georgetown Population by Age, 2000-2021
                             2000
                             1800
                             1600
       Number of Residents

                             1400
                             1200
                             1000
                                                                                                       2000
                              800
                              600                                                                      2010
                              400                                                                      2021 (Projected)
                              200
                                0

However, unlike many other towns in Massachusetts that are currently seeing their largest
generation aging out of the workforce and a simultaneous decline in their younger population,
Georgetown’s age distribution is somewhat more balanced. Georgetown’s aging population is
mitigated by steady overall population growth, a stable number of school age children and
increasing numbers of younger adults ages 18 to 34. While the number of adults in the prime
working years of 35 to 54 are projected to decline somewhat between 2010 and 2021, the steady
inflow of younger families puts Georgetown on sounder footing in managing its aging
population.

                                                                    Table 6
                                                     AGE DISTRIBUTION IN GEORGETOWN
                                 Age Group                2000                   2010          2021 (Projected)
                                                   Number Percent Number Percent              Number Percent
                             Under 5                 625        8.5%        484        5.9%     455        5.1%
                             5 to 17                1,484      20.1%       1,859      22.7%    1,767      19.8%
                             18 to 24                399        5.4%        308        3.8%     406        4.5%
                             25 to 34                807       10.9%        687        8.4%     905       10.1%
                             35 to 44               1,520      20.6%       1,224      15.0%    1,067      11.9%
                             45 to 54               1,235      16.7%       1,572      19.2%    1,299      14.5%
                             55 to 64                622        8.4%       1,125      13.7%    1,415      15.8%
                             65 to 74                390        5.3%        555        6.8%    1,042      11.7%
                             75 and over             295        4.0%        369        4.5%     576        6.4%

                             All 55 and over        1,307     17.7%       2,049     25.0%      3,033          34.0%
                             Total Population       7,377                 8,183                8,932

20 | P a g e                                                                  LDS Consulting Group, LLC
Race
The population has remained predominantly White over the past decade, as shown in Table 7
below. Minority residents, however, are increasing slightly in number. In 2010, for example,
129 residents or 1.6% identified themselves as Black, American Indian, Alaska Native or Asian,
compared to no residents in 2000 (U.S. Census Bureau, 2000, 2010).
Table 7
RACE IN GEORGETOWN
2000 2010
Number Percent Number Percent
Total 7,377 100% 8,183 100%
White 7,253 98.30% 7,927 96.90%
Black or African American 0 0% 38 0.50%
American Indian and Alaska Native 0 0% 14 0.20%
Asian 0 0% 77 0.90%
Native Hawaiian and Other Pacific Islander 0 0% 0 0%
Some Other Race 84 1.10% 28 0.30%
Two or More Races 40 0.50% 99 1.20%
Household and Family Growth
A household includes all people who occupy a housing unit, which can be a house, apartment,
mobile home, group of homes or single room that is occupied as separate living quarters. The
number of households in Georgetown has grown steadily since 1990, as shown in the table
below. The town’s rate of growth has far outpaced that of Essex County and the
Commonwealth of Massachusetts, and since 2000 it has also outpaced all surrounding
communities (U.S. Census Bureau, 1990, 2000, 2010). Georgetown’s growth rate is expected to
slow to 9.4% between 2010 and 2021, but still remain above Essex County and Massachusetts
(ESRI, 2016).
Table 8
HOUSEHOLD GROWTH
1990 2000 % Change 2010 % Change 2021 % Change
1990-2000 2000 to 2010 Projection 2010-2021
Georgetown 2,178 2,556 17.4% 2,937 14.9% 3,213 9.4%
Boxford 2,036 2,590 27.2% 2,688 3.8% 2,743 2.0%
Groveland 1,777 2,066 16.3% 2,346 13.6% 2,430 3.6%
Newbury 2,059 2,511 22.0% 2,594 3.3% 2,983 15.0%
Rowley 1,496 1,945 30.0% 2,155 10.8% 2,509 16.4%
Topsfield 1,933 2,129 10.1% 2,090 -1.8% 2,331 11.5%
Essex County 251,285 275,419 9.6% 285,956 3.8% 307,725 7.6%
Massachusetts 2,247,109 2,443,580 8.7% 2,547,075 4.2% 2,711,166 6.4%
A family consists of a householder and one or more people living in the same household who is
related to the householder by birth, marriage or adoption. As shown in Table 9 below, the
growth rate of families in Georgetown tracks the growth in households fairly closely.
Georgetown experienced rapid growth of 16.2% in the 1990’s, a further 13.1% from 2000 to 2010,
and is projected for a somewhat slower but still robust 9.1% by 2021. In each of these periods,
21 | P a g e LDS Consulting Group, LLCYou can also read