The Face of Success Shannon N. Minehan and Dennis Wesselbaum June 7, 2021 - NZAE
←
→
Page content transcription
If your browser does not render page correctly, please read the page content below
The Face of Success∗
                      Shannon N. Minehan†and Dennis Wesselbaum‡
                                           June 7, 2021

                                              Abstract
         In this paper, we add to the literature on gender differences in labour market
      outcomes by studying the drivers of academic success. We extend the literature by
      incorporating otherwise unobserved personality traits. We compile a unique data set
      containing detailed information of all full-time faculty members of the Top 100 US
      Economic Departments (N=2,473). Data is taken from individual CVs and Google
      Scholar. We use the facial width-to-height ratio (fWHR) to proxy personality traits
      such as competitiveness, dominance, and risk-taking behaviour. Our results show that
      more dominant women are less successful (i.e. have a lower h-Index) compared to less
      dominant women, while more dominant men are more successful after controlling for
      various confounding variables. These findings emerge over the life-cycle of a researcher
      and survive various robustness checks.

             Keywords: Academic Performance, Gender, Labour Market Outcomes, Personal-

      ity.

             JEL classification: A14, D91, J16, J24.

   ∗
      We wish to thank Chris Barrett, Sandy Black, Juliane Hennecke, Sol Hsiang, and Andrea Menclova for
helpful comments and suggestions. We also thank participants at the Microeconomics Study Group Meeting
(online) for valuable feedback. All remaining errors are our own.
    †
      Motu Economic and Public Policy Research Email: shannon.n.minehan@gmail.com
    ‡
      Department of Economics, University of Otago, Dunedin 9016, New Zealand.             Email: den-
nis.wesselbaum@otago.ac.nz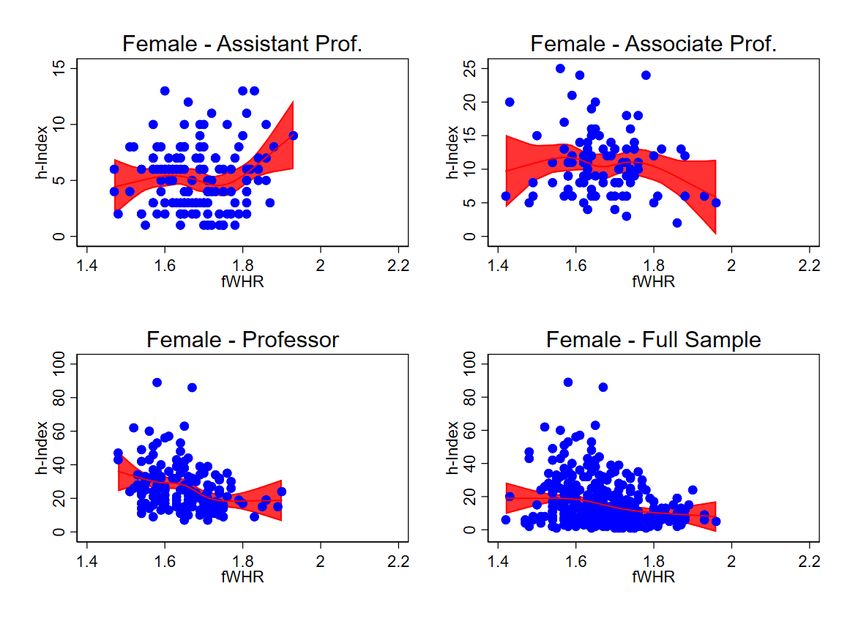
A thesis

submitted to the Department of Economics

           University of Otago

 In partial fulfilment of the requirements

  for the degree of Master in Economics

              February 2021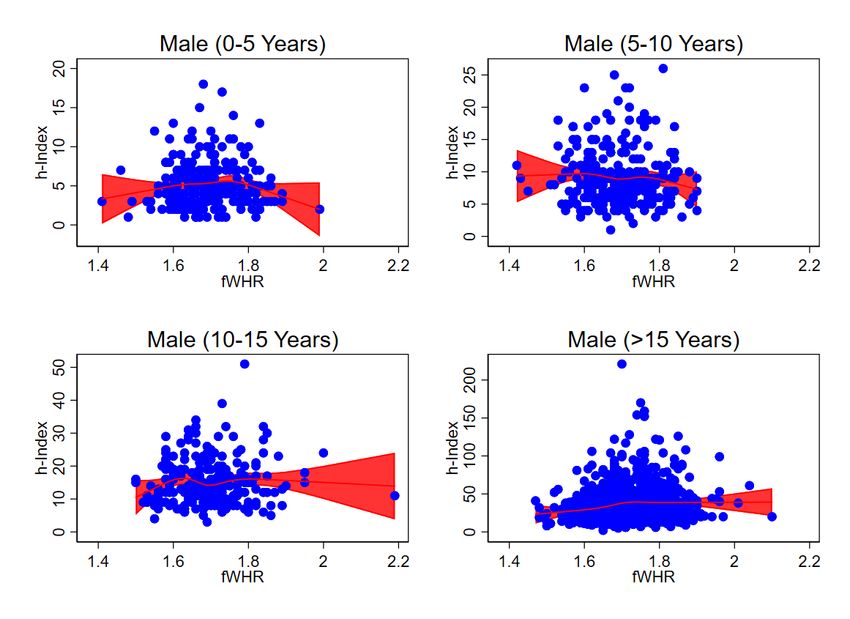
Contents

Table of Abbreviations                                                                           III

List of Figures                                                                                  IV

List of Tables                                                                                    V

Table of Symbols                                                                                 VI

1 Introduction                                                                                    1

2 Literature Review                                                                               5
   2.1   Measuring Academic Performance . . . . . . . . . . . . . . . . . . . . . . . .           5
   2.2   Drivers of Academic Performance . . . . . . . . . . . . . . . . . . . . . . . .          7
   2.3   Women in Economics . . . . . . . . . . . . . . . . . . . . . . . . . . . . . . .         9
   2.4   Network Formation . . . . . . . . . . . . . . . . . . . . . . . . . . . . . . . .       11
   2.5   fWHR in Biology . . . . . . . . . . . . . . . . . . . . . . . . . . . . . . . . .       13
   2.6   fWHR in Economics . . . . . . . . . . . . . . . . . . . . . . . . . . . . . . .         16
   2.7   Beauty . . . . . . . . . . . . . . . . . . . . . . . . . . . . . . . . . . . . . . .    18

3 A Model of Personality, Skills, and Outcomes                                                   19

4 Data and Econometric Strategy                                                                  25
   4.1   Data Set Construction . . . . . . . . . . . . . . . . . . . . . . . . . . . . . .       25
   4.2   Descriptive Statistics . . . . . . . . . . . . . . . . . . . . . . . . . . . . . . .    30
   4.3   Econometric Strategy . . . . . . . . . . . . . . . . . . . . . . . . . . . . . . .      39
         4.3.1   Main Strategy . . . . . . . . . . . . . . . . . . . . . . . . . . . . . . .     39
         4.3.2   First Differences . . . . . . . . . . . . . . . . . . . . . . . . . . . . . .   41
   4.4   Hypotheses . . . . . . . . . . . . . . . . . . . . . . . . . . . . . . . . . . . .      43

5 Estimation Results                                                                             45

                                                 I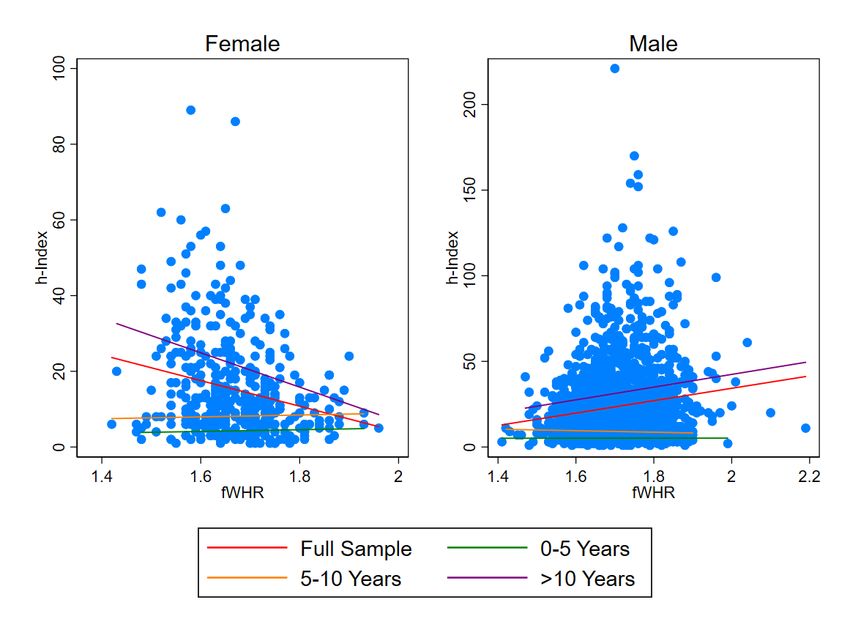
6 Robustness                                                                                    47
  6.1   Sample Selection Bias . . . . . . . . . . . . . . . . . . . . . . . . . . . . . . .     48
  6.2   Omitted Variable Bias . . . . . . . . . . . . . . . . . . . . . . . . . . . . . .       49
  6.3   Other Robustness Checks       . . . . . . . . . . . . . . . . . . . . . . . . . . . .   52

7 Conclusion                                                                                    57

A References                                                                                    60

B Tables and Figures                                                                            78

                                               II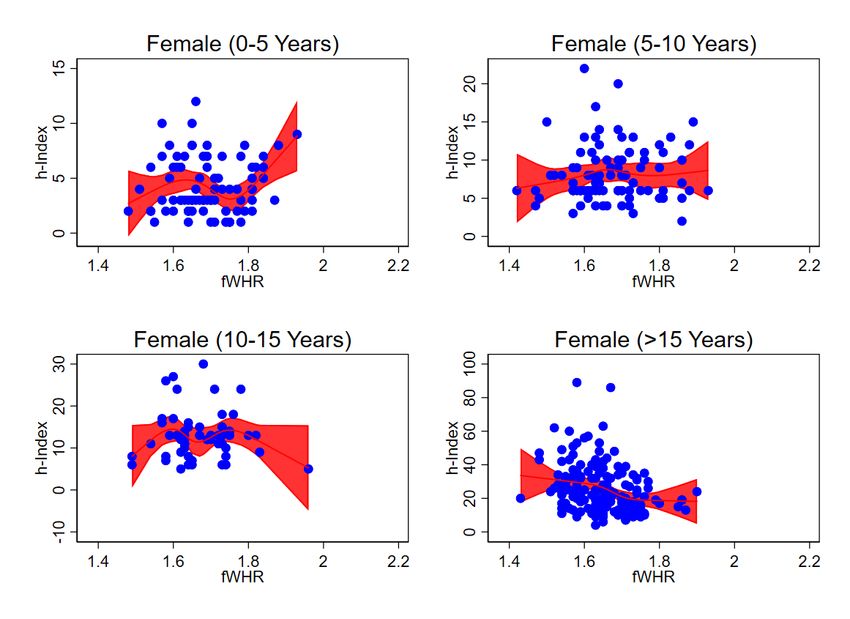
Table of Abbreviations

AEA         American Economic Association
EEA         European Economic Association
FD          First Differences
fWHR        Facial Width-to-Height Ratio
GRE         Graduate Record Examination
OLS         Ordinary Least Squares
RES         Royal Economic Society
RMSE        Root Mean Square Error
SFD         Spatial First Differences
SSRN        Social Science Research Network

                                   III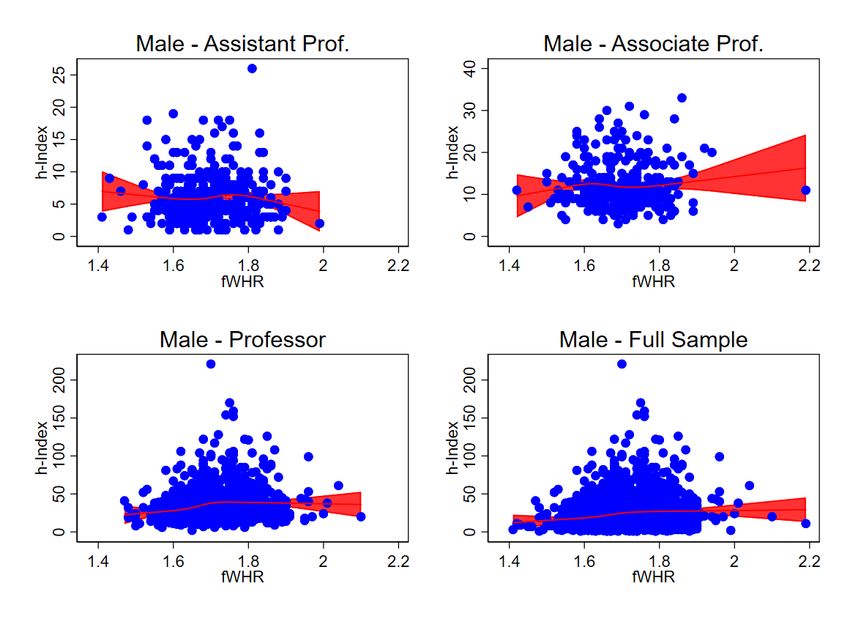
List of Figures

  1   fWHR Examples . . . . . . . . . . . . . . . . . . . . . . . . . . . . . . . . .      2
  2   Histogram of fWHR. . . . . . . . . . . . . . . . . . . . . . . . . . . . . . . .     38
  3   Scatter Plot by time since PhD. . . . . . . . . . . . . . . . . . . . . . . . . .    39
  4   Density Graph. . . . . . . . . . . . . . . . . . . . . . . . . . . . . . . . . . .   78
  5   Restricted Cubic Spline - Rank - Female. . . . . . . . . . . . . . . . . . . . .     78
  6   Restricted Cubic Spline - Rank - Male. . . . . . . . . . . . . . . . . . . . . .     79
  7   Restricted Cubic Spline - Time - Female. . . . . . . . . . . . . . . . . . . . .     79
  8   Restricted Cubic Spline - Time - Male. . . . . . . . . . . . . . . . . . . . . .     80
  9   Balance checks for total sample and matched sample. . . . . . . . . . . . . .        80

                                           IV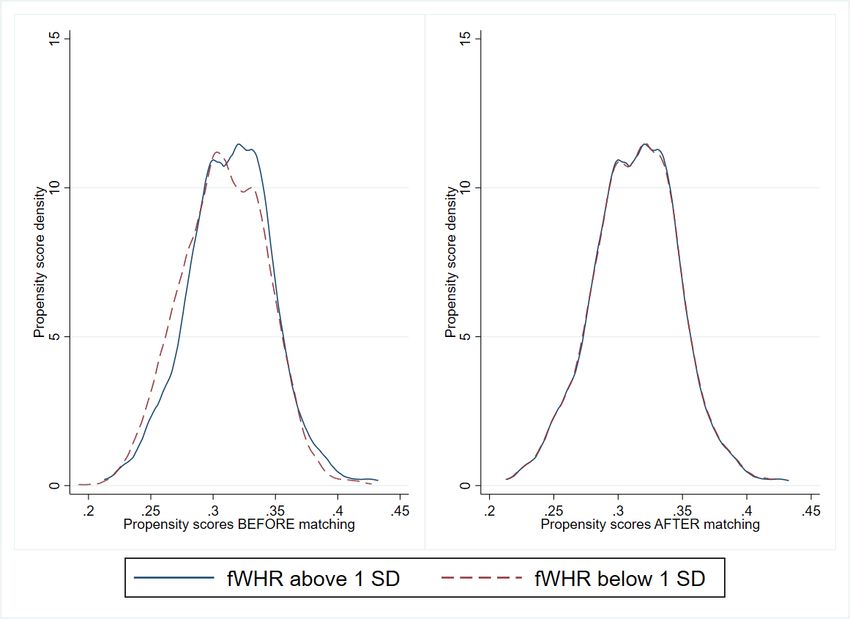
List of Tables

  1    Descriptive Statistics. . . . . . . . . . . . . . . . . . . . . . . . . . . . . . . .   33
  2    Descriptive Statistics - T-Tests by Gender. . . . . . . . . . . . . . . . . . . .       35
  3    Descriptive Statistics - Dominant Females. . . . . . . . . . . . . . . . . . . .        36
  4    Descriptive Statistics - Dominant Males. . . . . . . . . . . . . . . . . . . . .        37
  5    Main Results. . . . . . . . . . . . . . . . . . . . . . . . . . . . . . . . . . . .     46
  6    Robustness Checks. . . . . . . . . . . . . . . . . . . . . . . . . . . . . . . . .      50
  7    Additional Robustness Checks.       . . . . . . . . . . . . . . . . . . . . . . . . .   53
  8    Additional Robustness Checks - Different Dependent Variables. . . . . . . .             56
  9    Out-of-Sample Predictions. . . . . . . . . . . . . . . . . . . . . . . . . . . . .      57
  10   Population and Sample Coverage by University. . . . . . . . . . . . . . . . .           81
  11   Population and Sample Coverage by University (cont’d). . . . . . . . . . . .            82
  12   Population and Sample Coverage by University (cont’d). . . . . . . . . . . .            83
  13   Additional Summary Statistics. . . . . . . . . . . . . . . . . . . . . . . . . .        84
  14   Additional Summary Statistics. . . . . . . . . . . . . . . . . . . . . . . . . .        84
  15   Auxiliary Regression Results. . . . . . . . . . . . . . . . . . . . . . . . . . .       85

                                              V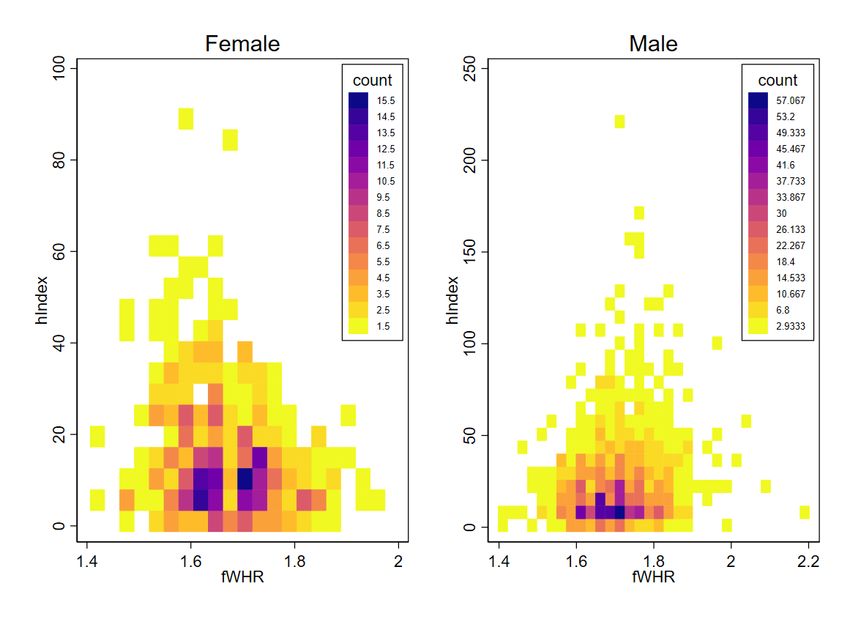
Table of Symbols

t           Time
d           Oster Test Coefficient
Φi,t        Vector of skills at any point in time
i           Index of gender
M           Male
F           Female
Φi,t        Cognitive skill vector
Pi          Stable component
I           Investment
C           Cognitive skills
N           Non-cognitive skills
j           Index of skills
 j
fi,t        Monotonically increasing function
Y           Outcomes
g           Monotonically increasing function
m           Specific outcome
e           Error term
l           Lag
n           Contemporaneous outcomes
R           Incentives
h           Function links inputs into the effort function to the task-level effort
E           Mathematical expectation operator
Θi          Set of preferences
i          Error term

                                     VI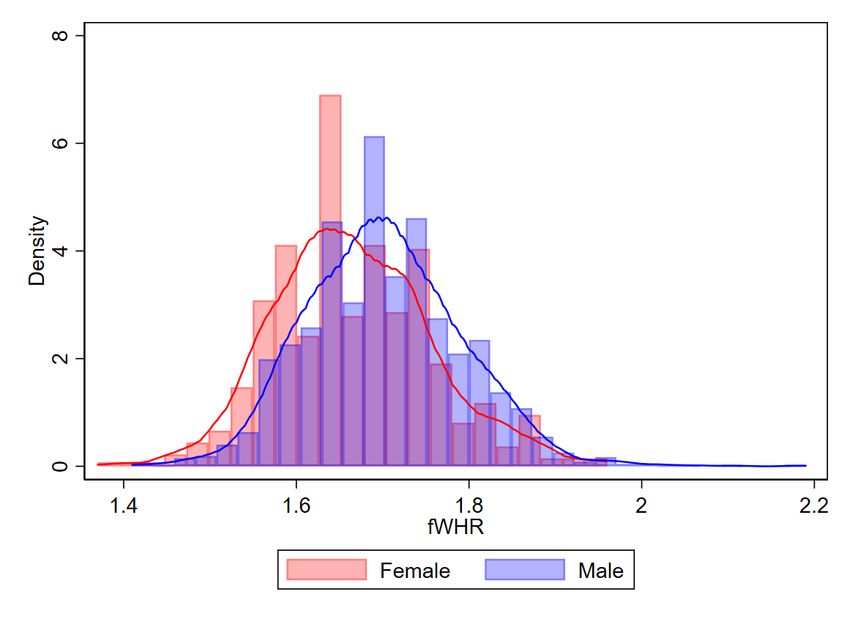
β    Constant
xi   K-dimensional matrix of control variables
c    M-dimensional vector of unobservables
∆    Difference operator

                           VII
1 Introduction
Persistent gender differences in labour market outcomes are a well-researched area in eco-
nomics. Papers such as Blau and Kahn, (2017); Cortes and Pan, (2017); Risse et al. (2018);
and Goldin et al. (2017) have highlighted a number of drivers of the divide, including but
not limited to factors such as education, experience, and social norms and beliefs (Akerlof
and Kranton, 2000). Despite these developments in knowledge and in the techniques used to
raise awareness of and minimise the observable differences however, the gender gap continues
to persist.
We speculate unobservable personality traits such as dominance may be contributing.1 In
particular, we postulate social norms surrounding desired gender-specific personality traits
may be a key driver of gender specific labour market outcomes. Thus this paper assesses the
impact of personality traits on performance across gender.
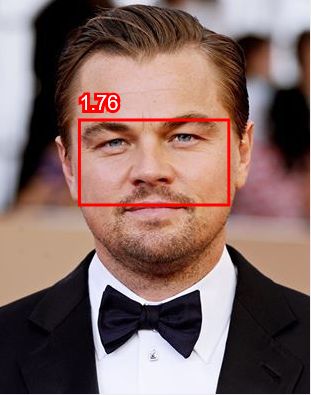
The facial width to height ratio (fWHR) is one physical feature which has been exten-
sively linked to various personality traits such as dominance, aggression, and masculinity.
Measuring the width between the ears and dividing it by the length between the eyebrows
and upper lips to give a resulting value (as demonstrated in Figure 1), the fWHR is an ideal
proxy for personality in that it can be used as a marker for certain heritable personality
traits2 such as competitiveness, risk taking behaviour, aggression, and dominance.3 This
is because the fWHR was once an evolutionary tool used to distinguish certain personality
traits among cavemen (Haselhuhn et al, 2013). In this paper, we too use the fWHR as a proxy
to measure personality traits. Individuals with values higher than the average are deemed
dominant whilst those below the average are classed as non-dominant. Consequently, when
assessing the images shown in Figure 1 below, we would class both Leonardo DiCaprio and
1
Croson and Gneezy, (2009); and Bertrand, (2011) research similar hypotheses.
2
See Eckel and Petrie, (2011).
3
See Carre and McCormick, (2009); Carre et al. (2010); Niederle, (2017); Schweiser and Karami, (2018);
Lefevre et al. (2014); Haselhuhn et al. (2015); Craig et al. (2019); Niederle and Vesterlund, (2007); Niederle
and Vesterlund, (2011); and Valentine et al. (2014).
1Figure 1: fWHR Examples
(a) Leonardo DiCaprio
(b) Claudia Schiffer
Claudia Schiffer as non-dominant individuals. Accordingly, by using the fWHR as a proxy
for personality, we can assess the impact of personality traits on labour market outcomes.
In terms of the labour market outcomes we investigate, we have restricted our sample
to academia. Primarily, we have analysed fWHR and academic success in the Economics
industry, looking at faculty members in the top 100 US Economic departments. Academic
performance is primarily measured through the h-Index, and a number of controls have also
been incorporated into the model, including but not limited to variables such as ethnicity
and time since PhD (a proxy for age).
The starting point for our analysis is a conceptual framework that links personality to
skills and outcomes. To develop this model, we combine the model of cognitive and non-
cognitive skill formation (Cunha and Heckman, 2007; and Cunha et al. 2010) with the field
of heritability (Turkheimer, 2000; Power and Pluess, 2015; and Roysamb et al. 2018) and
2stability of personality (Ferguson, 2010; Cobb-Clark and Schurer, 2012; and Harris et al.
2016).
From this model, we derive two key testable hypotheses: more dominant women are less
successful compared to non-dominant women, and the opposite relationship for men. We
offer two main reasons for this: firstly, dominant men build larger networks while dominant
women build smaller networks (McDowell et al. 2007; Ductor et al. 2018; and Lindenlaub
and Prummer, 2020), and secondly, dominant women may be discriminated against (Burgess
and Borgida, 1999; Maass et al. 2003; Parkins et al. 2006; and Berdahl, 2007) which could
limit non-cognitive skill formation and, hence, lead to worse outcomes.
To test these hypotheses, we build a unique and novel data set of all faculty members
of the Top 100 US University Economic departments. Data is taken from individual CVs,
Google Scholar, and from the web-page picture (for the computation of the fWHR). Our
sample covers 87 percent of the faculty members (N = 2,473) and splits into 1,941 males and
532 females.
Our key findings can be summarised as follows. Men with higher fWHRs, ergo more dom-
inant, are more successful with higher h-Indexes. Conversely, women with higher fWHRs,
ergo more dominant, are less successful (lower h-Indexes). Furthermore, this pattern appears
to emerge over the academic life-cycle, becoming stronger as both men and women move up
the academic ranks from assistant to associate to full professor.
We have highlighted a number of channels with which we speculate this may be the case.
The first of these is a direct channel pertaining to personality. Personality traits such as risk
taking, competitiveness, dominance, and achievement drive have all been associated with
success. For males, these qualities are viewed as desirable. Therefore, we would speculate
3having a higher fWHR which implies an abundance of these qualities would in fact benefit a
man for the aforementioned reasons. On the contrary, for females, these traits defy gender
norms which favour compassion, nurturing, and empathy.4 Non-conformity is often discrim-
inated against, which may be a determining factor for our results.
We also highlight two indirect channels. The first of these is networking. Our results
suggest that collaborating with three other academics will increase an individual’s h-Index
by 1 for both females and males. Our data shows dominant males network quite frequently,
whilst dominant females do not. We speculate this may be the case for various reasons.
Firstly, dominant women may feel less need to have co-authors out of personal preference.
This is in line with McDowell et al. (2007); Ductor et al. (2018); and Lindenlaub and Prum-
mer, (2020) who deduce that dominant women prefer to work alone or in smaller networks.
Secondly, dominant women are discriminated against, and therefore unable to find willing
collaborators. Discrimination has also previously been highlighted as a channel for the per-
sistent gender differences by Burgess and Borgida, (1999); Maass et al. (2003); Parkins et al.
(2006); and Berdahl, (2007), corroborating this driving channel. Nonetheless, the decreased
networking of dominant women may explain their lower h-Indexes compared to dominant
men and non-dominant women.
The paper is structured as follows. Firstly, we discuss existing literature pertaining to
measures and drivers of academic success, women in economics, network formation, fWHR
in biology and economics, and beauty. Secondly, we outline our model of personality, skills,
and outcomes, and thirdly our data and econometric strategy. Next we analyse our main
findings, and finally we conduct a number of robustness checks relating to potential sample
selection bias, omitted variable bias, and other various robustness checks. Supplementary
tables and figures can be found in the appendix.
4
See Tinsley et al. (2009); Mueller et al. (2006); and Costrich et al. (1975).
42 Literature Review
2.1 Measuring Academic Performance
Measuring academic performance is necessary to inform decisions on hiring, promotion,
tenure, grants, and awards. In addition, academic performance is the key outcome variable
in this paper. We focus primarily on the h-Index (Hirsch, 2005) as a measure of perfor-
mance.5 The h-Index has been widely accepted and used in various fields (Haley, 2017;
Geraci et al. 2015; and Delgadillo, 2016) including economics (Ellison, 2013), reflecting the
number of papers, H, which have been cited H number of times.6
By design, the h-Index gives a single number that balances productivity and impact of
a researcher in their field. This is preferable as using a simple publication count could be
misleading. On one hand, a researcher could publish many papers which are not cited often
or, on the other hand, a researcher could have few papers which are cited often, both of which
would be ranked higher than they necessarily ought to be. In addition, the interpretation of
the h-Index varies when comparing younger or senior researchers. For younger researchers,
the h-Index informs whether the researcher has published papers which have had impact on
the field. For senior researchers, the index will ignore papers without a substantial number
of citations and only focuses on the number of papers that have had a large effect on the field.
Hilmer et al. (2011) determine the h-Index to be a strong predictor of salary and place of
employment. Analysing the income and positions of 1,009 faculty members as well as their
5
Other supplemental methods such as the use of citations and the i10-Index were assessed in section 6.
6
For example, an h-index of 23 suggests that the researcher has 23 papers all of which have been cited
at least 23 times. To move up a rank, the researcher must possess a 24th paper with 24 citations and all
remaining 23 papers must obtain one additional citation each.
5publications and citations, they determined the variables to be highly correlated. Research
influence, as measured using the h-Index, was found to be an accurate predictor of salary
and place of employment in academia, explaining 50 percent of the variation observed in log
salaries.
Other papers, however, highlighted potential flaws in the h-Index as a measure of aca-
demic performance (see, for example, Ellison, 2013; Geraci et al. 2015; Symonds et al. 2006).
Since the h-Index depends on time, it favours senior researchers, as younger researchers (es-
pecially in economics) have not had the time to publish 50 papers that have been cited 50
times each (Conley and Önder, 2014). It also favours researchers publishing in fields which
have higher citations frequencies (Moed, 2009). Furthermore, the h-Index does not take into
account whether the researcher is a single author or is part of a co-author team (Geraci et
al. 2015), valuing both at the same rate.
Additionally, recent literature has stressed potential biases related to gender found in
use of the h-Index (Geraci et al. 2015; Symonds et al. 2006). Holliday et al. (2014) study
male and female academic performance across 82 radiation oncology departments in the US.
They find that fewer women achieve senior ranks, but those who do have similar produc-
tivity compared to their male counterparts. Geraci et al. (2015) use a sample of 70 male
and 70 female randomly selected professors from the Top 100 US Psychology departments.
Similarly, they find a significant gender differences in the h-Index and salaries even after
controlling for age. Symonds et al. (2006) too assess gender performance differences among
a sample of 168 (39 female, 129 male) researchers at British and Australian Life Science
University departments. They also find the h-Index to be biased against female researchers.
In response, they propose a modified index measure to account for this so-called gender bias
labelled research status. This variable is calculated as the residual obtained from regressing
the h-Index on the number of publications. When computing the research status for their
6sample, Symonds et al. (2006) found no gender differences in performance.
2.2 Drivers of Academic Performance
The previous section reviews the literature on our preferred measure of academic perfor-
mance. In this section, we want to review the literature discussing the driving forces of
performance. We abstract from the effect of gender on academic performance in this section,
as it is the focus of section 2.3.
The most obvious driver of academic performance (e.g. tenure or promotions) is pub-
lishing peer-reviewed articles that attract citations (which increase the h-Index). However,
over time the publishing process has changed dramatically. Card and DellaVigna, (2013)
analyse the level of annual submissions in economics to the Top 5 economic journals7 , and
find that these nearly doubled between 1990 and 2012. This suggests either an increase in
desirability to publish in these journals, as suggested by Heckman and Moktan, (2018), or an
increase in industry knowledge. They also find that the number of articles published in these
journals declined from 400 per year to 300 per year. This in turn drops the acceptance rate
from 15 to 6 percent. They argue that this trend is driven, at least partially, by an increase
in article length (on average articles are three times longer now), implying, ceteris paribus,
that young authors are now less likely to be published, lowering their academic performance.
However, averaging about 200 citations each, a publication in a Top 5 Journal is important
in increasing one’s h-Index.
Hamermesh’s (2013) conclusions support these findings and also highlight that the fraction
of older authors has increased (by a factor of four). He also documents a trend towards pub-
lishing papers which collect data (in the lab or the field) and away from theoretical papers
and papers using readily available data.
7
These are the American Economic Review, Econometrica, the Journal of Political Economy, the Quar-
terly Journal of Economics, and the Review of Economic Studies.
7Ellison, (2002) studies delays in the publication process and tries to understand the causes
of these delays. He shows that the submit-accept time at most top journals has increased by
12-18 months over the last 30 years. The reasons for this finding are threefold. First, paper
length has increased and longer papers require greater review times. Second, the number of
authors per paper has increased and these papers tend to have longer review times. Third,
as discussed above, space in top journals became sparser. Along this line, Conley et al.
(2011) document that productivity has decreased. Using a sample of 14,271 PhD graduates
between 1986 and 2000 in US and Canadian economic departments, they found delays were
linked to diminished productivity (measured by the number of AER equivalent publications).
Several other drivers of performance are documented in the literature. Einav and Yariv,
(2006) link the effect of surname initials on professional outcomes in economics. They find
earlier surname initialled scholars were more likely to receive tenure at top economic depart-
ments. These individuals were also more likely to receive awards such as the Nobel prize.
They suggest that this is because economics papers typically order co-authors alphabetically.
When the model was applied to psychology where co-authors are not alphabetised, there was
no effect observed from surname initial on success.
Collins, (2000) also documents racial differences in economic PhDs and the membership
of the AEA. She finds that minority individuals are more likely to exit and are more likely to
not obtain a PhD compared to non-minority individuals. Similarly, Bayer and Rouse, (2016)
document these differences and argue that the absence of diversity constrains the range of
topics researched. They suggest that implicit attitudes and institutional practices are the
primary catalysts of this problem.
Further, the importance of being linked to an editor of a journal is shown in Brogaard et
8al. (2014). Using data from 50,000 articles published in 30 economics and finance journals,
they find that the editor’s colleagues from the same University publish 100 percent more
papers in the editor’s journal compared to times when the editor was not in office.
Finally, the impact of attending conferences is documented in Gorodnichenko et al.
(2019). Using more than 4,000 papers presented at three leading conferences (AEA, EEA,
and RES) between 2006 and 2012, they show that presenting at these conferences increases
the probability of the paper being published in a high-quality journal. In addition, atten-
dance also increases citations and abstract views of the paper. The last two drivers (editor-
ship and conference attendance) point toward an important channel: networks. Section 2.4
will focus exclusively on the effects of networks on academic performance.
2.3 Women in Economics
The average American woman’s socio-economic outcomes have changed dramatically over
the past fifty years (Blau and Kahn, 2017; Goldin and Mitchell, 2017; and Lundberg 2020).
However, significant differences persist along various dimensions, including the labour market
(Goldin et al. 2017; and Charles et al. 2018). Gender differences also exist in economics and
have been documented as early as 1974 in a paper by Gordon et al. (1974), who showed that
women earned about 11 percent less than corresponding men at an undisclosed University.
Kahn, (1995) documents similarities between men and women when it comes to un-
dergraduate grades, admission rates to PhD programs, first job offers, and publication rates
when controlling for rank of the PhD granting University or the current employer (see Hilmer
and Hilmer, 2007 for contradicting results). Gender differences are found for GRE scores,
application rates for PhD programs, drop-out rates from the PhD, salaries (see also Ginther,
2003; and Blackaby et al. 2005), and promotions. Along this line, Ginther, (2002) shows
9that women are under-represented in the upper ranks and are less likely to receive tenure.
This was corroborated by Buckles, (2019) who finds that less than one third of economics
majors are women and the proportion of women in economics decreases as they move towards
tenure. Despite progress being made, Lundberg and Stearns, (2019) find that the proportion
of women entering the economics market has stalled relative to other disciplines. They also
document that the fields men and women conduct their PhD thesis in to be relatively stable
over time. Further, they argue that women are held to higher standards than men.
Reasons for these findings are manifold. Boustan, (2019), for example, argues that early
career success of women varies across PhD programs. The drivers are number of women in
the department, advisor-student contact, and collegial research seminars. Card et al. (2020)
show that male referees do not show a bias against female-authored papers and, therefore,
rule out a gender bias in the publishing process (see also Abrevaya and Hamermesh, 2012;
Hengel, 2017; Hengel, 2019; and Astegiano et al. 2019). In Babcock et al. (2017), exper-
imental evidence is provided showing that women, in contrast to men, are more likely to
volunteer for service positions, are more likely to be asked to volunteer for these positions,
and are more likely to accept these requests. Since these service jobs crowd-out research time,
they reduce the likelihood of promotion. Hilmer and Hilmer, (2010) document differences in
the job mobility of men and women by tracking graduating PhD students in the US. While
women tend to move downward, men move horizontally or upward. Further, Blackaby et al.
(2005) show that men receive more outside offers than women and document perceptions by
women to be discriminated against using a survey of UK economists. Leslie et al. (2015)
postulate that expectations of brilliance explain the gender gaps in academia, as do Ginther
and Kahn, (2015). Operating on the belief that to succeed, you must have an innate raw
gift with the subject, cultural and gender beliefs discourage women who are stereotyped to
not possess such ”brilliance” (as they put it). This decreases female labour force participa-
tion. Maths-intensive courses are a prime example of this, with women receiving less PhD
10qualifications in these areas.
2.4 Network Formation
In the previous sections, we have ignored the importance of networks for performance. How-
ever, networks are vital for the exchange of information and the positive spill-over effects
they create (See Adams, 2013; Bosquet and Combes, 2017; Borjas and Doran, 2015; and
Bailey et al. 2018). Collaborating with others allows specialisation, insures against risks,
and increases the number and size of projects.
Card and DellaVigna, (2013) document that the number of co-authors has increased from
1.3 in 1970 to 2.3 in 2012. Azoulay et al. (2010) use the death of a superstar economist as a
source of exogenous variation in the co-authorship network. They find that after the death
of the superstar, collaborators face a 5-8 percent drop in quality-adjusted publication rates.
Along this line, Wuchty et al. (2007) show that teams have changed the way knowledge is
generated. Using data on 19.9 million papers and 2.1 million patents from the last 50 years
to show that teams dominate single-authored papers, they find networking produces papers
which are cited more often and have higher impact. Similarly, Freeman and Huang, (2015)
show that increased diversity in teams leads to publications in higher ranked journals and
receives more citations. They argue that diversity increases the quality of the paper or the
number of people the paper reaches (or both) via accessing different networks. Besides the
effect on research impact, Combes et al. (2008) show that networks increase the probability
of being hired. Using data from the centralized hiring process for economics professors in
France, they show that not being linked to the jury requires a much better publication record
as compensation.
In general, networks exhibit homophily, i.e. they are homogeneous according to charac-
11teristics such as behaviour, socio-demographic and intra-personal factors (McPherson et al.
2001; Lewis et al. 2012; and Krause et al. 2010). The most important factors pinning down
the network are race and ethnicity, followed by other factors such as age, education, and
gender (McPherson et al. 2001; Mayer and Puller, 2008; Apfelbaum et al. 2014; Freeman
and Huang, 2014; Currarini et al. 2009; and Kerr, 2008). Fafchamps et al. (2010) study
co-author relationships in economics over 20 years. They show that the likelihood of collab-
orating increases if the researchers are closer in an existing network. Mairesse and Turner,
(2005) investigate factors that affect the collaboration of authors such as proximity of labo-
ratories, productivity, and publications, finding collaborations within a single laboratory are
40 times higher than collaborations between laboratories in the same town and 100 times
higher than collaborations between laboratories in different towns.
Gender differences in network formation of economists were first documented by Ferber
and Teiman, (1980); and McDowell and Smith, (1992). They find that economists tend to
co-author with colleagues of the same sex. For women, this contributes to a lower number of
publications and, consequently, to a lower probability of being promoted compared to men.
McDowell et al. (2006) use data from the AEA directories for six time observations from
1964 to 1997. They find that women in the top departments are less likely to co-author.
However, when they only consider top journals, they find that women are more likely to
co-author. They argue that networks affect the joint decision to co-author and publish. A
similar result was obtained by Boschini and Sjögren, (2007), showing that women are more
likely to single-author than men. Ductor et al. (2018) also find that women in economics
have less co-authors compared with men and they collaborate more often with the same
co-authors. Further, they co-author with more senior colleagues. Networks of men and
women exhibit homophily. Along this line, Lindenlaub and Prummer, (2020) find that while
men have more co-authors (larger networks), women have denser networks. Finally, Agarwal
et al. (2016) find in terms of gender, networking with males can help females succeed further.
122.5 fWHR in Biology
The fWHR has been extensively researched in the field of biology and has been linked to
various personality traits in humans and animals (See Kachur et al. 2020; and Wilson et al.
2014). This section gives an overview of this literature and key findings.
Bruce et al. (2012) determined that evolution aided in developing recognisable facial
cues. These changed in ability to be perceived as the face became more familiar, and could
be used to determine criminals and recognition of difficult situations. Similarly McGugin et
al. (2013) deduced that facial recognition operated in the same manner as object recognition.
Altschul et al. (2019) study the link between fWHR and dominance in rhesus macaques
(Macaca Mulatta). Specifically, they survey sex, age, facial morphology, dominance status,
and personality of 109 monkeys from the California National Primate Research Centre. They
find higher dominance levels among the primates with higher fWHRs. Additionally, lower
fWHRs are correlated with higher confidence levels. They conclude that fWHR may be in-
dicative of aggressive traits and assertiveness. In humans, fWHR has also been recognised as
a marker of behavioural traits. Geniole et al. (2015) assess the impacts of fWHR on biology
in a sample of 10,853 subjects. They find that on average males have higher fWHR than
females. They also document that having a higher fWHR predicts threatening behaviour
in men (N = 4,603), and a marker for dominance in both genders (N = 948). Hehman et
al. (2015) investigate the overall effect of higher fWHRs on individuals by investigating how
fWHR influences group membership selection decisions. Using competition as a proxy for
conflict whereby there is a higher desire for dominance and aggression, they find with a sam-
ple size of 101 individuals, that higher fWHRs are more likely to be chosen for competitions
as it is perceived as a marker of traits advantageous to competition. In contrast, Wang et
al. (2019) investigate the relationship between fWHR and antisocial tendencies in a sample
13of 1,305 people but find only little evidence supporting this relationship.
Zilioli et al. (2015) study fWHR as a signal of increased physical prowess. They determine
that fWHR is a facial cue that could be read and interpreted. Their first study, with a
sample size of 241, finds that fWHR co-varies with actual physical formidability, while their
second study, using 48 UFC fighters, finds fWHR to be a marker of formidability. These
findings are corroborated by Sell et al. (2008). Along this line, Lefevre et al. (2014) relate
the fWHR to alpha status. Employing a model and a sample size of 103 subjects (49 fe-
male), they assess fWHR with respect to masculinity. They find that fWHR can be linked
to aggression (physical and verbal), self-reported dominance, and anger though not hostility.
Further, there appears to be no difference pertaining to gender. Hence, they conclude that
fWHR can be a cue for dominance and aggression in males and females. Haselhuhn et al.
(2013) investigate the channels through which fWHR works. They determine that fWHR is
linked to dominance via a self-fulfilling prophesy. Higher fWHRs developed evolutionarily
as a signal and marker of dominance. This marker persists in the modern world however,
causing individuals to react to higher fWHR individuals as if they will be dominant which in
turn entices them to act dominantly. Zebrowitz et al. (1998) too found a similar channel, as-
sessing the hypothesis that baby-faced boys compensate for their less dominant expectations
by behaving in a childlike manner. They determined baby-faced individuals were typically
smarter than mature-faced peers disproving claims of intellectual weakness. Furthermore,
these individuals were found to be more likely to be delinquents, contrasting pre-conceived
notions that baby-facedness is correlated with warmth, weakness, and submissiveness.
Carrying on in terms of self-perception, Watkins et al. (2010) determined a negative re-
lationship existed between men’s own perceived dominance and their perception of other
men’s dominance. They concluded this suggests less dominant men may be more perceptive
of cues of dominance compared to more dominant men. Mileva et al. (2014) however found
a positive association between perceptions of others’ dominance and their fWHRs in men as
well as self-perceived dominance and fWHR.
14fWHR has also been found to vary across gender. The average American male’s fWHR
stands at 1.83 whilst the average American female’s at 1.73. Carre and McCormick, (2008)
investigate sexual dimorphism with respect to fWHRs, specifically regarding judgements per-
taining to gender, emotion, and personality. Assessing variations among males and females,
males and varsity hockey players, and males and professional hockey players with sample
sizes of 88, 21, and 112 respectively, they find that men typically possess higher fWHRs
compared to women. They also find that men possess higher dominance scores and greater
reactive aggression. Thus higher fWHRs are positively related to aggressive behaviour, par-
ticularly in men.
fWHR has also been determined to vary among ethnicities. Fang et al. (2011) found
different races possessed variability in facial dimensions. The most notable of these was the
height of the forehead, though measurements of the mouth, eyes, and nose were significant
also. No statistically significant difference pertaining to gender was observed.
Zhang et al. (2018) survey total, dyadic, and solitary sexual desire in a sample of 754
women. They find no link, suggesting fWHR is not related to women’s sexual desires. They
also find no evidence linking a woman’s face shape sexual dimorphism to their socio-sexual
orientation. Kramer, (2017) also found no evidence to suggest fWHR was a sexually dimor-
phic measure in skulls or faces.
Valentine et al. (2014) study the effect of fWHR on attractiveness to the opposite gen-
der. Assessing the effect of male attractiveness to females specifically through speed dating,
their sample included 78 men and 81 women. In contrast to Zhang et al. (2018), they find
a positive correlation between perceived dominance and attractiveness as well as the likeli-
hood of a follow-up date. This relationship persists in the short-term, but not long-term,
and suggests higher personal perceived dominance, i.e. higher fWHR, is positively linked to
mating desirability.
15Finally, research has shown that exposure to testosterone has effects on females. Bütikofer
et al. (2019) find that in utero exposure of female twins to testosterone reduces the proba-
bility of graduating from high school, completing college, and lowers life-cycle earnings. It
needs to be stressed that fWHR and testosterone are not related. Many personality traits
correlated with higher fWHRs among men have been speculated to be influenced by puber-
tal testosterone which contributes to facial structure as well as dominance and is higher in
men than women. Furthermore, Bird et al. (2016) examine the relationship between fWHR,
baseline testosterone, and competition-induced testosterone using a sample size of 780 men.
They find no statistically significant relationship between any of the investigated variables.
2.6 fWHR in Economics
The fWHR - as a proxy variable for personality - has received recent attention in economics
and finance. As the fWHR proxies for characteristics such as dominance, risk preferences,
and competitiveness, we expect to see an effect of fWHR in certain fields.
He et al. (2019) link fWHR to achievement drive among 1,744 Chinese male finan-
cial analysts. They find analysts with higher fWHRs are more likely to exhibit improved
performance. This relationship is more prominent among lower-status analysts compared to
high-status analysts, as well as in firms with greater levels of uncertainty and in analysts with
greater instances of competition. Similarly, Schweiser and Karami, (2018) assess the effect of
fWHR among hedge fund managers. They focus on their risk-taking tendencies in a sample
of 7,549 individuals, finding a positive correlation with fWHR and risk-taking behaviour.
Further, Lu and Teo, (2018) link the impact of fWHR on hedge fund manager performance.
In particular, they find hedge fund managers with lower fWHR outperform those with higher
fWHR. They argue this may be because higher fWHR managers are more likely to termi-
16nate their funds, disclose violations, and perform with greater operational risk. High fWHR
individuals in the sample are also more reluctant to sell under-performing stocks, suggesting
personality traits associated with higher fWHR are not beneficial in this field. Kausel et al.
(2018) suspect that whilst the aforementioned factors impact academic success, personality
traits are an additional contributing factor. They find a link between fWHR and academic
success through the channel of assertiveness. Using a sample of 231 students, they determine
that fWHR accurately predicts academic performance in non-quantitative courses. It does
not, however, predict it in either basic nor applied quantitative courses. Finally, Hahn et
al. (2017) assess the effect of fWHR in companies. They find in a number of organisations,
both profit and non-profit, fWHR increased positively with rank in the organisation. Higher
fWHRs are also positively correlated with company’s donations to charitable causes and en-
vironmental awareness campaigns. This suggests fWHR is linked to leadership capabilities
and social rank, potentially through the mechanisms of dominance and aggression which
could aid in success. Lin et al. (2018) also links fWHR to political corruption. In a sample
of 325, they show images of unfamiliar politicians to the subjects and ask for behavioural
perceptions. On average, those accused of corruption in real life are perceived in the study
as more corrupt, aggressive, and dishonest. These individuals, however, are also discerned
to be more masculine, competent, and ambitious. Additionally, when the facial structure of
these individuals was adjusted, the corruptible perceptions change. This suggests perceived
social behaviour is impacted by fWHR.
Haselhuhn et al. (2014) also related fWHR to negotiation performance in men. They
found that more dominant men, those with higher fWHRs, were less cooperative negotiators
meaning they were firmer in getting their wants, but less likely to engage in fair compromise
than men with lower fWHRs.
Lewis et al. (2012) too assessed the behavioural traits associated with fWHR among
former US presidents. They found a positive association between fWHR and achievement
17drive suggesting indirect correlations to dominance and aggression.
2.7 Beauty
There has been no research linking fWHR directly with beauty, but there is research showing
the effect of beauty on labour market outcomes. Overall, it is speculated people benefit from
being more attractive, though women may at times face a beauty penalty (Johnson et al.
(2010).
Hamermesh and Biddle, (1994) investigate the impact of beauty on earnings. Using
data about beauty obtained from interviewers’ opinions of a sample of 5,000 survey respon-
dents, they find a positive relationship between attractiveness and earnings, with perceived
plainness costing individuals approximately 5-10 percent of their income. They find these
effects are consistent across gender. More so, unattractive women have lower-labour force
participation rates and the impact of attractiveness is independent of occupation, suggesting
exogenous employer discrimination. Biddle and Hamermesh, (1995) confirm these results
by assessing the impact of beauty on earnings of 3,750 lawyers. They find better looking
attorneys earn more than less attractive attorneys. Along this line, Andreoni and Petrie,
(2007) show that there is a beauty premium in most workforces, however this becomes a
penalty when cooperation is explored. More attractive individuals are perceived to be more
cooperative, but when this is not the case, they appear to be more selfish. In contrast to
these findings, Kanazawa and Still, (2018) document that the very unattractive earn more
than the highly attractive. Sparacino and Hansell, (1979), however, find no link between
attractiveness and academic success, which is corroborated by Talamas et al. (2018).
There also exists a related literature documenting the effects of make-up or grooming on
labour market outcomes. Hamermesh et al. (2002) find that the purchase of beauty products
increases women’s earnings by increasing women’s perceived attractiveness. Palumbo et al.
18(2017) link high self-esteem to greater academic performance. With previous literature sug-
gesting self-esteem could be raised through the use of make-up, they find that women wearing
make-up scored higher on tests than those without make-up. This suggests beauty, by raising
self-esteem, positively impacts academic performance. Similarly, Wong and Penner, (2016)
find that attractive individuals earn 20 percent more than those of average attractiveness,
but this relationship lessens when grooming is controlled for.
In academia, Fidrmuc and Paphawasit, (2018) investigate the impact of physical at-
tractiveness on productivity. Removing any impact of physical perceptions of beauty by
looking at academic publications, they assessed if attractiveness is positively correlated with
publications using a sample of 2,000 academics. They find a positive relationship between
attractiveness and both journal quality and number of citations. Liu et al. (2018) investigate
the effect of beauty on academic career success using a sample of professors at the top 50
US business schools. They find that more attractive professors find better first jobs and
receive tenure earlier. The effects of beauty from associate to full professor, however, are
insignificant. They argue that beauty is a proxy for intelligence and social competency.
3 A Model of Personality, Skills, and Outcomes
In this section, we want to introduce a framework to conceptualize our thinking about the
effect of personality or personality traits on skill formation and outcomes.8 We further for-
mulate how skills evolve over time.9
We combine the model of cognitive and non-cognitive skill formation (Cunha and Heckman,
2007; Cunha et al. 2010; and Heckman and Mosso, 2014) with the work by Heckman et
8
In the psychology literature, ”traits” are relatively stable patterns of behaviour, thought, and emotion
(see Roberts, 2009).
9
Notice that we could also use the term ”ability” rather than ”skill” as they are interchangeable (Cunha
and Heckman, 2007).
19al. (2019) on personality psychology and the field of heritability (Turkheimer, 2000; Power
and Pluess, 2015; Roysamb et al. 2018; and Almlund et al.(2011); and McAdams and Pals,
(2006)) and stability of personality traits (Ferguson, 2010; Cobb-Clark and Schurer, 2012;
and Harris et al. 2016). For cognitive skills, Bouchard et al. (1990); Devlin et al. (1997);
Burt, (2008); Fletcher, (2013); and Plomin, (1999) show that general cognitive ability and
IQ are heritable. For example, Bouchard et al. (1990), using a twin-study design, find that
about 70 percent of IQ is explained by genes. Devlin et al. (1997) however find this to ex-
plain less than 50 percent of the variation. Similarly, Fowler et al. (2009) show that people
are endowed with traits which affect network attributes, a non-cognitive skill. Importantly,
these traits are heritable and genes explain about 46 percent of the variation in in-degree, 47
percent in node transitivity, and 29 percent of betweenness centrality. Further, in contrast
to the modelling in the existing literature, we allow for gender differences in our model.
We begin by defining the vector of skills Φi,t at any point in time t. Time in the model
could refer to age or the time since completing the PhD and joining a University at a junior
position. The index i indicates whether the person is male, M , or female, F . Research has
shown that gender differences in personality traits exist (Schmitt et al. 2008; Weisberg et al.
2011; Del Giudice et al. 2012; Braakmann, 2009; Buchan et al. 2008; and Flinn et al. 2018),
suggesting that distinguishing between personality traits is important in our model for two
reasons. Firstly, we argue that gender differences will affect the accumulation of skills, for
example by affecting the formation of social and collaborative networks (McDowell et al.
2007; Boschini and Sjögren, 2007; Blau and Kahn, 2017; Bertrand, 2018; Lindenlaub and
Prummer, 2020), and, hence, outcomes. Secondly, it allows for discrimination against people
who violate (perceived) gender norms and ideals. This is relevant in that extensive literature
documents that women who do not act according to gender norms or who do not fit gender
ideals are discriminated against (Burgess and Borgida, 1999; Maass et al. 2003; Parkins et al.
2006; and Berdahl, 2007). Further, Blau and Kahn (2017) as well as Bertrand (2018) stress
20personality traits to be driving forces of gender differences in labour market outcomes. They
identify differences in risk and time preferences, competitiveness, self-esteem, self-confidence,
social norms, and gender identity as crucial factors to explain part of the existing gender gaps.
The skill vector Φi,t is multidimensional and we assume that it depends on cognitive, ΦC
i,t ,
and non-cognitive, ΦN
i,t , skills as in Cunha and Heckman (2007) and Cunha et al. (2010),
such that
∀t, i ∈ {M, F } : Φi,t = ΦC N
i,t , Φi,t . (1)
The vector of cognitive skills covers IQ and inherent talents, while the vector of non-cognitive
skills covers personality traits that can vary over time, such as neuroticism and agreeableness
(Harris et al. 2016). Skills can vary with the accumulation of experience and people can
acquire new skills as they get older, such that the dimensionality of these vectors can change
over time (Heckman and Rubinstein, 2001; Heckman and Raut, 2016; and Heckman et al.
2013).
In contrast to the modelling approach in Cunha and Heckman, (2007); Cunha et al. (2010);
Heckman and Mosso, (2014); and Heckman et al. (2019), we explicitly consider stable per-
sonality traits, which do not vary over time and are inherited rather than a product of the
environment. Therefore, we distinguish between time-varying non-cognitive skills captured
in the vector ΦN
i,t and a stable component, Pi , which is time-invariant and which we refer to
as personality (traits). Examples of the stable component include openness, conscientious-
ness, and extraversion (Cobb-Clark and Schurer, 2012; and Harris et al. 2016), as well as
risk (Schildberg-Hörisch, 2018) and time preferences (Meier and Sprenger, 2015). Further,
Bouchard et al. (1990) show that personality traits - to some degree - are heritable.10
Having discussed the two skill vectors, we define the skill formation technology that
10
A different approach to model the stable, heritable component is to make assumptions about the initial
values of the skill vectors. This would leave our results unaffected but make the notation more complicated.
21determines how cognitive and non-cognitive skills evolve over time. Following Cunha and
Heckman, (2007); and Cunha et al. (2010), we assume that the technology depends on the
stock of cognitive and non-cognitive skills, personality, and investment, I, into specific skills.
Formally,
∀t, i ∈ {M, F } , j ∈ {C, N } : Φji,t+1 = fi,t
j
ΦC N j
i,t , Φi,t , Pi , Ii,t , (2)
where ΦC N j
i,1 and Φi,1 are given initial values. Further, the function f is monotone increasing
in all its arguments, twice continuously differentiable, and concave. We think about the
investment into cognitive skills as studying and learning new methods or subjects, and for
non-cognitive skills as general personal development.11 This formulation of skill formation
technology allows for two crucial features. First, self-productivity, where skills learned at
time t augment skills learned later. Second, there is cross-fertilization, i.e. cognitive skills
affect the production of non-cognitive skills and vice versa.
This technology could be modelled as stage specific by introducing an index s as in Cunha
et al. (2010), to allow the undergraduate or postgraduate periods to be critical periods of
skill development. For example, investments during these time periods could have higher
returns compared to investments later in the career. Since this is beyond the scope of our
paper, we abstract from this extension.
Skills and personality are important drivers of outcomes, Y , in the model (Borghans et
al. 2008; Dohmen et al. 2010; Heckman et al. 2019). However, outcomes also depend on
effort and incentives to perform. Outcomes are produced according to
∀m, t, i ∈ {M, F } : Ym,i,t = gm,i,t ΦC N
i,t , Φi,t , Pi , em,i,t , (3)
where m indicates the specific outcome, for example publishing articles, applying for pro-
motion, or applying for external grants. The function g maps inputs to outcomes and is
11
For example affected by life-events such as marriage or giving birth.
22monotone increasing, concave in all arguments, and twice continuously differentiable. This
formulation implies that skills can affect different outcomes with different weights. For ex-
ample, cognitive skills might increase the probability to publish in a Top 5 journal, but
non-cognitive skills might affect the probability of being promoted via, for example, network
formation. This approach also allows to compensate for any shortcomings in achieving an
outcome. A deficit in one dimension can be compensated for by an abundance of another
dimension, e.g. motivation or effort.
Further, it is possible to generalize equation (3) and allow past outcomes to affect contempo-
raneous outcomes. For example, publishing an article in a Top 5 journal today could affect
the probability of publishing in the same journal again in the future. In addition, publishing
in a Top 5 journal could also increase the probability of being promoted in the future. This
implies that there is a dynamic cross-fertilization between outcomes such that equation (3)
could be written as
∀m, t, i ∈ {M, F } : Ym,i,t = gm,i,t ΦC N
i,t , Φi,t , Pi , em,i,t , Ym,i,t−l , Yn,i,t−l , (4)
where l indicates the lag with which past outcomes affect contemporaneous outcomes and
we have included the possibility that outcome n, e.g. receiving a grant, affects outcome m,
e.g. publishing in a Top 5 Journal.
Effort is a function of skills, personality, incentives, and preferences as in Heckman et
al. (2019). Incentives, R, are provided by the University or the market, e.g. job offers from
other Universities. Incentives depend on the information about the uncertain return. For
example, allocating effort into a research project where the outcome is highly uncertain,
e.g. because it is unclear whether results will be obtained at all or where the paper will be
published, might not be optimal given multiple available projects with different risk-reward
profiles.
23The effort supply function can be written as
∀m, t, i ∈ {M, F } : em,i,t = hm,i,t ΦC N
i,t , Φi,t , Pi , Ei,t Rm,i,t (Im,i,t−1 ) | Θi , (5)
where E denotes the mathematical expectation operator and Im,i,t−1 denotes the information
set at time t − 1 about the anticipated return of outcome m in period t. The function h
links the inputs into the effort function to the task-level effort. The function is monotone in-
creasing, concave in all arguments, and twice continuously differentiable. Further, following
the approach by Heckman and Mosso, (2014) effort also depends on the set of preferences, Θi .
Given the assumptions on the skill formation technology, the effect of skills on outcomes
is given by
∂Ym,i,t
∀t, i ∈ {M, F } , j ∈ {C, N } : > 0, (6)
∂Φji,t
such that higher cognitive and non-cognitive skills will increase outcomes. While this effect
is non-linear and exhibits decreasing marginal returns, the sign of the effect will be positive.
The effect of personality on non-cognitive skills, e.g. the ability to form networks via openness
or dominance, however is more interesting and at the heart of our model. We argue that
men, who are more risk-taking, dominant, and who have a higher achievement drive will
be more successful partially by acquiring greater non-cognitive skills, e.g. having larger
networks (McDowell et al. 2007; Ductor et al. 2018; and Lindenlaub and Prummer, 2020).
However, for women who do not act according to gender norms or who do not fit gender
ideals, i.e. who are more risk-taking, dominant, and who have a higher achievement drive;
could be less successful. There are various reasons for this. Firstly, they may endogenously
invest less time and effort into building networks, preferring to work alone or in smaller
networks (McDowell et al. 2007; Ductor et al. 2018; and Lindenlaub and Prummer, 2020).
Secondly, they may prefer to work alone and make other decisions (e.g. where to send a
paper for publication or which conferences to attend; Blau et al. 2010) due to different
24levels of risk aversion. Thirdly, they may be discriminated against, which would limit their
ability to accumulate non-cognitive skills (Burgess and Borgida, 1999; Maass et al. 2003;
Parkins et al. 2006; and Berdahl, 2007). Discrimination against women in economics has
been documented, for example, by Blackaby et al. (2005); Blau and Kahn, (2017); and
Bertrand (2018) who stress the role of personality traits and norms for non-cognitive skill
formation is a viable explanation for gender gaps more generally.
Therefore, the effect of personality on non-cognitive skills depends on gender and is given by
∂ΦN > 0 if i = M ,
i,t
∀t : = (7)
∂Pi
< 0 if i = F .
such that an increase in P is interpreted as becoming more dominant. Thus, this implies that
the effect of changes in personality - via non-cognitive skills - on outcomes depends on gender.
In our empirical analysis, we will exploit cross-sectional variation in outcomes, personality
traits, and confounding variables to investigate the effect of personality on outcomes by
gender.
4 Data and Econometric Strategy
4.1 Data Set Construction
The data set used in our analysis consists of information from all faculty members of the
top 100 US (University) Economic departments. Universities are ranked according to the
ideas.repec.org ranking of the top 25 percent of US Economics departments as of September
2020, and the data set was collected from July to November 2020.
We exclude economists working at Federal Reserve Banks, international organizations (e.g.
IMF or World Bank), or private companies (e.g. Microsoft or Google) in the US. There are
three reasons to exclude them. First, within the University world, the expectation is that
25faculty members contribute to (i) teaching, (ii) research, and (iii) service jobs. This will be
different outside the University world and would affect the behaviour of individuals. Second,
employers might set different incentives and, third, might measure performance differently.
Therefore, while these exclusions reduce our sample size, they keep the sample homogeneous
with respect to the expectations and incentives of employers and the measurement of per-
formance. For similar arguments, we have excluded other countries and academic disciplines
too.
Further, we define a ”faculty member” as an assistant, associate, or full professor. This
excludes adjunct, visiting, or emeritus professors and all teaching positions as well as Post-
Doctorates and PhD students.12
Given the large variation in the structure of CVs, it is impossible to use a data scraping
algorithm and we, therefore, collected the data manually. We collect a list of faculty mem-
bers from the departments web-page. From this web-page, we gain access to each faculty
member’s CV. Since faculty members often have a private web-page, we check whether the
CV on the departments web-page or the private web-page is more recent and use the more
up to date document.13 We exclude all CVs older than five years, as information is likely
to be outdated. 1,497 (60.6 percent) of the total observations were from CVs most recently
updated in 2020. 564 (22.8 percent) were from 2019, 210 (8.5 percent) from 2018, 89 (3.6
percent) from 2017, 64 (2.6 percent) from 2016, and 47 (1.9 percent) from CVs most recently
updated in 2015.
For each faculty member we record the following information: rank, gender, ethnicity,
nationality, time since completing a Bachelor degree, time since completing a PhD, PhD
12
One individual in our sample was visiting an University and appeared in the faculty list of two Univer-
sities. We allocated this individual to the ”home” University.
13
For a very small number of faculty members we can not find CVs on the departments web-page or a
private web-page and search for other web-pages with a CV. Often, we find a CV on web-pages of networks
or institutions the faculty member is associated with, for example, the IZA network.
26You can also read