City Statistics User Guide - Coverage, Definitions, Methodology & FAQ MarketLine Advantage
←
→
Page content transcription
If your browser does not render page correctly, please read the page content below

City Statistics User Guide
Coverage, Definitions, Methodology & FAQ

MarketLine Advantage

Published:   March 2019
City Statistics User Guide
Published: March 2019

Table of Contents
      1.          CITY DATA                                                                         4

           1.1.    How to access                                                                    4

      2.          OVERVIEW DASHBOARD                                                                6

      3.          ECONOMIC, DEMOGRAPHIC, AND HOUSEHOLD DASHBOARDS                                   8

           3.1.    Economic dashboard                                                               8

           3.2.       Demographic dashboard                                                         8

           3.3.       Household dashboard                                                           8

           3.4.       Labor dashboard                                                               8

      4.          INSIGHT FRAMEWORK                                                                 9

      5.          LATEST DATA PAGE                                                                 10

      6.          DATA DOWNLOAD PAGE                                                               11

      7.          DEFINITIONS                                                                      12

           7.1.    Indicator definitions                                                           12

           7.2.    Economy                                                                         12

           7.3.    Demographics                                                                    13

           7.4.    Employment                                                                      13

           7.5.    Households                                                                      14

           7.6.    Geographical definitions                                                        14

      8.          METHODOLOGY AND FREQUENTLY ASKED QUESTIONS                                       16

           8.1.    Sourcing, quality and confidence                                                16

                  8.1.1.   Where do you collect your data from?                                    16

                  8.1.2.   How trustworthy is your data?                                           16

                  8.1.3.   What kind of quality control measures do you implement?                 16

                  8.1.4.  How do you ensure consistency in the definitions when your data is from multiple
                  sources?                                                                        16

                  8.1.5.   How do you overcome gaps in source data?                                16

© MarketLine 2019. This product is licensed and is not to be photocopied.                                    1
City Statistics User Guide
Published: March 2019

               8.1.6.      How confident can you be in your data for obscure or less-developed markets?   16

        8.2.        Forecasting                                                                           17

               8.2.1.      How do you forecast your data?                                                 17

               8.2.2.      How are your exchange rates forecast?                                          17

        8.3.        Update cycles                                                                         17
               8.3.1.      How often do you update your data?                                             17

               8.3.2.      How do you ensure you are aware of any revised data or new data releases?      17

        8.4.        Coverage                                                                              17
               8.4.1.      How do you choose your cities?                                                 17

               8.4.2.      How do you choose your indicators?                                             18

               8.4.3.      Why do the area definitions of some cities differ?                             18

               8.4.4.      Why do you not provide data on populations with “No Education”?                18
               8.4.5.      Why do you estimate GVA structure as opposed to GDP?                           18

        8.5.        General data questions                                                                18

               8.5.1.      Why are the values in your database different to other sources?                18

      9.       APPENDIX                                                                                   19

        9.1.    Complete indicator list                                                                   19

               9.1.1.      Economy                                                                        19

               9.1.2.      Demographic                                                                    20

               9.1.3.      Employment                                                                     24

               9.1.4.      Households                                                                     24

        9.2.        Complete geography list                                                               25

               9.2.1.      EAST ASIA & PACIFIC                                                            25

               9.2.2.      EUROPE & CENTRAL ASIA                                                          29

               9.2.3.      LATIN AMERICA & CARIBBEAN                                                      35

               9.2.4.      MIDDLE EAST & NORTH AFRICA                                                     38

               9.2.5.      NORTH AMERICA                                                                  39

               9.2.6.      SOUTH ASIA                                                                     43

               9.2.7.      SUB-SAHARAN AFRICA                                                             44

        9.3.        MarketLine Advantage                                                                  48

© MarketLine 2019. This product is licensed and is not to be photocopied.                                      2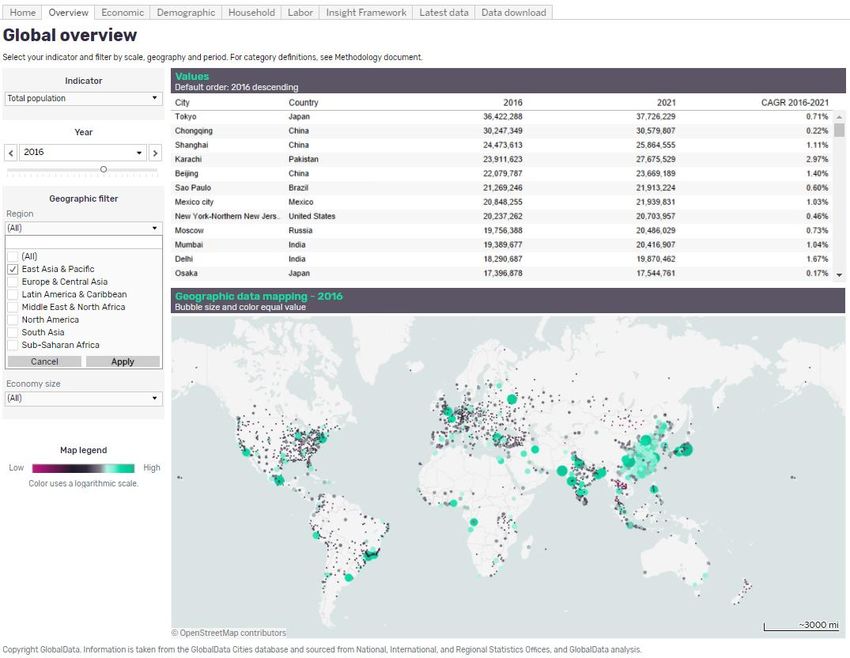
City Statistics User Guide
Published: March 2019

               9.3.1.      Company Information                              48

               9.3.2.      Sector Information                               49

               9.3.3.      Country and City Information                     49
               9.3.4.      News and Financial Deals                         50

© MarketLine 2019. This product is licensed and is not to be photocopied.        3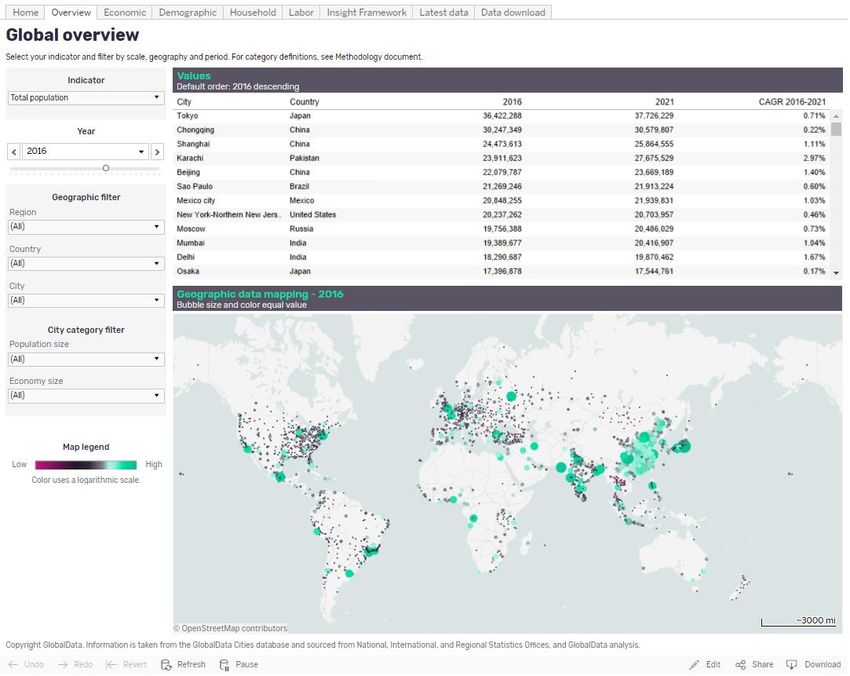
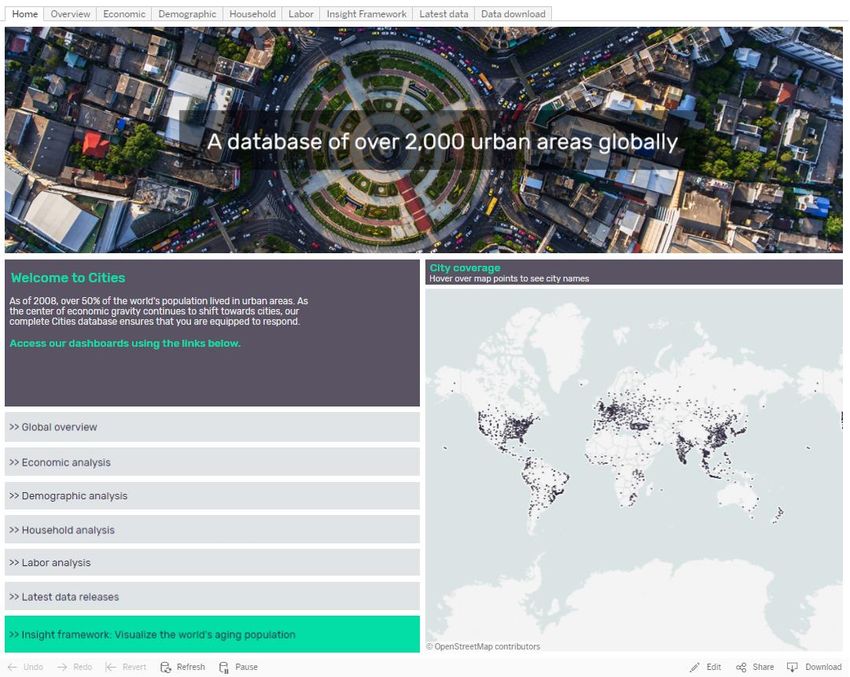
City Statistics User Guide
Published: March 2019

1.           City Data

1.1.         How to access
City Data can be accessed in the Databases menu in the MarketLine Advantage navigation bar or through the
Browse by Databases link on the MarketLine Advantage homepage:

Once you’re on the Databases section click “City Statistics” to be automatically directed to the City Data
‘Home’ page.

© MarketLine 2019. This product is licensed and is not to be photocopied.                                    4
City Statistics User Guide
Published: March 2019

Here, you will find a map showing our global coverage, links to each of our dashboards where you can access
different indicators according to each theme, as well as our featured Insight Framework of the month.

© MarketLine 2019. This product is licensed and is not to be photocopied.                                     5
City Statistics User Guide
Published: March 2019
2. Overview Dashboard
Once on the ‘Overview’ page you will find top level indicators visualized geographically, with a supporting data
table.
In order to quickly find data for your geographical preference, you will find the geographic filters
‘Region’, ‘Country’ and ‘City’ along the left hand side bar. You can select single or multiple
geographies at any one time
Using the ‘Indicator’ and ‘Year’ filters, you can find data on close to 30 indicators for your year of
choice
You will also find city category filters, which allow data selections to be filtered by size of a city’s
population or economy
© MarketLine 2019. This product is licensed and is not to be photocopied. 6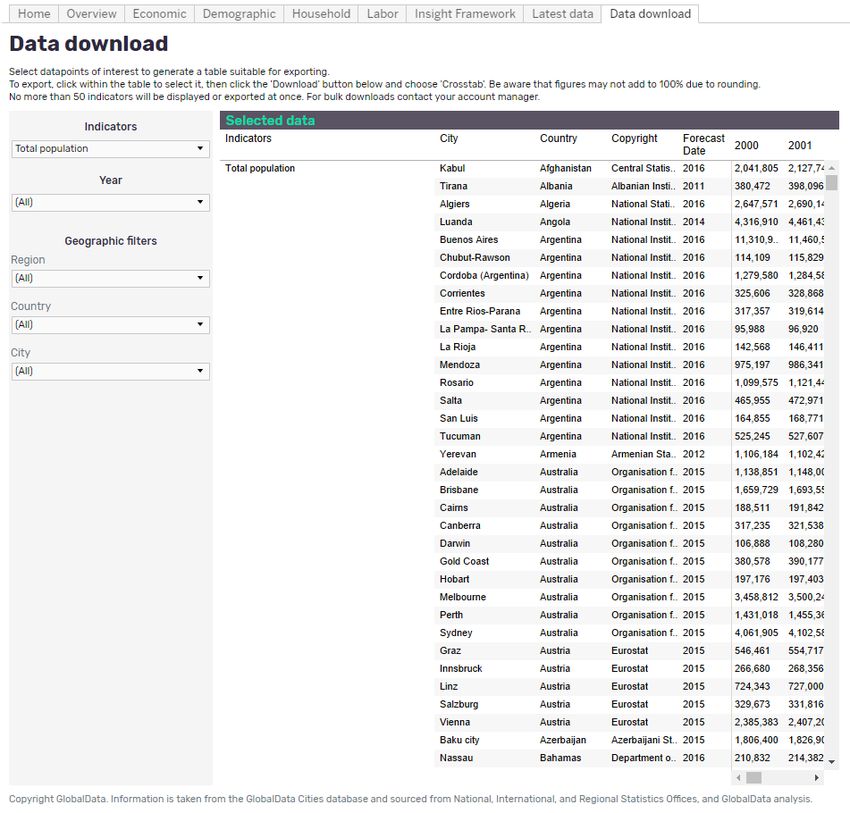
City Statistics User Guide
Published: March 2019
When you have made your selections, e.g. ‘East Asia & Pacific’ as per below, click ‘Apply’
Once you have clicked ‘Apply’, you will see the chart, legend and side bar will update accordingly.
Additional features:
If you hover over any data point with the cursor, this will show more information for that particular
data value
If you wish to download a map, chart or data point via Tableau Workbook, PDF, data cut or image,
you will first need to click on the map, chart or data point which you wish to download, then select
the ‘Download’ button in the bottom right corner of the page and choose the format in which you
would like the data to be downloaded. To see the underlying data, it is recommended that you select
‘Crosstab’
To undo your most recent action, click ‘Undo’
To undo all of your actions, click ‘Revert’
© MarketLine 2019. This product is licensed and is not to be photocopied. 7City Statistics User Guide
Published: March 2019
3. Economic, Demographic, and Household
Dashboards
The layout of the ‘Economic’, ‘Demographic’, ‘Household’ and ‘Labor’ dashboards is the same as the
‘Overview’ dashboard seen in the previous section.
3.1. Economic dashboard
This dashboard has over 50 indicators to choose from, including GDP and employment sector breakdown
On the bottom half of the dashboard you will find a chart showing the ranking of every city within your
selection for your chosen indicator, from 2000 to 2025
3.2. Demographic dashboard
The dashboard has over 100 indicators to choose from, including five year age brackets by gender
On the right hand side of the dashboard you will find a population pyramid showing age band breakdown by
gender, for 2016 and 2021. This is an aggregation of your selected cities
Along the bottom of the dashboard, population pyramids show the same but by region
3.3. Household dashboard
This dashboard has over 20 indicators to choose from, including average household size and mean household
income
The top row of charts shows the top 200 cities for your chosen indicator as a bubble chart, and household
income distribution aggregated across your selected indicators
Below, the values are mapped geographically for your chosen year
3.4. Labor dashboard
This dashboard has 11 indicators to choose from, including employment by sector and labor force
participation rate
The top row of charts is fixed to show employment by sector for your chosen year and unemployment rate
over time
Below, your chosen indicator is mapped geographically for further analysis
© MarketLine 2019. This product is licensed and is not to be photocopied. 8City Statistics User Guide
Published: March 2019
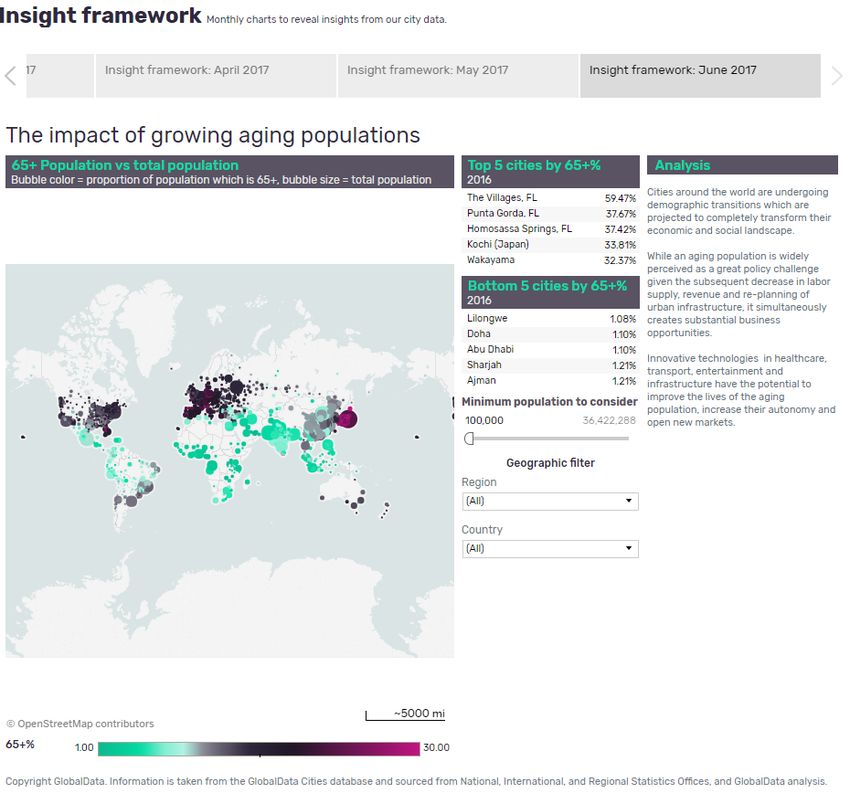
4. Insight Framework
The ‘Insight Framework’ tab allows you to explore nuances in the data and create your own data story
Each month, we provide a new chart that presents interesting data in a novel way. For example,
June’s chart explores the impact of aging populations
Navigate through each month’s chart by clicking through the buttons along the top of the
dashboard, or using the arrows directly
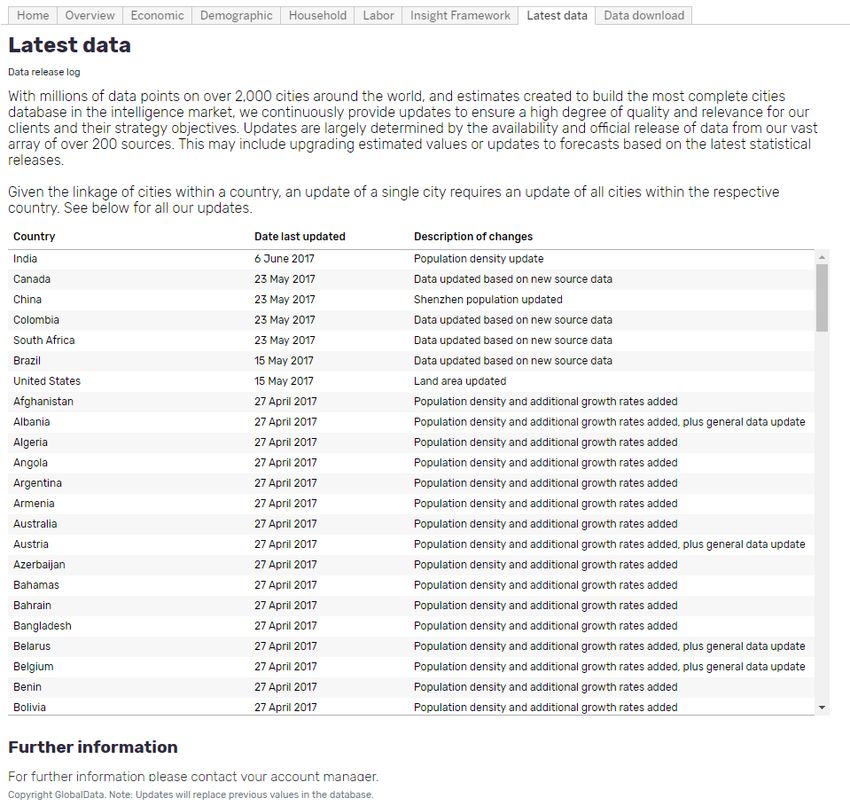
© MarketLine 2019. This product is licensed and is not to be photocopied. 9City Statistics User Guide Published: March 2019 5. Latest Data Page As MarketLine is committed to providing clients with the most relevant and up-to-date data available, we will regularly be updating our data set. Clients can visit the ‘Latest data’ tab to keep abreast of all the latest data changes we have made. © MarketLine 2019. This product is licensed and is not to be photocopied. 10
City Statistics User Guide
Published: March 2019
6. Data Download Page
The ‘Data Download’ dashboard provides the same data available on the other dashboards, but on this page
all the indicators are available to select multiple indicators for multiple years. Update the indicator selection
as per your preferences using the filters in the left hand side bar, and then download as an Excel file.
The data will be shown, along with country and sourcing information in the table to the right
To download the data click within the table to ‘activate’ it, navigate to the bottom right of the screen
and click on the ‘Download’ button. From here you can export the data as ‘Crosstab’ (recommended),
PDF, image and so on
To ensure a swifter user experience, downloads are limited to 50 indicators at a time
© MarketLine 2019. This product is licensed and is not to be photocopied. 11City Statistics User Guide
Published: March 2019
7. Definitions
7.1. Indicator definitions
An extensive list of our indicators and their definitions, and routes to calculation, can be found in the
Appendix. A summary is below:
7.2. Economy
Economy – Total Nominal GDP
Total consumption (or demand) of an economy. Nominal GDP is provided in current market US
Dollars (USD), Purchasing Power Parity (PPP), Local Currency (LCU), plus per capita and annual
growth values.
Economy – Total Nominal GVA
Total Gross Value Added is a measure of the value of goods and services produced in an area,
industry or sector of an economy. Nominal GVA is provided in current market US Dollars (USD), Local
Currency (LCU), plus per capita and annual growth values.
Economy - Agriculture Nominal GVA
Total Gross Value Added for the agriculture sector within an economy which includes forestry,
hunting, fishing, as well as cultivation of crops and livestock production.
Economy – Industry Nominal GVA
Total Gross Value added for the industry sector includes manufacturing, mining and utilities (mining
and quarrying, manufacturing, electricity/metro, gas, steam and air conditioning supply, water
supply and waste management) and construction (construction of buildings, civil engineering and
other constructions).
Economy – Services Nominal GVA
Total Gross Value added for the services sector includes wholesale and retail trade; accommodation
and food services; transport; information and communication (wholesale and retail trade; repair of
motor vehicles and motorcycles, transportation and storage, accommodation and good service
activities and information and communication); financial intermediation and real estate (financial and
insurance activities, real estate activities and professional, scientific and technical activities,
administrative and support service activities) public administration; education; health and other
services (public administration and defense, compulsory social security, education, human health
and social work activities, arts, entertainment and recreation, other service activities, activities of
households as employers; undifferentiated goods and services producing activities of households for
own use and activities of extraterritorial organizations and bodies).
Economy - Real GDP - Index (2010 = 100)
Real GDP factors in the price-level (or inflation); GDP growth is anchored to a base year to
demonstrate growth from a certain period.
Economy - Prices - Consumer price index (2010 = 100)
Consumer price index presents the growth of the average price level for a basket of good used by
consumers. Price level growth is anchored to a base year to demonstrate change from historical
periods. We specifically look at the annual average CPI rate.
© MarketLine 2019. This product is licensed and is not to be photocopied. 12City Statistics User Guide
Published: March 2019
7.3. Demographics
Demographics - Education – Less than Secondary Education
Total population aged 25+ whose highest education attainment level is primary education or less.
Demographics - Education - Secondary Education
Total population aged 25+ whose highest education attainment level is secondary education.
Demographics - Education structure - Further Education
Total population aged 25+ whose highest education attainment level is tertiary education, this
includes college, university, technical, masters, PhD etc.
Demographics - Population
Total population of both males and females. Five year age bands (0-4, 5-9, 10-14 etc) are
additionally provided.
Demographics - Population - Male
Total population of males. Five year age bands (0-4, 5-9, 10-14 etc) are additionally provided.
Demographics - Population - Female
Total population of females. Five year age bands (0-4, 5-9, 10-14 etc) are additionally provided.
7.4. Employment
Employment - Labor force
The labor force is the supply of labor available for producing goods and services in an economy. It
includes people who are currently employed and people who are unemployed but seeking work as
well as first-time job-seekers. In many cases, not everyone who works is included. Unpaid workers,
family workers, and students are often omitted, and some countries do not count members of the
armed forces.
Employment - Labor Force - Participation rate
Labor force participation rate is the percent of the working age population (15-64 years) who are in
the labor force, meaning they are either employed or actively seeking employment.
Employment - Employment
Total year-end number of people who are employed within an economy, totaling the agriculture,
industry and service sectors.
Employment - Employment - Agriculture
Total year-end number of people who are employed in the agriculture sector within a city, which
includes forestry, hunting, fishing as well as cultivation of crops and livestock production.
Employment - Employment - Industry
Total year-end number of people who are employed in the industry sector within a city, which
includes mining and quarrying, manufacturing, electricity/metro, gas, steam and air conditioning
supply, water supply and waste management and construction.
Employment - Employment - Services
Total year-end number of people who are employed in the service sector within a city, which
includes wholesale and retail trade; repair of motor vehicles and motorcycles, transportation and
storage, accommodation and food service activities, information and communication, financial and
insurance activities, real estate activities, professional, scientific and technical activities,
administrative and support service activities, public administration and defense; compulsory social
security, education, human health and social work activities, arts, entertainment and recreation,
other service activities, activities of households as employers; undifferentiated goods- and services-
producing activities of households for own use and activities of extraterritorial organizations and
bodies.
© MarketLine 2019. This product is licensed and is not to be photocopied. 13City Statistics User Guide
Published: March 2019
Employment - Unemployment
Total number of people who are not employed within the labor force. This excludes economically
active activities such as housework and education.
Employment - Unemployment - Unemployment rate
Unemployment refers to the share of the labor force that is without work but available for and
seeking employment.
7.5. Households
Households and income - Average household size
Average number of people living in one household.
Households and income - Total number of households
“Households” includes all of the occupied housing units in an urban area. A housing unit can include
a house, flat, mobile home etc.
Households and income - Household income - Mean household income
An averaged measure of the combined incomes of all people sharing a particular household or place
of residence within the respective year. It includes every form of income, e.g., salaries and wages,
retirement income, near cash government transfers like food stamps, and investment gains.
Households and income - Household income - Median household income
The median income level of the income distribution represents the mid-point at which 50% of
households have higher or lower income.
Households and income - Household income – Households by income bracket
The number of households within a given income bracket. Values are provided in PPP, showing pre-
tax income, per annum.
Households and income - Household consumption expenditure
A measure of the total final consumption expenditure from all households on goods and services.
Households and income - Household consumption expenditure - Expenditure per household
An average measure of final consumption expenditure by a household on goods and services,
measured by the average sum of expenditure of all people occupying a single household.
7.6. Geographical definitions
Due to our process of standardization we cover urban areas of varying sizes. Definitions for what constitutes
each are below:
City definition: The definition of a city can vary depending on the country, but a city is typically a large urban
area or an area with a high concentration of human settlement. A city can be categorized depending on the
size of the population:
Megacities: Cities with populations of 10 million and more.
Large cities: Cities with populations of between 5 million and less than 10 million.
Medium-sized cities: Cities with populations of between 500,000 and less than 5 million.
Small cities: Cities with populations of less than 500,000.
Metropolitan area definition: A metropolitan area is typically defined as a region which consists of a
densely populated urban center and the surrounding regions which are connected via transport networks,
this includes areas within the direct commuter belt.
Municipality definition: A municipality is typically an urban area which has its own local government with
local jurisdiction and corporate status.
© MarketLine 2019. This product is licensed and is not to be photocopied. 14City Statistics User Guide Published: March 2019 Region definition: A region is often defined as a breakdown or categorization of a country into large areas which have definable boundaries, an example is counties such as West Midlands within the UK, or a country could be split into large general regions such as North and South Island in New Zealand. © MarketLine 2019. This product is licensed and is not to be photocopied. 15
City Statistics User Guide
Published: March 2019

8.           Methodology and Frequently Asked Questions

8.1.         Sourcing, quality and confidence

8.1.1.       Where do you collect your data from?

National statistic offices are our main source of information, supported by international and regional
statistical offices, and international charities, such as UNICEF. Using statistical offices which represent the
country, or city, in question ensures access to the best and most up-to-date data available.

8.1.2.       How trustworthy is your data?

Our credibility is driven by our data sources and our modelling methodology. Official statistics offices can
typically be trusted as they are a either a governmental department or highly regarded independent
organization which may report to the national government, or on their behalf. If we have low confidence in a
source data point, regardless of the general credibility of the source, we carry out a secondary checking
procedure to verify or discount the datWe maintain a level of transparency on such issues by providing
information on our sources.

8.1.3.       What kind of quality control measures do you implement?

To ensure the highest quality data possible, quality checks are implemented at every stage of the end-to-end
process. We ensure the validity of our data with numerous automated tests, as well as manual checking of
data points and overall trends. Additionally, we regularly re-evaluate our modelling logic to ensure we are
continually enhancing our understanding of how intelligence on cities should be represented.

8.1.4.       How do you ensure consistency in the definitions when your data is from multiple
             sources?

A consistent and robust dataset is of paramount importance. All source definitions are checked thoroughly
before the data is extracted to ensure consistency and an estimation approach is implemented if absolutely
necessary. To ensure there are no disparities in economic definitions we collect nominal GDP at current prices
for each city, and use standardized currency conversions where needed.

8.1.5.       How do you overcome gaps in source data?

We use a variety of techniques depending on the severity of data availability however, in simple cases, we are
able to impute missing values by using linear trend methods, which produces the lowest standard error.

8.1.6.       How confident can you be in your data for obscure or less-developed markets?

© MarketLine 2019. This product is licensed and is not to be photocopied.                                         16
City Statistics User Guide Published: March 2019 Where we are unsure of the reliability of a data source we ensure figures are aligned with secondary materials. Beyond this, our hierarchical modelling approach enables us to credibly provide estimations for hard-to-research markets. 8.2. Forecasting 8.2.1. How do you forecast your data? Broadly, our principal assumption is that cities are by-in-large becoming independent entities within countries, therefore forecasting of cities should be carried out with a stronger emphasis on their independent nature (or growth). Nonetheless, we still analyze cities within its country limits (for instance, taking into account the historical city’s growth contribution to the country). Our forecast method therefore consists of a rigorous framework relevant to the city and data availability at hand, and uses exponential smoothing and linear regression techniques to derive future values. This method removes short-term volatility through dampening, giving an outlook on long-term growth. This long-term outlook is an essential condition given the high degree of estimation in micro data by official sources. 8.2.2. How are your exchange rates forecast? The latest year is estimated by taking into account year-to-date data; while the forecast is derived using International Monetary Fund implied exchange rates. 8.3. Update cycles 8.3.1. How often do you update your data? Our team of Researchers and Analysts follow an annual update cycle, while continually seeking new cities and indicators to add to our coverage. 8.3.2. How do you ensure you are aware of any revised data or new data releases? Our Analysts keep a record of source data cycles to ensure that when a source’s data is revised our data set is also updated. 8.4. Coverage 8.4.1. How do you choose your cities? We have chosen our markets based on what is most valuable to clients. This means we cover both the biggest cities and those that are growing and have great potential for the future; it also ensures that we only cover © MarketLine 2019. This product is licensed and is not to be photocopied. 17
City Statistics User Guide
Published: March 2019

markets where we can be confident in the quality of our data and our ability to provide complete,
geographically comparable values.

8.4.2. How do you choose your indicators?

To meet our goal of creating the most comprehensive cities database in the market we have selected our
indicators based on reliability and depth of the data available, usefulness in making business decisions, and
client feedback.

8.4.3. Why do the area definitions of some cities differ?

In order to provide the most accurate indication of a city’s economy or demographic situation, for example,
we will try to collate data for the city proper. If such data is unavailable, or cannot be credibly estimated, we
will attempt to use the ‘next best’ definition, i.e. metropolitan area, metropolitan region, and so on.
Improvements to our methodology mean we have now been able to provide data on a city level where we
were unable to before.

8.4.4. Why do you not provide data on populations with “No Education”?

Due to disparities between definitions of education levels across different countries, and the varying levels of
data availability we provide data on those achieving “Less than secondary education.” This allows us to
maintain consistency in our taxonomy and provide data with higher confidence.

8.4.5. Why do you estimate GVA structure as opposed to GDP?

Gross Value Added is a more valuable representation of the contribution of a given industry or sector to the
total economy. GVA is calculated by removing subsidies and taxes from GDP, factors which may differ
significantly, creating false or enhanced figures.

8.5. General data questions

8.5.1.       Why are the values in your database different to other sources?

The data points that our competitors provide may vary depending on a variety of factors, for instance, there
may be a difference in the city area definition, or a different update period, or a different source of datOur
approach is focused on providing the most complete database on cities within the market, which may not
necessarily be the same motivation of our competitors, as we strongly believe there is a need to enable
comparative analysis across cities (in similar fashion to how countries are analyzed).

If you have any queries or need further information please contact your account manager.

© MarketLine 2019. This product is licensed and is not to be photocopied.                                           18
City Statistics User Guide
Published: March 2019

9.           Appendix

9.1.         Complete indicator list

9.1.1.       Economy

Nominal GDP (m) – Total (USD, LCU)
Nominal GDP - Annual growth (%)
Nominal GDP - Per capita (USD, LCU)
Nominal GDP - Per capita: annual growth (%)
Nominal GDP - Per km2 (USD, LCU)
Nominal GDP - Per employed person (USD, LCU)
Nominal GDP - Per employed person: annual growth (%)
Nominal GDP (PPP, m) - Total
Nominal GDP (PPP) - Annual growth (%)
Nominal GDP (PPP) - Per capita
Nominal GDP (PPP) - Per capita: annual growth (%)
Nominal GDP (PPP) - Per km2
Nominal GDP (PPP) - Per employed person
Nominal GDP (PPP) - Per employed person: annual growth (%)
Real GDP (m) - Total (2010 = 100) (USD, LCU)
Real GDP - Annual growth (%)
Real GDP - Per Capita (2010 = 100) (USD, LCU)
Real GDP - Index (2010 = 100)
Real GDP - Per employed person (2010 = 100) (USD, LCU)
Real GDP - Per employed person: annual growth (%)
Real GDP - Per km2 (USD, LCU)
Nominal GVA (m) - Total (USD, LCU)
Nominal GVA - Annual growth (%) - Total
Nominal GVA (m) - Agriculture - Total (USD, LCU)
Nominal GVA structure (% of total) - Agriculture
Nominal GVA - Agriculture - Per agriculture employee
Nominal GVA (m) - Industry - Total (USD, LCU)
Nominal GVA (m) - Industry - Construction (USD, LCU)
Nominal GVA (m) - Industry - Manufacturing, mining & utilities (USD, LCU)
Nominal GVA structure (% of total) - Industry - Total
Nominal GVA structure (% of total) - Industry - Construction
Nominal GVA structure (% of total) - Industry - Manufacturing, mining & utilities
Nominal GVA - Industry - Per industry employee (USD, LCU)
Nominal GVA (m) - Services - Total (USD, LCU)
Nominal GVA (m) - Services - Financial, insurance, real estate, professional, scientific, technical, and
administrative activities (USD, LCU)
Nominal GVA (m) - Services - Public administration, education, health, and other services (USD, LCU)
Nominal GVA (m) - Services - Wholesale and retail trade, accommodation and food services, and transport,
information, and communication (USD, LCU)
Nominal GVA structure (% of total) - Services - Total
Nominal GVA structure (% of total) - Services - Financial, insurance, real estate, professional, scientific, technical,
and administrative activities
Nominal GVA structure (% of total) - Services - Public administration, education, health, and other services

© MarketLine 2019. This product is licensed and is not to be photocopied.                                                 19
City Statistics User Guide
Published: March 2019

Nominal GVA structure (% of total) - Services - Wholesale and retail trade, accommodation and food services, and
transport, information, and communication
Nominal GVA - Services - Per services employee (USD, LCU)
Nominal GVA - Annual growth (%) - Agriculture - Total
Nominal GVA - Annual growth (%) - Industry - Total
Nominal GVA - Annual growth (%) - Services - Total
Nominal GVA - Annual growth (%) - Industry - Construction
Nominal GVA - Annual growth (%) - Industry - Manufacturing, mining & utilities
Nominal GVA - Annual growth (%) - Services - Financial, insurance, real estate, professional, scientific, technical,
and administrative activities
Nominal GVA - Annual growth (%) - Services - Public administration, education, health, and other services
Nominal GVA - Annual growth (%) - Services - Wholesale and retail trade, accommodation and food services, and
transport, information, and communication
Nominal GVA - Annual growth (%) - Agriculture - Per agriculture employee
Nominal GVA - Annual growth (%) - Industry - Per industry employee
Nominal GVA - Annual growth (%) - Services - Per services employee
Prices - Consumer price index (2010 = 100) - Overall
Prices - Annual growth (%) – Overall

9.1.2.       Demographic

Population - Total
Population - Annual growth (%)
Population - Population density
Population - Under 15 years - Total
Population - Under 15 years - Annual growth (%)
Population - Under 15 years - Aged 0-4 years
Population - Under 15 years - Aged 5-9 years
Population - Under 15 years - Aged 10-14 years
Population - Under 15 years - Aged 0-4 years: annual growth (%)
Population - Under 15 years - Aged 5-9 years: annual growth (%)
Population - Under 15 years - Aged 10-14 years: annual growth (%)
Population - 15-64 years - Total
Population - 15-64 years - Annual growth (%)
Population - 15-64 years - Aged 15-19 years
Population - 15-64 years - Aged 20-24 years
Population - 15-64 years - Aged 25-29 years
Population - 15-64 years - Aged 30-34 years
Population - 15-64 years - Aged 35-39 years
Population - 15-64 years - Aged 40-44 years
Population - 15-64 years - Aged 45-49 years
Population - 15-64 years - Aged 50-54 years
Population - 15-64 years - Aged 55-59 years
Population - 15-64 years - Aged 60-64 years
Population - 15-64 years - Aged 15-19 years: annual growth (%)
Population - 15-64 years - Aged 20-24 years: annual growth (%)
Population - 15-64 years - Aged 25-29 years: annual growth (%)
Population - 15-64 years - Aged 30-34 years: annual growth (%)
Population - 15-64 years - Aged 35-39 years: annual growth (%)
Population - 15-64 years - Aged 40-44 years: annual growth (%)
Population - 15-64 years - Aged 45-49 years: annual growth (%)
Population - 15-64 years - Aged 50-54 years: annual growth (%)
Population - 15-64 years - Aged 55-59 years: annual growth (%)

© MarketLine 2019. This product is licensed and is not to be photocopied.                                          20
City Statistics User Guide
Published: March 2019

Population - 15-64 years - Aged 60-64 years: annual growth (%)
Population - 65+ years - Total
Population - 65+ years - Annual growth (%)
Population - 65+ years - Aged 65-69 years
Population - 65+ years - Aged 70-74 years
Population - 65+ years - Aged 75-79 years
Population - 65+ years - Aged 80+ years
Population - 65+ years - Aged 65-69 years: annual growth (%)
Population - 65+ years - Aged 70-74 years: annual growth (%)
Population - 65+ years - Aged 75-79 years: annual growth (%)
Population - 65+ years - Aged 80+ years: annual growth (%)
Population - Male - Total
Population - Male - Annual growth (%)
Population - Male - Under 15 years - Total
Population - Male - Under 15 years - Annual growth (%)
Population - Male - Under 15 years - Male: Aged 0-4 years
Population - Male - Under 15 years - Male: Aged 5-9 years
Population - Male - Under 15 years - Male: Aged 10-14 years
Population - Male - Under 15 years - Male: Aged 0-4 years: annual growth (%)
Population - Male - Under 15 years - Male: Aged 5-9 years: annual growth (%)
Population - Male - Under 15 years - Male: Aged 10-14 years: annual growth (%)
Population - Male - 15-64 years - Total
Population - Male - 15-64 years - Annual growth (%)
Population - Male - 15-64 years - Male: Aged 15-19 years
Population - Male - 15-64 years - Male: Aged 20-24 years
Population - Male - 15-64 years - Male: Aged 25-29 years
Population - Male - 15-64 years - Male: Aged 30-34 years
Population - Male - 15-64 years - Male: Aged 35-39 years
Population - Male - 15-64 years - Male: Aged 40-44 years
Population - Male - 15-64 years - Male: Aged 45-49 years
Population - Male - 15-64 years - Male: Aged 50-54 years
Population - Male - 15-64 years - Male: Aged 55-59 years
Population - Male - 15-64 years - Male: Aged 60-64 years
Population - Male - 15-64 years - Male: Aged 15-19 years: annual growth (%)
Population - Male - 15-64 years - Male: Aged 20-24 years: annual growth (%)
Population - Male - 15-64 years - Male: Aged 25-29 years: annual growth (%)
Population - Male - 15-64 years - Male: Aged 30-34 years: annual growth (%)
Population - Male - 15-64 years - Male: Aged 35-39 years: annual growth (%)
Population - Male - 15-64 years - Male: Aged 40-44 years: annual growth (%)
Population - Male - 15-64 years - Male: Aged 45-49 years: annual growth (%)
Population - Male - 15-64 years - Male: Aged 50-54 years: annual growth (%)
Population - Male - 15-64 years - Male: Aged 55-59 years: annual growth (%)
Population - Male - 15-64 years - Male: Aged 60-64 years: annual growth (%)
Population - Male - 65+ years - Total
Population - Male - 65+ years - Annual growth (%)
Population - Male - 65+ years - Male: Aged 65-69 years
Population - Male - 65+ years - Male: Aged 70-74 years
Population - Male - 65+ years - Male: Aged 75-79 years
Population - Male - 65+ years - Male: Aged 80+ years
Population - Male - 65+ years - Male: Aged 65-69 years: annual growth (%)
Population - Male - 65+ years - Male: Aged 70-74 years: annual growth (%)
Population - Male - 65+ years - Male: Aged 75-79 years: annual growth (%)
Population - Male - 65+ years - Male: Aged 80+ years: annual growth (%)
Population - Female - Total

© MarketLine 2019. This product is licensed and is not to be photocopied.        21
City Statistics User Guide
Published: March 2019

Population - Female - Annual growth (%)
Population - Female - Under 15 years - Total
Population - Female - Under 15 years - Annual growth (%)
Population - Female - Under 15 years - Female: Aged 0-4 years
Population - Female - Under 15 years - Female: Aged 5-9 years
Population - Female - Under 15 years - Female: Aged 10-14 years
Population - Female - Under 15 years - Female: Aged 0-4 years: annual growth (%)
Population - Female - Under 15 years - Female: Aged 5-9 years: annual growth (%)
Population - Female - Under 15 years - Female: Aged 10-14 years: annual growth (%)
Population - Female - 15-64 years - Total
Population - Female - 15-64 years - Annual growth (%)
Population - Female - 15-64 years - Female: Aged 15-19 years
Population - Female - 15-64 years - Female: Aged 20-24 years
Population - Female - 15-64 years - Female: Aged 25-29 years
Population - Female - 15-64 years - Female: Aged 30-34 years
Population - Female - 15-64 years - Female: Aged 35-39 years
Population - Female - 15-64 years - Female: Aged 40-44 years
Population - Female - 15-64 years - Female: Aged 45-49 years
Population - Female - 15-64 years - Female: Aged 50-54 years
Population - Female - 15-64 years - Female: Aged 55-59 years
Population - Female - 15-64 years - Female: Aged 60-64 years
Population - Female - 15-64 years - Female: Aged 15-19 years: annual growth (%)
Population - Female - 15-64 years - Female: Aged 20-24 years: annual growth (%)
Population - Female - 15-64 years - Female: Aged 25-29 years: annual growth (%)
Population - Female - 15-64 years - Female: Aged 30-34 years: annual growth (%)
Population - Female - 15-64 years - Female: Aged 35-39 years: annual growth (%)
Population - Female - 15-64 years - Female: Aged 40-44 years: annual growth (%)
Population - Female - 15-64 years - Female: Aged 45-49 years: annual growth (%)
Population - Female - 15-64 years - Female: Aged 50-54 years: annual growth (%)
Population - Female - 15-64 years - Female: Aged 55-59 years: annual growth (%)
Population - Female - 15-64 years - Female: Aged 60-64 years: annual growth (%)
Population - Female - 65+ years - Total
Population - Female - 65+ years - Annual growth (%)
Population - Female - 65+ years - Female: Aged 65-69 years
Population - Female - 65+ years - Female: Aged 70-74 years
Population - Female - 65+ years - Female: Aged 75-79 years
Population - Female - 65+ years - Female: Aged 80+ years
Population - Female - 65+ years - Female: Aged 65-69 years: annual growth (%)
Population - Female - 65+ years - Female: Aged 70-74 years: annual growth (%)
Population - Female - 65+ years - Female: Aged 75-79 years: annual growth (%)
Population - Female - 65+ years - Female: Aged 80+ years: annual growth (%)
Population structure (% of total) - Under 15 years - Total
Population structure (% of total) - Under 15 years - Aged 0-4 years
Population structure (% of total) - Under 15 years - Aged 5-9 years
Population structure (% of total) - Under 15 years - Aged 10-14 years
Population structure (% of total) - 15-64 years - Total
Population structure (% of total) - 15-64 years - Aged 15-19 years
Population structure (% of total) - 15-64 years - Aged 20-24 years
Population structure (% of total) - 15-64 years - Aged 25-29 years
Population structure (% of total) - 15-64 years - Aged 30-34 years
Population structure (% of total) - 15-64 years - Aged 35-39 years
Population structure (% of total) - 15-64 years - Aged 40-44 years
Population structure (% of total) - 15-64 years - Aged 45-49 years
Population structure (% of total) - 15-64 years - Aged 50-54 years

© MarketLine 2019. This product is licensed and is not to be photocopied.            22
City Statistics User Guide
Published: March 2019

Population structure (% of total) - 15-64 years - Aged 55-59 years
Population structure (% of total) - 15-64 years - Aged 60-64 years
Population structure (% of total) - 65+ years - Total
Population structure (% of total) - 65+ years - Aged 65-69 years
Population structure (% of total) - 65+ years - Aged 70-74 years
Population structure (% of total) - 65+ years - Aged 75-79 years
Population structure (% of total) - 65+ years - Aged 80+ years
Population structure (% of total) - Male - Total
Population structure (% of total) - Male - Under 15 years - Total
Population structure (% of total) - Male - Under 15 years - Male: Aged 0-4 years
Population structure (% of total) - Male - Under 15 years - Male: Aged 5-9 years
Population structure (% of total) - Male - Under 15 years - Male: Aged 10-14 years
Population structure (% of total) - Male - 15-64 years - Total
Population structure (% of total) - Male - 15-64 years - Male: Aged 15-19 years
Population structure (% of total) - Male - 15-64 years - Male: Aged 20-24 years
Population structure (% of total) - Male - 15-64 years - Male: Aged 25-29 years
Population structure (% of total) - Male - 15-64 years - Male: Aged 30-34 years
Population structure (% of total) - Male - 15-64 years - Male: Aged 35-39 years
Population structure (% of total) - Male - 15-64 years - Male: Aged 40-44 years
Population structure (% of total) - Male - 15-64 years - Male: Aged 45-49 years
Population structure (% of total) - Male - 15-64 years - Male: Aged 50-54 years
Population structure (% of total) - Male - 15-64 years - Male: Aged 55-59 years
Population structure (% of total) - Male - 15-64 years - Male: Aged 60-64 years
Population structure (% of total) - Male - 65+ years - Total
Population structure (% of total) - Male - 65+ years - Male: Aged 65-69 years
Population structure (% of total) - Male - 65+ years - Male: Aged 70-74 years
Population structure (% of total) - Male - 65+ years - Male: Aged 75-79 years
Population structure (% of total) - Male - 65+ years - Male: Aged 80+ years
Population structure (% of total) - Female - Total
Population structure (% of total) - Female - Under 15 years - Total
Population structure (% of total) - Female - Under 15 years - Female: Aged 0-4 years
Population structure (% of total) - Female - Under 15 years - Female: Aged 5-9 years
Population structure (% of total) - Female - Under 15 years - Female: Aged 10-14 years
Population structure (% of total) - Female - 15-64 years - Total
Population structure (% of total) - Female - 15-64 years - Female: Aged 15-19 years
Population structure (% of total) - Female - 15-64 years - Female: Aged 20-24 years
Population structure (% of total) - Female - 15-64 years - Female: Aged 25-29 years
Population structure (% of total) - Female - 15-64 years - Female: Aged 30-34 years
Population structure (% of total) - Female - 15-64 years - Female: Aged 35-39 years
Population structure (% of total) - Female - 15-64 years - Female: Aged 40-44 years
Population structure (% of total) - Female - 15-64 years - Female: Aged 45-49 years
Population structure (% of total) - Female - 15-64 years - Female: Aged 50-54 years
Population structure (% of total) - Female - 15-64 years - Female: Aged 55-59 years
Population structure (% of total) - Female - 15-64 years - Female: Aged 60-64 years
Population structure (% of total) - Female - 65+ years - Total
Population structure (% of total) - Female - 65+ years - Female: Aged 65-69 years
Population structure (% of total) - Female - 65+ years - Female: Aged 70-74 years
Population structure (% of total) - Female - 65+ years - Female: Aged 75-79 years
Population structure (% of total) - Female - 65+ years - Female: Aged 80+ years
Population - Dependency ratio - Non-working to working age population
Population - Dependency ratio - Over 64 to working age population
Population - Dependency ratio - Under 15 to working age population
Population - Dependency ratio - Non-working to working age population: annual growth (%)
Population - Dependency ratio - Over 64 to working age population: annual growth (%)

© MarketLine 2019. This product is licensed and is not to be photocopied.                  23
City Statistics User Guide
Published: March 2019

Population - Dependency ratio - Under 15 to working age population: annual growth (%)
Education - Secondary education - Total
Education - Further education - Total
Education - Less than Secondary education - Total
Education structure (% of total) - Less than Secondary education
Education structure (% of total) - Secondary education
Education structure (% of total) - Further education
Education - Less than Secondary education - Annual growth (%)
Education - Secondary education - Annual growth (%)
Education - Further education - Annual growth (%)

9.1.3.       Employment

Total
Total - Annual growth (%)
Agriculture
Agriculture - Annual growth (%)
Industry
Industry - Annual growth (%)
Services
Services - Annual growth (%)
Employment structure (% of total) - Agriculture
Employment structure (% of total) - Industry
Employment structure (% of total) - Services
Labour force - Total
Labour force - Total - Annual growth (%)
Labour force - Participation rate
Labour force - Participation rate - Annual growth (%)
Unemployment - Total
Unemployment - Total - Annual growth (%)
Unemployment - Unemployment rate
Unemployment - Unemployment rate - Annual growth (%)

9.1.4.       Households

Total number of households
Total number of households - Annual growth (%)
Household density
Average household size
Average household size - Annual growth (%)
Household final consumption expenditure - Total (USD, LCU)
Household final consumption expenditure - Annual growth (%)
Household final consumption expenditure - Mean household expenditure (USD, LCU)
Household final consumption expenditure - Mean household expenditure - Annual growth (%)
Household income - Mean household income (USD, LCU)
Household income - Mean household income - Annual growth (%)
Household income - Median household income (USD, LCU)
Household income - Median household income - Annual growth (%)
Number of households by income brackets - PPP0-1,999
Number of households by income brackets - PPP2,000-3,999
Number of households by income brackets - PPP4,000-9,999

© MarketLine 2019. This product is licensed and is not to be photocopied.                  24
City Statistics User Guide
Published: March 2019

Number of households by income brackets - PPP10,000-19,999
Number of households by income brackets - PPP20,000-39,999
Number of households by income brackets - PPP40,000-74,999
Number of households by income brackets - PPP75,000+
Household income structure (% of total) - By income bracket: PPP0-1,999
Household income structure (% of total) - By income bracket: PPP2,000-3,999
Household income structure (% of total) - By income bracket: PPP4,000-9,999
Household income structure (% of total) - By income bracket: PPP10,000-19,999
Household income structure (% of total) - By income bracket: PPP20,000-39,999
Household income structure (% of total) - By income bracket: PPP40,000-74,999
Household income structure (% of total) - By income bracket: PPP75,000+

9.2. Complete geography list

9.2.1.       EAST ASIA & PACIFIC

Australia
                     Adelaide                                       Brisbane       Cairns
                     Canberra                                       Darwin         Gold Coast-Tweed Heads
                     Hobart                                         Melbourne      Perth
                     Sydney

Cambodia
      Phnom Penh

China
                     China
                     Ankang                                     Anqing          Anshan
                     Anshun                                     Anyang          Baicheng
                     Baise                                      Baishan         Baiyin
                     Baoding                                    Baoji           Baoshan
                     Bazhong                                    Beihai          Beijing
                     Bengbu                                     Benxi           Binzhou
                     Bozhou                                     Cangzhou        Changchun
                     Changde                                    Changsha        Changzhi
                     Changzhou                                  Chaohu          Chaoyang
                     Chaozhou                                   Chengde         Chengdu
                     Chenzhou                                   Chifeng         Chizhou
                     Chongqing                                  Chongzuo        Chuzhou
                     Dalian                                     Dandong         Daqin
                     Datong                                     Dazhou          Deyang
                     Dezhou                                     Dingxi          Dongguan
                     Dongying                                   Ezhou           Fangchenggang
                     Foshan                                     Fushun          Fuxin
                     Fuyang                                     Fuzhou          Ganzhou
                     Guang'an                                   Guangyuan       Guangzhou
                     Guigang                                    Guilin          Guiyang
                     Guyuan                                     Haikou          Handan
                     Hangzhou                                   Hanzhong        Harbin

© MarketLine 2019. This product is licensed and is not to be photocopied.                                   25
City Statistics User Guide
Published: March 2019
Hebi Hechi Hefei
Hegang Heihe Hengshui
Hengyang Heyuan Heze
Hezhou Hohhot Hong Kong
Huaian Huaibei Huaihua
Huainan Huanggang Huangshan
Huangshi Huizhou Huludao
Hulunbuir Huzhou Jiamusi
Ji'an Jiaozuo Jiaxing
Jiayuguan Jieyang Jilin
Jinan Jinchang Jincheng
Jingdezhen Jingmen Jingzhou
Jinhua Jining Jinzhong
Jinzhou Jiujiang Jiuquan
Jixi Kaifeng Kunming
Laibin Langfang Lanzhou
Leshan Lhasa Lianyungang
Liaocheng Liaoyuan Lijiang
Lincang Linfen Linyi
Lishui Liupanshui Longyan
Loudi Lu'an Luohe
Luoyang Luzhou Lyuliang
Maanshan Maoming Meishan
Meizhou Mianyang Mudanjiang
Nanchang Nanchong Nanjing
Nanning Nanping Nantong
Nanyang Neijiang Ningbo
Ningde Panjin Panzhihua
Pingdingshan Pingliang Pingxiang
Putian Puyang Qingdao
Qingyuan Qinhuangdao Qinyang
Qinzhou Qiqihar Qitaihe
Quanzhou Qujing Quzhou
Rizhao Sanmenxia Sanming
Sanya Shanghai Shangluo
Shangqiu Shantou Shanwei
Shaoguan Shaoxing Shaoyang
Shenyang Shenzhen Shijiazhuang
Shiyan Shizuishan Shuangyashan
Shuozhou Simao Siping
Songyuan Suihua Suining
Suizhou Suqian Suzhou
Tai'an Taiyuan Taizhou
Tangshan Tianjin Tianshui
Tieling Tongchuan Tonghua
Tongliao Tongling Urumqi
Weifang Weihai Weinan
Wenzhou Wuhai Wuhan
Wuhu Wulanchabu Wuwei
Wuxi Wuzhong Wuzhou
Xiamen Xi'an Xiangfan
Xiangtan Xianning Xianyang
Xiaogan Xingtai Xining
© MarketLine 2019. This product is licensed and is not to be photocopied. 26City Statistics User Guide
Published: March 2019
Xinxiang Xinyang Xinyu
Xinzhou Xuancheng Xuchang
Xuzhou Yanan Yancheng
Yangjiang Yangquan Yangzhou
Yantai Yibin Yichang
Yichun (Heilongjiang) Yichun (Jiangxi) Yinchuan
Yingkou Yingtan Yiyang
Yongzhou Yueyang Yulin (Guangxi)
Yulin (Shanxi) Yuncheng Yunfu
Yuxi Zaozhuang Zhangjiajie
Zhangjiakou Zhangye Zhangzhou
Zhanjiang Zhaoqin Zhaotong
Zhengjiang Zhengzhou Zhongshan
Zhongwei Zhoukou Zhoushan
Zhuhai Zhumadian Zhuzhou
Zibo Zigong Ziyang
Indonesia
Ambon Balikpapan Bandar Lampung
Bandung Banjarmasin Bekasi
Bengkulu Binjai Bogor
Cilegon Cimahi Cirebon
Denpasar Dumai Jakarta
Jambi Jayapura Jember
Kediri Kendari Kupang
Malang Manado Mataram
Medan Palembang Palu
Pekalongan Pekan Baru Pematang Siantar
Pontianak Probolinggo Samarinda
Semarang Serang Sukabumi
Surabaya Surakarta Tangerang
Tasikmalaya Tegal Yogyakarta
Japan
Anjo Fukuoka Fukuyama
Hamamatsu Himeji Hiroshima
Kagoshima Kanazawa Kitakyushu
Kochi Kofu Kumamoto
Kurashiki Maebashi Matsuyama
Mito Nagano Nagasaki
Nagoya Naha Niigata
Numazu Oita Okayama
Osaka Sapporo Sendai
Shizuoka Takamatsu Tokushima
Tokyo Toyama Toyohashi
Utsunomiya Wakayama Yokkaichi
Laos
Vientiane
© MarketLine 2019. This product is licensed and is not to be photocopied. 27City Statistics User Guide
Published: March 2019
Malaysia
Alor Setar Ipoh Johor Bahru
Kajang Kangar Kota Bharu
Kota Kinabalu Kuala Lumpur Kuala Terengganu
Kuantan Kuching Malacca
Miri Penang Seremban
Mongolia
Arvaikheer Bayankhongor Bayan-Olgii
Bulgan Choibalsan Choir-Sumber
Dalanzadgad Darkhan Erdenet
Govi-Altai-Yesonbulag Khovd-Jargalant Mandalgovi-Saintsagaan
Moron Ondorkhaan-Kherlen Sainshand
Selenge-Sukhbaatar Sukhbaatar-Baruun-Urt Tsetserleg
Ulaanbaatar Uvs-Ulaangom Zavkhan-Uliastai
Zuunmod
Myanmar (Burma)
Nay Pyi Taw
New Zealand
Auckland Christchurch Dunedin
Gisborne Greymouth Hamilton
Hastings Invercargill Nelson
New Plymouth Tauranga Wanganui
Wellington Whangarei
Papua New Guinea
Port Moresby
Philippines
Angeles Bacolod Baguio
Batangas Cagayan de oro Calamba
Cebu Dagupan Davao
General Santos Iloilo-Guimaras Manila
Naga Olongapo Zamboanga
Singapore
Singapore
South Korea
Busan Changwon Cheonan
Cheongju Chuncheon Daegu
Daejeon Gwangju Incheon
Jeju Jeonju Pohang
Seoul Suwon Ulsan
Yeosu
Taiwan
Taipei
© MarketLine 2019. This product is licensed and is not to be photocopied. 28City Statistics User Guide
Published: March 2019
Thailand
Amnat Charoen Ang Thong Bangkok
Buri Ram Cha-am Chachoengsao
Chai Nat Chaiyaphum Chanthaburi
Chaophraya Surasak Chiang Mai Chiang Rai
Chumpon Hat Yai Hua Hin
Kalasin Kamphaeng Phet Kanchanaburi
Khao Sam Yot Krabi Lampang
Lamphun Loei Mae Hong Son
Mae Sot Maha Sarakham Mukdahan
Nakhon Nayok Nakhon Pathom Nakhon Phanom
Nakhon Ratchasima Nakhon Sawan Nakhon Si Thammarat
Nan Narathiwat Nong Bua Lam Phu
Nong Khai Nonthaburi Pattani
Pattaya Phangnga Phayao
Phetchabun Phichit Phitsanulok
Phra Nakhon Si Ayutthaya Phrae Phuket
Prachin Buri Rangsit Ranong
Ratchaburi Rayong Roi Et
Sa Kaeo Sakhon Nakhon Samut Prakhan
Samut Sakhon Samut Songkhram Saraburi
Satun Sawankhalok Si Sa Ket
Sila Sing Buri Suphan Buri
Surat Thani Surin Trang
Trat Ubon Ratchathani Udon Thani
Uthai Thani Uttradit Yala
Yasothon
Vietnam
Hanoi
9.2.2. EUROPE & CENTRAL ASIA
Albania
Tirana
Armenia
Yerevan
Austria
Graz Innsbruck Linz
Salzburg Vienna
Azerbaijan
Baku City
Belarus
Brest Gomel Grodno
Minsk Mogilev Vitebsk
© MarketLine 2019. This product is licensed and is not to be photocopied. 29City Statistics User Guide
Published: March 2019
Belgium
Antwerp Brussels Charleroi
Ghent Liege
Bosnia and Herzegovina
Sarajevo
Bulgaria
Burgas Plovdiv Sofia
Varna
Croatia
Split Zagreb
Cyprus
Lefkosia/Nicosia
Czech Republic
Brno Ostrava Plzen
Prague
Denmark
Aalborg Aarhus Copenhagen
Odense
Estonia
Tallinn
Finland
Helsinki Tampere Turku
France
Amiens Angers Avignon
Besancon Bordeaux Brest
Caen Clermont-Ferrand Dijon
Grenoble Le Mans Lens
Lille Limoges Lyon
Marseille Metz Montpellier
Mulhouse Nancy Nantes
Nice Nimes Orleans
Paris Pau Perpignan
Poitiers Reims Rennes
Rouen Saint-Etienne Strasbourg
Toulon Toulouse Tours
Georgia
Tbilisi
© MarketLine 2019. This product is licensed and is not to be photocopied. 30City Statistics User Guide
Published: March 2019
Germany
Aachen Aschaffenburg Augsburg
Bayreuth Berlin Bielefeld
Bonn Braunschweig Braunschweig-Salzgitter-
Wolfsburg
Bremen Bremerhaven Chemnitz
Cologne Cottbus Darmstadt
Dortmund Dresden Dusseldorf
Erfurt Essen Flensburg
Frankfurt Freiburg im Breisgau Giessen
Gorlitz Gottingen Halle an der Saale
Hamburg Hanover Heidelberg
Heilbronn Hildesheim Ingolstadt
Iserlohn Kaiserslautern Karlsruhe
Kassel Kiel Koblenz
Konstanz Leipzig Lubeck
Magdeburg Mainz Mannheim
Mannheim-Ludwigshafen Marburg Monchengladbach
Munich Munster Neubrandenburg
Nuremberg Offenburg Oldenburg
Osnabruck Paderborn Pforzheim
Plauen Regensburg Reutlingen
Rosenheim Rostock Ruhrgebiet
Saarbrucken Schweinfurt Schwerin
Siegen Stuttgart Ulm
Wetzlar Wiesbaden Wolfsburg
Wuppertal Wurzburg Zwickau
Greece
Athens Thessaloniki
Hungary
Budapest Debrecen Miskolc
Pecs Szekesfehervar
Iceland
Reykjavik
Ireland
Cork Dublin
Italy
Bari Bergamo Bologna
Brescia Cagliari Caserta
Catania Florence Genoa
Latina Messina Milan
Modena Naples Padua
Palermo Parma Pescara
Prato Reggio nell Emilia Rome
Salerno Taranto Turin
Venice Verona Vicenza
© MarketLine 2019. This product is licensed and is not to be photocopied. 31City Statistics User Guide
Published: March 2019
Kazakhstan
Almaty City Astana
Kyrgyzstan
Bishkek
Latvia
Riga
Lithuania
Kaunas Vilnius
Macedonia
Skopje
Netherlands
Amsterdam Arnhem Breda
Den Bosch Eindhoven Enschede
Groningen The Hague Heerlen
Leiden Rotterdam Tilburg
Utrecht
Norway
Bergen Oslo Stavanger
Poland
Bialystok Bielsko-Biala Bydgoszcz
Czestochowa Gdansk Kalisz
Katowice Kielce Krakow
Lodz Lublin Olsztyn
Opole Poznan Radom
Rzeszow Szczecin Tarnow
Walbrzych Warsaw Wloclawek
Wroclaw
Portugal
Coimbra Lisbon Porto
Republic of Moldova
Chisinau
Romania
Brasov Bucharest Cluj-Napoca
Constanta Craiova Galati
Iasi Timisoara
Russia
Abakan Arkhangelsk Astrakhan
Barnaul Belgorod Blagoveshchensk
Bryansk Cheboksary Chelyabinsk
Cherkessk Chita Elista
Grozny Irkutsk Ivanovo
© MarketLine 2019. This product is licensed and is not to be photocopied. 32City Statistics User Guide
Published: March 2019
Izhevsk Kaliningrad Kaluga
Kazan Kemerovo Khabarovsk
Kirov Kostroma Krasnodar
Krasnoyarsk Kurgan Kursk
Kyzyl Lipetsk Maikop
Makhachkala Moscow Murmansk
Nalchik Nazran Nizhny Novgorod
Novosibirsk Noyabrsk Omsk
Orel Orenburg Penza
Perm Petropavlovsk-Kamchatsky Petrozavodsk
Pskov Rostov-on-Don Ryazan
Saint Petersburg Samara Saransk
Saratov Smolensk Stavropol
Surgut Syktyvkar Tambov
Tomsk Tula Tver
Tyumen Ufa Ulan-Ude
Ulyanovsk Veliky Novgorod Vladikavkaz
Vladimir Vladivostok Volgograd
Vologda Voronezh Yakutsk
Yaroslavl Yekaterinburg Yoshkar-Ola
Yuzhno-Sakhalinsk
Serbia
Belgrade
Slovakia
Bratislava Kosice
Slovenia
Ljubljana Maribor
Spain
A Coruna Alicante Barcelona
Bilbao Cadiz Cordoba
Donostia-San Sebastian Granada Las Palmas
Madrid Malaga Murcia
Oviedo Palma de Mallorca Pamplona
Santa Cruz de Tenerife Santander Seville
Valencia Valladolid Vigo
Vitoria Zaragoza
Sweden
Gothenburg Malmo Stockholm
Uppsala
Switzerland
Basel Berne Geneva
Lausanne Zurich
Tajikistan
Dushanbe
© MarketLine 2019. This product is licensed and is not to be photocopied. 33City Statistics User Guide
Published: March 2019
Turkey
Adana Adiyaman Afyon
Agri Aksaray Amasya
Ankara Antalya Ardahan
Artvin Aydin Balikesir
Bartin Batman Bayburt
Bilecik Bingol Bitlis
Bolu Burdur Bursa
Canakkale Cankiri Corum
Denizli Diyarbakir Duzce
Edirne Elazig Erzincan
Erzurum Eskisehir Gaziantep
Giresun Gumushane Hakkari
Hatay Igdir Isparta
Istanbul Izmir Kahramanmaras
Karabuk Karamana Kars
Kastamonu Kayseri Kilis
Kirikkale Kirklareli Kirsehir
Kocaeli Konya Kutahya
Malatya Manisa Mardin
Mersin Mugla Mus
Nevsehir Nigde Ordu
Osmaniye Rize Sakarya
Samsun Sanliurfa Siirt
Sinop Sirnak Sivas
Tekirdag Tokat Trabzon
Tunceli Usak Van
Yalova Yozgat Zonguldak
Ukraine
Cherkasy Chernihiv Chernivtsi
Dnipropetrovsk Donetsk Ivano-Frankivsk
Kharkiv Kherson Khmelnytskyi
Kirovohrad Kyiv Luhansk
Lutsk Lviv Mykolaiv
Odesa Poltava Rivne
Sevastopol Simferopol Sumy
Ternopil Uzhhorod Vinnytsia
Zaporizhia Zhytomyr
United Kingdom
Aberdeen Belfast Birmingham
Blackburn Bournemouth Bradford
Brighton and Hove Bristol Cambridge
Cardiff Cheshire West and Chester Coventry
Derby Doncaster Edinburgh
Exeter Glasgow Ipswich
Kingston upon Hull Kirklees Leeds
Leicester Liverpool London
Luton Manchester Medway
Middlesbrough Newcastle upon Tyne Northampton
Norwich Nottingham Plymouth
© MarketLine 2019. This product is licensed and is not to be photocopied. 34City Statistics User Guide
Published: March 2019
Portsmouth Reading Sheffield
Southampton Stockton-on-Tees Stoke-on-Trent
Sunderland Swansea Swindon
West Midlands urban area Worcester Wrexham
Uzbekistan
Tashkent
9.2.3. LATIN AMERICA & CARIBBEAN
Argentina
Buenos Aires Chubut-Rawson Cordoba
Corrientes Entre Rios-Parana La Pampa-Santa Rosa
La Rioja Mendoza Rosario
Salta San Luis Tucuman
Bahamas
Nassau
Bolivia
Cobija Cochabamba La Paz
Oruro Potosi Santa Cruz
Sucre Tarija Trinidad
Brazil
Americana Ananindeua Anchieta
Angra dos Reis Anapolis Aparecida de Goiania
Aracaju AraCatuba Araraquara
Araucaria Barcarena Barueri
Bauru Belem Belford Roxo
Belo Horizonte Blumenau Boa Vista
Brasilia Cabo de Santo gostinho Cabo Frio
Cachoeirinha Cajamar Camaçari
Campina Grande Campinas Campo Grande
Campos dos Goytacazes Candeias Canoas
Carapicuiba Cariacica Cascavel
Catalao Caxias do Sul Chapeco
Corumba Cotia Criciuma
Cubatao Cuiaba Curitiba
Diadema Dourados Duque de Caxias
Embu das Artes Feira de Santana Florianopolis
Fortaleza Foz do Iguacu Franca
Goiania Gravatai Guaruja
Guarulhos Hortolandia Indaiatuba
Ipojuca Itaguai Itajai
Itapecerica da Serra Itapevi Itaquaquecetuba
Itu Jaboatao dos Guararapes Jacarei
Jaragua do Sul Joao Pessoa Joinville
Jundiai Limeira Linhares
Londrina Louveira Macae
Macapa Maceio Manaus
© MarketLine 2019. This product is licensed and is not to be photocopied. 35You can also read