Saving Water: From Field to Fork - Curbing Losses and Wastage in the Food Chain
←
→
Page content transcription
If your browser does not render page correctly, please read the page content below
Saving Water:
A policy brief for central governments in devel-
oped and developing countries, sub-sovereign
national bodies, universities and research
institutes, community organisations, banks
and private investors, aid donors, multilateral    From Field to Fork
financial institutions, UN agencies and other
international organisations.
                                                   Curbing Losses and Wastage in the Food Chain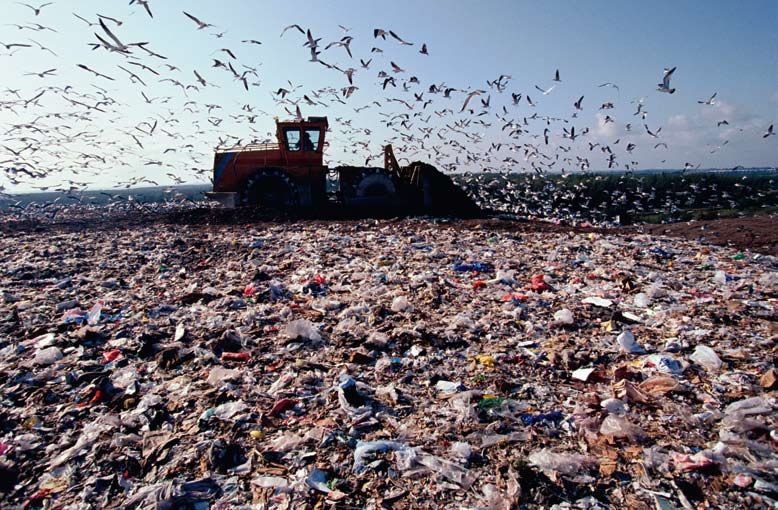
Photo: Andrew Clayton, SXC

    How to Cite
    Lundqvist, J., C. de Fraiture and D. Molden. Saving Water: From Field to Fork – Curbing Losses and Wastage in the
    Food Chain. SIWI Policy Brief. SIWI, 2008.

    Copyright © 2008, Stockholm International Water Institute (SIWI)
    Design and production by Britt-Louise Andersson, SIWI. Cover photos: Jose Assenco and Getty Images.

              Printed by Litografia, Huddinge, Sweden. The printing process has been certified according to the Nordic Swan
              label for environmental quality. For electronic versions of this and other SIWI publications, visit www.siwi.org.

    SIWI Policy Brief: Saving Water: From Field to Fork

2
Note to the Reader:

This report and the Side Event at CSD 16, May 5–16, 2008,                              University, Stockholm Environmental Institute and Stockholm
are following up reports that have been prepared for two                               International Water Institute.
previous CSD meetings, “Water – More Nutrition per Drop”                                  Lead authors: Jan Lundqvist, Stockholm International Water
(2004*) and “Let it Reign: The New Water Paradigm for                                  Institute; Charlotte de Fraiture, International Water Manage-
Global Food Security” (2005**). The topics addressed in the                            ment Institute and David Molden, International Water Manage-
previous reports, and also in this report, are the links between                       ment Institute. Contributing authors: Göran Berndes, Chalmers
water, food and development, which are high on the agenda                              University of Technology, Sweden; Anders Berntell, Stockholm
for Swedish international development collaboration. This                              International Water Institute; Malin Falkenmark, Stockholm
report highlights the magnitude of losses and wastage in the                           International Water Institute; Hans Holmen, Linköping Uni-
food chain, i.e. from field to fork. It is shown that a reduc-                         versity; Louise Karlberg, Stockholm Environment Institute and
tion of losses and wastage would save water and facilitate the                         Mats Lannerstad, Linköping University.
achievement of multiple development objectives.                                           Generous financial support for preparing this report and for
   The views put forward in this report are expressed solely on                        participation in the CSD 16 meeting has been provided by Swedish
behalf of International Water Management Institute, Chalmers                           International Development Cooperation Agency (Sida).

Table of Contents

Executive Summary                                                                                                                                        4
   Food Wastage is Water Wastage                                                                                                                         4
   A New Era for Water and Food Management                                                                                                               5
   Key Issues for Policy Debate                                                                                                                          6
   A Strategy for Action                                                                                                                                 7
1. Drivers of Food Demand                                                                                                                                8
   1.1 Water Costs of Past Achievements                                                                                                                  8
   1.2 Income Improvements and Changing Diets                                                                                                            8
   1.3 Diets and Water                                                                                                                                  11
2. A New Type of Water Scarcity                                                                                                                         13
   2.1 Climate Change Amplifies Water Scarcity                                                                                                          13
   2.2 Variability in Water More Pronounced                                                                                                             14
   2.3 Water Scarcity: Competition and Environmental Concerns                                                                                           15
   2.4 Land and Water for Bioenergy and other Non-food Produce                                                                                          15
   2.5 Under Nourishment and Over Eating: Changing Perspectives on Food Security                                                                        18
3. Taking a Food Chain Perspective: From Field to Fork                                                                                                  20
   3.1 Stages and Actors in the Food Chain                                                                                                              20
   3.2 Losses, Spoilage, Conversions and Wastage                                                                                                        22
   3.3 Significant Losses and Spoilage in Less Developing Countries                                                                                     23
   3.4 High Rates of Losses and Wastage in Developed Societies                                                                                          24
   3.5 Implications and Dimensions of Losses and Wastage of Food                                                                                        26
4. The Smart Approach to Water Saving                                                                                                                   27
   4.1 The Need to Act on a Broad Scale                                                                                                                 27
   4.2 More Food with Less Water: Reducing Unproductive Losses of Rainwater                                                                             27
   4.3 Water Savings Potential Throughout the Food Chain                                                                                                30
   4.4 Involve Stakeholders                                                                                                                             31
5. Conclusion                                                                                                                                           32
References                                                                                                                                              33

* http://www.siwi.org/documents/Resources/Policy_Briefs/CSD_More_nutrition_per_drop_2004.pdf
** http://www.siwi.org/documents/Resources/Policy_Briefs/CSD_Let_it_Reign_2005.pdf

                                                                                                       SIWI Policy Brief: Saving Water: From Field to Fork

                                                                                                                                                              3
Photo: Getty Images
    Executive Summary
    Food Wastage is Water Wastage
    We need to use our water prudently – no one will argue with              Making the food chain more efficient means saving water
    this statement. But in fact we are wasteful. This need will          that would have been used to produce that food. More than
    become more pronounced, and the cost of bad water man-               that, a reduction of losses and wastage can serve the interests
    agement will get higher in the future with increasing water          of farmers, consumers and society at large.
    demands from increasing population, cities, agriculture, and             The amount of food produced on farmers’ fields is much
    the environment. Moreover water management will become               more than is necessary for a healthy, productive and active
    more difficult with climate change. New solutions and fast           life for the global population. Clearly, distribution of food is
    actions are required now.                                            a problem – many are hungry, while at the same time many
       Agriculture is the largest human use of water. Clearly, agri-     over eat. A hidden problem is that farmers have to supply
    cultural practices need to be targeted to reduce wastage of water.   food to take care of both our necessary consumption and
    This has been the center of attention for water saving practices     our wasteful habits. This problem can be turned into an op-
    for years. But there are additional ways to save water.              portunity. Targeting losses and wasteful habits may generate
       Food consumers and businesses have a key role. Losses of          multiple gains, including the saving of water. In addition to
    food between the farmers’ field to our dinner table – in food        saving water by a reduction of losses and wastage in the food
    storage, transport, food processing, retail and in our kitchens      chain, agricultural water management practices could be
    – are huge. This loss of food is equivalent to a loss in water.      much more productive.
    Reducing food loss and wastage lessens water needs in agri-              As indicated in Figure 1, losses and wastage may be in
    culture. We need to pay more attention to this fact.                 the order of 50 percent between field and fork. Inefficient
                                                                         harvesting, transport, storage and packaging make a consider-
    Our Key Message: Make the Food Chain More Efficient to Save          able dent in the potential availability of food. Additional and
    Water to Facilitate the Achievement of Multiple Development          significant losses and wastage occur in food processing, whole
    Objectives                                                           sale, retail and in households and other parts of society where

     SIWI Policy Brief: Saving Water: From Field to Fork

4
food is consumed. The estimate is dependent upon how the                 from field to fork can facilitate the achievement of multiple de-
conversion of food in terms of grains used for feed to produce           velopment objectives: food security, improvement of livelihoods
animal foods is interpreted.                                             of farmers, meet the growing demand for non-food agricultural
   It is important to recognise that agricultural products that          products and safeguarding environmental resilience.
are harvested but that do not reach our dinner plates are not
necessarily wasted. Agricultural produce and residues are used           A New Era for Water and Food
for various purposes at farm level or within the agricultural
system – for feed, bioenergy and soil amelioration. This is
                                                                         Management
a typical situation among small holder agriculturalists in               Warnings about severe water scarcity come at the dawn of a
developing countries.                                                    new era for agriculture. For an increasingly affluent world
   Situations differ from industrialised countries to those with         population the demand for a range of agricultural products
weak economies and a strong agricultural base, and between               is rapidly increasing, while the poor have to bear the brunt of
rich and poor producers and consumers. Generally, the losses             price hikes and lack of access to food and water supplies. An
in the first part of the food chain, which result of poor har-           estimated 1.4 billion people already live in areas where there
vesting technologies, lack of transport and poor storage in              is not enough water available to meet all needs from sectors
combination with climatic circumstances, are relatively more             of society, let alone the need of aquatic ecosystems.
important in developing countries. In industrialised countries,              Over the past 50 years, food supply has increased more
where a high percentage of the population live in urban centres,         rapidly than populations have, and under nourishment, a
wastage is quite high. Trends in diet composition, towards a             lingering threat throughout history, has been reduced. Until
higher fraction of animal food items, fruits and vegetables              very recently, the real price of food has been fairly stable or
tend to shorten the durability of food and could increase the            declined, benefiting both national and household economies
risk of losses and wastage.                                              although it has been detrimental to farmers. The situation
   In fact, the entire picture is complex, and the knowledge to          now is characterised by rapidly increasing prices on food with
guide policy pertaining to various parts of the food chain needs         dramatic repercussions for the poor, rates of inflation and,
to be improved. However, there is enough evidence that the               generally, for the stability of society.
magnitude of food and water losses are large enough and that we              Several coinciding circumstances contribute to this quite
must pay close attention. Strategies that focus on reducing losses       serious situation, which may increase the number of people

                       Edible crop harvest: + 4,600
               5000

                                      Postharvest losses: - 600

               4000
kcal/cap/day

                                                  Animal feed: - 1,700

               3000
                              2800
                                                                                 Losses and waste in distribution
                                                              Meat and           and households: - 800
                                                              dairy: + 500
               2000

                                                                                                    Net availability for
               1000                                                                                 consumption: + 2000

                      Field                                                                             Fork

Figure 1. A schematical summary of the amount of food produced, globally, at field level and estimates of the losses, conversions
and wastage in the food chain. Source: Smil (2000). Illustration: Britt-Louise Andersson, SIWI.

                                                                                         SIWI Policy Brief: Saving Water: From Field to Fork

                                                                                                                                               5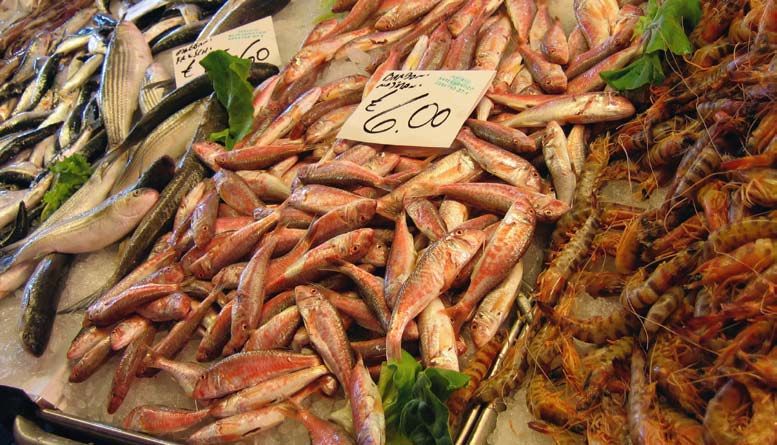
Photo: Mats Lannerstad
    who are under nourished. Faced with this threat and with the            All of these changes have implications on water resources.
    escalating water scarcity and increased competition for land         More food is likely to come at a cost of more water use in
    and water resources for a range of uses, increases in water          agriculture. Further, distance to market, and a more com-
    productivity are necessary especially in areas where produc-         plicated food chain and changes in composition and variety
    tion and productivity are low and where there is a need for          of food supply, open the possibility of more food and water
    more food and improved livelihood for the producers. But             wastage. Water will be a key constraint to food security, unless
    it also makes sense to ensure that as much as possible of the        we change the way we think and act about the whole chain,
    food produced is accessible for consumption across social            from production to consumption.
    groups of society.
        Access to food is very much conditioned by socioeconomic         Key Issues for Policy Debate
    circumstances in society. Under nourishment is largely per-
    petuated by poverty and conflict. However, with losses and           Support to Farmers
    wastage in different stages of the food chain, the overall food      Actions are needed to support farmers, especially small farm-
    security in society is compromised One reason for losses in          ers, to curb losses of water and food and to facilitate that
    the food chain is an increasing distance between the places          their produce meets the growing demands for food as well as
    where food is produced and where it is consumed. Whereas in          other agricultural commodities. Growing expectations on the
    the past, many people produced their own food, now various           agricultural sector is an opportunity that needs to be properly
    parts of our meal come from food grown in many places in             harnessed through:
    the world. Parallel and closely associated with this trend, is       • Improved seeds, harvesting technologies, better trans-
    the involvement of a growing number of actors and interests             port and storage.
    along the food chain. Apart from farmers, transporters, store        • Innovative ways to capture and beneficially use the rain
    keepers, food processing industry, shopkeepers, supermarkets,           falling on farmers’ fields to increase the fraction of the
    among others, are involved. We therefore need to look at the            rains that can be productively used and to lessen stresses
    stakeholders and drivers in various segments of the food chain          on rivers and groundwater. With current practices and
    and to what extent interests either coincide or are at odds across      strategies, a large fraction of the rainfall is lost in terms
    major groups. Enhancing efficiency in one part of the chain,            of unproductive evaporation in many parts of the world.
    e.g. in production, can be nullified if losses and wastage occur,    • Financial and institutional arrangements to realise pro-
    or increase, in other parts of the chain.                               ductivity improvements.

     SIWI Policy Brief: Saving Water: From Field to Fork

6
• Co-management of land and water management, prefer-             Basic Data and Information
                               ably in a basin context is much needed. In many cases,          We lack factual information about different types, size and
                               government institutions do not integrate these two sectors.     implications of losses and wastage of food. An important step
                                                                                               is therefore to improve knowledge:
                             Food Processing and Supply                                        • International organisations, businesses and agencies
                             The business community should take action to minimise water           for research at national and international levels should
                             wastage through reducing food wastage in their processing             initiate studies that will reveal the different types and
                             and transport:                                                        magnitude of losses and wastage in the food chain in
                             • Benchmarking standards should be set by industry to                 different parts of the world, and identify steps that can
                               indicate water use, including water use in the entire food          be taken to minimise these.
                               chain, not just in their factory.                               • Quantify information on the costs of losses and wastage
                             • The business community should take action to minimise               as well as what are the benefits and who will benefit with
                               water wastage through food wastage in their processing              a reduction in losses and wastage. Costs and benefits
                               and transport systems.                                              should be estimated in monetary terms but also in terms
                             • Businesses can raise publicity about their water use, and           of water savings, environmental aspects and other suit-
                               the need to save water.                                             able parameters.

                             Sensitise Consumers                                               A Strategy for Action
                             Raise awareness amongst consumers about the water implications
                             of their diets, overeating and food wastage. We as consumers      Governments, international organisations and NGOs have
                             need to be careful about food wastage in our homes. Over eating   major roles to play to drive the policy agenda and its im-
                             and throwing food away is like leaving the tap running:           plementation. Following the call from World Economic
                             • Raise awareness amongst consumers about the water               Forum in January 2008 , it is appropriate that the resources
                                implications of their diets, overeating, and food wastage.     represented by the businesses are part of a coordinated action.
                             • Incentives and practical guidance and well designed             A suitable next step is the forming of a broad collaboration
                                campaigns may be required to reduce food wastage in            across the business community and between the research
                                our homes and how to combine home economics with               community, the private sectors, NGOs, civil society and
                                sound food habits. Concrete examples of how to avoid or        government.
                                reduce the throwing away of food need to be used.                 A consortium of policy makers, representatives from indus-
                             • Explore the opportunities to include information of             try, academia and civil society could lead the way to design
                                losses and wastage as part of a labelling system or as         effective, acceptable and practical actions to reduce losses and
                                information on strategic consumer food items.                  wastage by half by 2025.
Photo: Jan Lundqvist, SIWI

                                                                                                               SIWI Policy Brief: Saving Water: From Field to Fork

                                                                                                                                                                     7
Photo: Michael Moore, SIWI
    1. Drivers of Food Demand

    1.1 Water Costs of Past Achievements                                                           been fully allocated, or even over-allocated (Falkenmark and
                                                                                                   Molden, 2008). But demand and competition for water con-
    Remarkable improvements in food security have been one of                                      tinues to increase unabated, and concerns are being heard
    the most positive characteristics of development in large parts                                from key people and organisations, including from the UN
    of the world over the last half a century. At the dawn of the                                  Secretary-General and representatives of industry.1
    Green Revolution, at the beginning of the 1960s, the average
    global crop yield was about 1.4 tonnes/hectare. Thirty years                                   1.2 Income Improvements and
    later, in the mid-1990s, it had doubled to about 2.8 tonnes/
    hectare (Molden et al, 2007 a). In the mid-1960s, total global
                                                                                                   Changing Diets
    cereal production was about 0.9 billion tonnes, and in 1995                                    Poverty reduction remains the number one development goal.
    about 1.7 billion tonnes. The 2 billion tonne mark was passed                                  Economic development promotes poverty reduction and the
    in 2004, when total cereal production was estimated at 2254.9                                  prospects for this today are very bright. In the year 2000, 800
    million tonnes (FAO, 2005).                                                                    million people lived in regions with a mean annual GDP per
        Largely as a result of these developments, the number of un-                               capita above USD 10,000. Economic growth projections based
    der nourished people in the world has been reduced, in relative                                on so called demographic dividend projections, where economic
    and absolute terms, although there are signs of setbacks (FAO,                                 behaviour is linked to age composition, foresee about 7 billion
    2006; von Braun, 2007). One reason for a slight increase in food                               people, or about 80 percent of the world’s population, living
    insecurity recently is persistent and extreme poverty in com-                                  in such regions by 2050 (Malmberg, 2007; Lind & Malmberg,
    bination with conflicts notably in parts of sub-Saharan Africa                                 2007). If the envisaged massive economic growth will unfold,
    (Ahmed et al., 2007, cited in von Braun, 2007). Food insecurity                                a significant reduction of poverty is possible. It will make
    and hunger is, however, also experienced in rich countries.                                    considerable public and private investments in infrastructure,
        Achievements in terms of an augmented food production                                      research and human development conceivable. It is an oppor-
    have come at a cost. Increased pressure on freshwater resources,                               tunity to build a better future for broad groups of people. A
    due in large part to the rapid expansion of irrigation systems,                                vital question, however, here is how can the associated growth
    has had repercussions on aquatic ecosystems (Falkenmark, et                                    in demand be met and still reconciled with the concomitant
    al., 2007) and for people in downstream areas. River basins                                    increased pressure on natural resources and the environment
    around the world are closing, that is, there is no more water                                  during the coming decades? And how will the poor, who may
    for additional water allocations, because water has already                                    still be counted in hundreds of millions, be faring in a context

    1
      Water scarcity was a major issue at the World Economic Forum, Davos, January 2008, with no less than nine events addressing various consequences of worsening water stress. UN
    Secretary-General, Mr Ban Ki-moon, told the meeting: “What we did for climate change last year, we want to do for water and development this year” Andrew Edgecliffe-Johnson, Financial
    Times, 25 January 2008 http://r.smartbrief.com/resp/jCoccSoRcsixtWCiaKqZvlHE?format=standard

      SIWI Policy Brief: Saving Water: From Field to Fork

8
of increasing resource pressure and competition? Experience              With rising incomes and urbanisation, demand for food
tells us that even at higher levels of income and consumption,       will increase. Furthermore, consumers’ tastes are changing
people tend to want more, knowingly or unknowingly about the         towards more nutritious and more diversified diets, which tend
implications for natural resources and the environment. Apart        to boost the consumptive use of water. A shift in consumption
from poverty alleviation, sustainable lifestyles are increasingly    patterns among cereal crops and away from cereals toward
an issue. Changes in diets towards an increasing demand for          animal products and high-value crops can be anticipated (CA ,
meat and seafood is one of the vital issues in such discussions      2007) For example, in South East Asia rice supply peaked at
(Jackson, 2008, Halweil and Nierenberg, 2008).                       around 120 kg/capita/year during the 1980s while per capita
    Even if rates of poverty are reduced, a very large segment of    wheat demand more than tripled between 1961 and 2002 and
the world’s population is still poor or extremely poor. Recent       is still increasing. Meat demand grew by a factor of 7, from 6
price hikes on food is a most serious change for them. For the       to 40 kg/capita/year. Demand for high-value crops – such as
billion plus of people who are forced to survive on the equivalent   fruit, sugar and edible oils – also increased substantially and
of an average per capita income of a dollar per day, a very large    projected increases in demand vary from 70 percent to over
part of their disposable money and resources are spent on food       100 percent (Fraiture et al., 2007).
and other basic necessities of life. For them, even comparatively        Changes in food habits as incomes rise are illustrated
small increases in the price of food are causing extreme hardship.   in Figure 2 . The general trend is in favor of more nutri-
On the other hand, a growing middle class in various parts of        tious and more diversified diets with a higher proportion
the world contribute to increasing the demand for a range of         of animal products and high-value crops and away from
goods, including food and other agricultural products. Prices        “traditional” cereals, e.g. various varieties of sorghum. There
of commodities are naturally affected and what food items are        are pronounced regional and cultural differences. While
produced. People who are well off are comparatively less affected    changes in diets as a result of income growth follow similar
by price hikes on food. To avoid widespread social unrest and        patterns, regional and cultural differences are pronounced –
negative repercussions on inflation and the economy it is vital      and may remain so for some time (Lundqvist et al., 2007).
for Governments and international organisations to consider          For example, meat demand in (mostly vegetarian) India
the interests and concern of the population as a whole. At the       rose much slower than in China, for comparable income
recent National People’s Congress in Beijing, Premier Wen            increases, but demand for milk products increased more
Jiabao promised that the government would boost production           rapidly (Figure 2). Per capita supply of meat in India seems
of daily necessities such as grain, vegetable oil and meat and/      to remain relatively low, projected at 15 kg/capita/year by
or increase imports of consumer products that are in short sup-      2050, while China is projected to supply six times more.
ply (Wang 2008), with the twin objective to reduce threats of        China’s meat demand is projected to be 83 kg/capita/year
inflation and dam up against social grievances.                      by 2050 (de Fraiture et al., 2007).

                                                                                                                                  China

                                                                                                                                  India
                                                                                                                                  USA

Figure 2. Trends in meat and milk demands and GDP per capita in China, India and the USA (1961–2000). Source: GDP data from World
Bank WDI online; consumption data from FAOSTAT.

                                                                                    SIWI Policy Brief: Saving Water: From Field to Fork

                                                                                                                                          9
Cereal demand projections are in the range of 2,800–3,200                                          a large part of the livestock is typically fed on crop residues,
     million tonnes by 2050, an increase of 55–80 percent compared                                         grazing lands and by-products from local sources, with less
     with today. Much of the future increase will be fed to animals                                        than 10 percent of grain supply is used for feed. This kind
     to satisfy the demand for meat (Fraiture et al., 2007). Today                                         of integration between the cropping system and animal rear-
     some 650 million tonnes of grain – nearly 40 percent of global                                        ing, which is a characteristic feature in many small holder
     production – is fed to livestock, and this may reach 1100 mil-                                        systems, contributes to diversity of social and natural resource
     lion tonnes by 2050.                                                                                  use systems and can therefore be benign both with regards
        Although general trends toward more diversified and meat-                                          to resilience and efficiency. These kinds of aspects must be
     based diets are well documented (e.g. Molden et al, 2007                                              considered in discussions of how livestock will be fed in the
     a; Steinfeld et al., 2007), considerable uncertainties remain                                         future (Peden et al, 2007).
     regarding some of the major factors driving future food com-                                              In addition to uncertainties and opportunities on the supply
     position and feed requirements. Projections for world meat                                            side, projections about the drivers of demand, like the growth
     demand are uncertain, varying from 375 to 570 million tonnes                                          in GDP and income vary widely. The four emission scenarios
     by 2050, that is, an increase of 70 –160 percent compared to                                          of the Intergovernmental Panel on Climate Change (IPCC,
     2000 (Fraiture et al., 2007). Environmental concerns and                                              2000), use estimates of GDP growth during the 21st century
     emerging health problems related to obesity may promote                                               that vary from a tenfold to a massive twenty-six-fold increase
     counter trends, particularly in high-income countries. But                                            compared to 2000 – a staggering multiplication in size of
     the problem of overweight and obesity is increasing in other                                          the world economy. Similarly, there is a 2.5 times difference
     parts of the world, too.2 Outbreaks of diseases such as mad                                           between the most optimistic and most pessimistic income
     cow disease and avian flu, together with the industrial nature                                        projections for 2050 in the Millennium Ecosystem Assessment
     of meat production, may deter some people from increasing                                             (2005). On a per capita basis, world real incomes may rise by
     meat consumption.                                                                                     4.5 times by 2050 (Sachs, 2008).
        Much uncertainty surrounds the feed grain requirements                                                 Admitting that the pace and magnitude of economic growth
     per kg of meat, milk and eggs. In many parts of the world                                             cannot be predicted with a high degree of certainty, there is
     there is the potential to increase the efficiency of feed systems                                     still a widespread view that the world economy, including
     (Peden et al, 2007; Wirsenius et al., forthcoming). Livestock are                                     most economies in Asia, Latin America and large parts of
     fed by a combination of grazing, crop residues, and feedstuffs                                        Africa, will continue to expand (Lind and Malmberg, 2007).
     (primarily grains). In OECD countries, where cattle are raised                                        Even if GDP projections are based on purchasing power parity
     largely on feed grains, two-thirds of average grain production is                                     calculations, the future effective demand for food and the mix
     devoted to cattle feed, some of which is imported. In contrast                                        of food items is extremely difficult to assess. It is, however,
     to an industrial character of agriculture that is expanding in                                        plausible that the economic factor is potentially a more forceful
     many parts of the world, in sub-Saharan Africa and South Asia                                         driver than population growth per se.

                                                                                                                                                                                                              Photo: Getty Images

     2
       Reliable statistics are hard to find about the situation and trends of overweight and obesity and their causes. In a newspaper article in 2007, almost 40% of the population of Malaysia are obese
     according to the Health Minister Mr Chua Soi Lek. In an effort to deal with the epidemic, the Government is considering a “sin tax” on junk food in line with the tax on alcohol. International Herald
     Tribune, 16 February 2007. http://www.iht.com/articles/ap/2007/02/17/asia/AS-GEN-Malaysia-Fast-Food-Ban.php

       SIWI Policy Brief: Saving Water: From Field to Fork

10
Photo: Mats Lannerstad
1.3 Diets and Water while for animal-based food, some 4 m3 of water is required
(Falkenmark and Rockström, 2004).
What kind of food is demanded and how much, determine The production of meat from animals fed on irrigated
to a large extent how water for agriculture is allocated and crops has a direct impact on water resources, much more so
used. As elaborated in chapter 3, it is most relevant to also than if the meat is derived from grazing animals and animals
make a distinction between the amount of food demanded fed on residues. Irrigation water, withdrawn from rivers or
and bought, or otherwise acquired, on the one hand, and the other water bodies and returned back to the atmosphere by
amount of food actually eaten, on the other. Food supply crop consumptive use, will not be available for cities, indus-
directly translates into consumptive water use, that is, how try or the environment. As noted above, projections suggest
much water is transpired and evaporated from the field dur- a doubling in the amount of grain used for feed upto 2050
ing the production of a specific amount of food (see Molden from rainfed and irrigated systems. The amount of cereals
et al, 2007b for a discussion). Unlike water use in industry, used today for feed varies between regions, ranging from 20
the high proportion of consumptive use in agriculture means percent in sub-Saharan Africa to 70 percent in OECD countries
that this water is effectively lost for re-use or re-circulation (FAOSTAT, 2000).
in society, that is, until it returns as precipitation. Consump- Food preferences, such as the ratio between plant- and animal-
tive use means that the ability to respond to water demand based products, vary greatly between countries at the same level
for other activities is inevitably reduced. Generally, water of GDP/capita (Figure 3). This means that there are very different
resources in areas located downstream of a consumptive use implications for water demand in different countries.
area are negatively affected.
What do the envisaged changes in diet mean for water 1.4 A Bleak Water Future?
demand? While estimates of water requirements for crop
and livestock products vary widely, most studies agree on the If diet continues to be correlated with income, as in Figure 3,
main points. Higher value crops, such as sugar and vegetables, water requirements will increase significantly in the future as
typically require more water per calorie than staple cereal a result of GDP growth. Researchers agree that per capita food
crops. Meat and dairy production is more water-intensive supply and the share of animal-based food items in the food
than crop production. For example, 500–4,000 liters of water basket are both increasing (e.g. Bruinsma, 2003; Fraiture et
are evaporated in producing one kilogram of wheat, depend- al, 2007; Steinfeld et al., 2007, McMichael et al., 2006). In rich
ing on climate, agricultural practices, variety, length of the countries, food supply is currently well above 3,000 kcal/capita/
growing season and yield. However, to produce one kilogram day with an animal food fraction of about a third, whereas
of meat takes 5,000–20,000 liters, mainly to grow animal feed. the global average food supply is about 2,800 kcal. In poor
In terms of the energy content of food, approximately 0.5 m3 countries, both food supply and the fraction of animal-based
of water is needed to produce 1,000 kcal of plant-based food, foods are significantly lower (FAO, Food Balance Sheets ).3
3
http://faostat.fao.org/site/502/default.aspx
SIWI Policy Brief: Saving Water: From Field to Fork
11Figure 3. Consumptive use of water for food supply as a function of GDP (Lundqvist et al., 2007). PPP: purchasing power parity. Source:
GDP data from the World Bank (2006); food supply data from FAOSTAT (2006).
Regional groups: DEVD =transition countries Europe, EA=East Asia, EURA=transition and developing former USSR, LEC=Latin America
and Caribbean, NAF=North Africa, OECD =Members of the Organisation of Economic Cooperation and Development, SA=South Asia,
SEA=South-East Asia, SSAF=Sub-Sahara Africa, WA=West Asia, Sislands=Small Islands.
It takes enormous amounts of water to produce our food. world. Already 1.4 billion people live in places where water is
Yearly some 7,000 km3 of water4 are evaporated and transpired physically scarce (CA , 2007). Another 1.5 billion people live
in connection with the production of crops to meet the global in places where water is available in nature but infrastructure
food demand at the beginning of this century. Assuming a to access it is lacking.
projected high level of average food supply of 3,000 kcal/capita/ It’s probable that if today’s food production and consump-
day, with 20 percent animal and 80 percent plant food, the tion and environmental trends continue, crises will occur in
consumptive water use will be above 3 m3/capita/day – 1,300 many parts of the world (CA , 2007). The challenges become
m3/capita/year, (Falkenmark and Rockström (2004). Similarly, even greater when we include newly emerging issues such as
the Comprehensive Assessment (CA , 2007) estimated that climate change and its implications for water variability and
cereal and water demands could both double with present scarcity, and the demand for agricultural produce for bioen-
production practices by the year 2050. Considering water ergy and industry.
scarcity constraints, it’s vitally important to consider what are Improvements of water productivity and agricultural
realistic levels of food production and the desirable levels and productivity in general, are therefore urgent and necessary.
composition of food consumption. Depending on how food Similarly, reductions of losses and wastage in the food chain
is produced, and assumptions on population and diet, future could significantly contribute to ensure a reasonable diet for
water requirements to meet food demand by 2050 have been a growing population over the next 50 years. It is not possible
estimated at between 10,000 to 13,500 km3/year (de Fraiture to tell how much more food can be produced from our land
et al., 2007; Lundqvist et al., 2007). and water resources, but the cost and effort has to enhance
The increase in water needed to meet the demand for production will have to be inceased. As discussed under 2.4,
food is a major concern given the growing water scarcity below, land and water will be demanded also for other pur-
and related environmental problems in many parts of the poses than food.
4
Each year, on average about 110,000 km3 of rain falls on the earth’s surface. A large part of this infiltrates and forms the green water resource (see Box 4) and another part results in about 40,000
km3of streamflow, which is a major part of the blue water resource, Geographic and temporal variation is considerable. The fraction of streamflow that can be withdrawn depends on a number of
circumstances and development objectives. Currently some 4,500 km3 are withdrawn with about 2,700 km3 for irrigation systems. This can be compared with an estimated 7,000 km3 or slightly
more that are evapotranspired in the process of total food production, i.e. from irrigated and rainfed land.
SIWI Policy Brief: Saving Water: From Field to Fork
122. A New Type of Water Scarcity
2.1 Climate Change Amplifies Water On the other hand, in temperate zones, a temperature
Scarcity increase of 1–3°C may improve conditions for agriculture
(IPCC, 2007). Climate change is therefore likely to accentuate
Climate change will radically change conditions for cultiva- regional differences in preconditions for agricultural produc-
tion. In the context of rising populations and fast-growing tion and food security.
economies, these changes need to be considered in the quest Food security can be achieved through a combination of
for food and water security. local and domestic production and imports in combination
Agricultural production will be significantly affected by a with a more efficient food chain management. Given the above
combination of changes in the pattern of rainfall and higher scenarios, local and national food self-sufficiency will be in-
temperatures (IPCC, 2007). Even small temperature increases creasingly difficult unless effective measures are implemented.
(1–2°C), will reduce potential yields and overall food produc- The possibility to produce food for a growing population
tion in the tropics and sub-tropics. IPCC scenarios suggest that will be significantly curtailed. Rockström et al. (2008) have
climate change will affect 75–250 million people in Africa, assessed how many countries will be able to produce food for
where potential yields in rainfed systems in some areas may their populations at 3,000 kcal/capita/day (20 percent animal
decline by up to 50 percent by 2020 (IPCC, 2007). Agriculture and 80 percent plant food) by 2050. The assessment was based
in countries in Central, South and South East Asia, which on a dynamic global vegetation and water model (Gerten et
are largely dependent on river water for irrigation will be hit al. 2004) and the IPCC ’s A2 scenario6 (IPCC, 2000). About
by a projected drop in river levels (IPCC, 2007).
Scenarios do, however, vary in the literature and in of-
ficial statements. For densely-populated areas in South Asia
and southern Africa, Lobell et al. (2008), estimated that
sizeable reductions in potential yields of major crops are
likely. Effective mitigation or adaptation measures need
to be implemented to counter the likely effects of climate
change. For instance, if agricultural practices do not drasti-
cally change, potential reductions in maize production may
be in the order of about a third by 2030. In areas that are
already susceptible to food insecurity and where population
will continue to grow, this is a drastic scenario. Dr Jacques
Diouf, Director-General of FAO5, has recently warned of a
5 percent decline in cereal production in many developing
countries by 2020, and that some countries may lose a much
higher percentage of their cereal harvest. According to Dr
Diouf, 65 countries, representing about half of the world’s
population, will experience falls in cereal production. Among
the most severely hit will be India, losing 18 percent of its
current cereal harvest.
At the same time, yields are far below their potential in
many areas of sub-Saharan Africa and South Asia. The figures
just quoted should therefore not be interpreted as a prediction
of a real reduction in yields. A major climate change adapta-
tion measure is to harness this potential through improved
Photo: Mats Lannerstad
integrated land and water management practices and to regain
the momentum of support to agricultural research and activi-
ties. In this manner the predicted negative effects of climate
change could be countered.
5
Statement by Dr Jacques Diouf at a conference organised by the Swedish International Development Agency “Climate change, food security and poverty reduction. Ensuring food security
by adapting to climate change” (http://www.fao.org/english/dg/2007/sida.htm).
6
The underlying theme of the A2 storyline is self-reliance, a continuously increasing global population and relatively slow per capita economic growth (IPCC, 2000).
SIWI Policy Brief: Saving Water: From Field to Fork
13one-third of the projected population of 10.5 billion will be 2.2 Variability in Water More Pronounced
living in water-abundant countries where such production Climate change will increase risk and unpredictability for
levels would be possible. But most will be in countries suf- the farmer. Extreme events will occur more often and high
fering various degrees of water constraint. More than half the temperatures will speed up the flow of water back to the
population could be in countries with severe water constraints atmosphere, disrupting the water balance. But variability is
(too dry and with difficulties of expanding irrigation). These nothing new to farmers. Throughout history, the monsoon in
water-constrained countries include China, India, Ethiopia, Asia has had devastating effects and the climate has dictated
Egypt, Iran, Jordan and Pakistan (Rockström et al., 2008). livelihoods in the tropics and sub-tropics. Box 1 gives an ac-
We therefore need to consider realistic levels of future food count of serious water scarcity in two districts of Tamil Nadu,
supply with regard to production constraints, on the one hand, southern India that resulted in famine, sickness and death 17
and consumption requirements, on the other. times over 100 years from 1804.
Box 1. In the Farmer’s Field, There is No Such Thing As an Average
At the global, regional, and local level, water availability and rain Balinga, 1966 p. 17). Famines continued to occur during the
is usually given as an average value. However, the average isn’t first half of the 20 th century.
usually the real water availability that the farmer has to deal Immediately after independence in 1947 the new National
with. In tropical monsoon climates, in particular, the average Government sanctioned the construction of the Lower Bhavani
often conceals considerable annual or seasonal variations; an Reservoir (capacity 900 Mm3) across the Bhavani River. The
example being agriculture in Coimbatore and Erode Districts, river is the only reliable, perennial surface water resource in the
in Tamil Nadu, southern India. The area relies mainly on the area and the dam is supposed to even out variation in flow and
unpredictable and erratic northeastern monsoon of October– hold sufficient water for one year. But as shown in Figure 4, the
December, characterised by cyclones, and short and heavy river flow and thus the inflow to the reservoir vary greatly. Over
downpours. In historical records the area is described as “of time, there is a tendency of reduction in average flow/inflow.
exceptional dryness” where the marked variation in rainfall Despite the reservoir, a large part of the farmers in the Lower
resulted in a situation where “not less than two-thirds of the Bhavani Project Command Area (84,000 ha) do therefore not
seasons” were “unfavourable” (Madras Presidency, 1902). receive the amounts of irrigation water they were supposed
During the years 1804–05, 1806, 1808, 1812, 1813, 1823, to get. In fact, they regularly receive less water than they had
1831, 1832, 1834, 1836, 1861, 1866, 1876–78, 1891–92, planned (or hoped) for. Over the last 90 years (before and
1892–93, 1894–95, 1904–05 and 1905–06 the area expe- after dam construction), the flow at the reservoir site shows
rienced serious water scarcity and these years were described that there is no such a thing as an average in terms of river
as times of “scarcity, desolation and disease” or “famine, sick- flow for an individual year. Even during years with the same
ness and death”. In 1808 failure of both monsoons caused a annual flow, monthly and daily variations can result in peak
famine “that carried off half the population”, while the “The inflows that overflow the reservoir, with less water available
Great Famine” in 1876–78 is described as “more disastrous in to distribute over the cropping year than the average would
effect than any of its predecessors” (Madras Presidency, 1902; seem to imply.
Figure 4. Flow at the site of Lower Bhavani Reservoir, Tamil Nadu, India (1917–2005). Sources: pers. comm. Executive Engineer, PWD
(Public Works Department), Bhavanisagar, Tamil Nadu, India, 2004-2006; Government of Madras (1965).
SIWI Policy Brief: Saving Water: From Field to Fork
14Photo: Getty Images
2.3 Water Scarcity: Competition and will be hard to counter. At the same time, urban expansion
intensifies demand for food and other agricultural produce.
Environmental Concerns Growing numbers of urban dwellers enjoy increased dispos-
Present production patterns are unsustainable in many places: able incomes, part of which will be spent on food and other
for instance, they involve overexploitation of groundwater, agricultural produce. The demand for agricultural products
and appropriation of stream flow resulting in widespread will not only accelerate but will also be more varied. Apart
river depletion and damage to aquatic ecosystems, fisheries from food, the urban sector demands raw materials for in-
and biodiversity (CA , 2007, Postel, 1999). About 1.4 billion dustry, commercial products and bioenergy. All of these
people live in closed basins, that is, where all water flow (for an demands present the receptive farmer with new opportuni-
average year) is already committed and where environmental ties. Some of these new products fetch a higher price than
flow is not considered. In addition, pollution from agricultural staple food crops, so these new opportunities may stimulate
chemicals and hormones, water logging and salinisation pose investments in rural areas, including investments in the water
threats both to the environment and to crop production. sector. Even if these efforts and investments will improve
Reduction in water bodies and changes in water flow performance in the agricultural sector, food production will
affect aquatic ecosystems in several ways (Smakhtin et al., have to compete with other agricultural products. Improved
2004; Smakhtin and Anputhas, 2006; Falkenmark et al., food security for a growing world population will remain a
2007; Molle et al., 2007). River depletion and changes in tremendous challenge.
hydrologic regimes by dam building disrupt downstream
aquatic ecosystems. Groundwater over-exploitation damages 2.4 Land and Water for Bioenergy
groundwater-dependent ecosystems. Overuse or unwise use of
nutrients and agricultural chemicals affect both aquatic and
and other Non-food Produce
terrestrial ecosystems due to polluted return flow from crop Although we think of food as the most important agricul-
lands. Drainage of wetlands for agricultural use leads to loss of tural product, there is a marked increase in demand for other
habitat and affects ecosystem characteristics such as fisheries, products, which will compete for land and water resources,
flood retention and groundwater recharge. Changes in these investments, manpower, etc. (Rosegrant et al. 2008). With
characteristics can have severe consequences for the poor who the price of oil currently (mid 2008) close to the 140 dollar
depend on ecosystems for their livelihoods. per barrel level, the “peak oil” discussion, and geopolitical
Growing demand for water increases competition and/or and climate change concerns attached to a reliance on fossil
the cost to supply water. With rapid urbanisation, the agri- fuels, an increased demand for bioenergy is expected (Berndes
cultural sector will increasingly compete for water with the 2002). For farmers, a more diversified and increasing demand
urban sector. Substantial trans-basin diversion schemes have is an opportunity after of a long period of falling prices paid
been planned or are being constructed (e.g. Three Gorges for staple food items.
in China, or the Linking Rivers project in India). Competi- Biomass is an important source of energy in developing
tion for water from the urban sector means increasing water countries, mainly combustion of wood and agricultural resi-
stress for farmers and the rural sector since economic, social dues, with severe negative impacts. The combustion in con-
and political arguments for increasing supply to urban areas fined spaces leads to indoor air pollution to which women
SIWI Policy Brief: Saving Water: From Field to Fork
15and children are primarily exposed with severe health conse- resources (see Box 2). During the coming decades, the water
quences, including respiratory illnesses and premature death requirements for bioenergy may add substantially to the total
(WHO 2002). There is a strong motive to substantially improve water requirements. Latin America and sub-Saharan Africa
and increase the supply of energy services in developing coun- are among the regions commonly suggested to become major
tries (Takada and Porcaro 2005, UNDP 2005). biofuel suppliers on a prospective global biofuel market. It is
One of the consequences of an expansion of bioenergy well motivated to investigate the consequences of large biofuel
is a significant increase in the pressure on land and water production levels in these regions (Figure 5).
Box 2. Bioenergy, Food and Water Pressure
The present global energy system is dominated by the use is expected to more than double during the 21st century.
of fossil fuels with environmental effects such as eutrophica- Possible future energy sources include solar and wind
tion, acidification and climate change. Around the world, food energy, bioenergy, nuclear fission and fusion, and fossil fuels
production also relies to various degrees on fossil fuels and with carbon capture and sequestration. Bioenergy ranks as one
petroleum-based chemicals, including synthetic fertilisers. of the few technological options capable of tackling climate
Concerns about human-induced climate change and oil/ change today. However, it is not the panacea for solving future
gas import dependency drive the search for radical changes energy systems.
in the global energy system. There are compelling arguments Biofuels for transport (mainly ethanol and biodiesel) at
for keeping atmospheric CO2 concentrations below 400 ppm. present use traditional starch, sugar and oil crops. Second
Assuming a global population of 10 billion people in 2100, aver- generation biofuels (e.g. Fischer Tropsch fuels, dimethyl ether
age global emissions would need to drop to about 0.2 tonnes and lignocellulose-based ethanol) will become increasingly
of carbon per capita per year. This is below the prevailing level competitive when more abundant and cheaper lignocellulosic
in India today. At the same time, global energy consumption feedstocks can be used..
Figure 5. Estimated water requirements for food today and hypothetical water requirements for food and bioenergy around year
2050. The vertical axis is crop evapotranspiration in km3/year. It is assumed that lignocellulosic crops will mainly be used for
bioenergy with an average water use efficiency (WUE) of 2.5 kg biomass per m3 of evapotranspiration. This is a high average WUE
compared to that presently achieved for agricultural crops. However, calculations are based on a possible situation almost 50 years
ahead, when WUE will likely be higher than today as a result of plant breeding and improved agronomic practices. See Lundqvist
et al. (2007) for further information.
SIWI Policy Brief: Saving Water: From Field to Fork
16Photo: Getty Images
It is relevant to note that although bioenergy may become et al., 2007). For farmers and rural communities, an enhanced
a major component in the future pressure on land and water demand for their produce provides an opportunity and could
resources there are other important drivers as well. As dis- stimulate investments in rural development. Tenure, access to
cussed above, the demand for animal based food products is credits and markets to cater for social development objectives
significantly adding to overall water pressure. Concerning the will be very important.
bioenergy sector, there are considerable uncertainties about Social and environmental challenges and opportunities
its role in the future. The biomass use for energy7 assumed in must be continuously identified and evaluated. For example,
Figure 5 is not very high compared to the supply potentials analysing the water implications of increased production of
reported in various resource assessments focusing on land biofuels for transport for selected countries/regions (de Fraiture
rather than water as the constraining factor. et al., 2008) found that globally, irrigation is not likely to be
An important question is also where the production of a major water source for biofuel production (at the assumed
biomass for energy purposes can and will expand. Depending production levels, which varied among regions and globally
on the type of feedstock, it is possible to cultivate biomass for reached 7.5 percent of transport fuel use by 2030). But locally,
energy purposes in areas where conventional food production it could cause severe water stress. Using irrigation for biofuel
is not feasible, for instance, due to water constraints. Such a production would add significantly to the water stress in
strategy is, for example, being attempted in parts of India contexts where water availability is constrained but where
where about 13 million hectares of wasteland are being ear- food cultivation is possible.
marked for cultivation of feedstocks that can grow in areas Other non-food crops (such as cotton) occupy only 3 per-
with a low rainfall, e.g. Jatropha and sweat sorghum (Wani, cent of the cropped area, and 9 percent of the irrigated area
pers. Com. 2008). Another important option is efforts to (Molden et al. 2007 a). Even if the importance of cotton and
promote multi-functional production and social systems. In other non-food crops were to increase in the future, which
Brazil, for instance, efforts are made to combine crops for might be good for the farmer, in terms of resource pressure
bioenergy, sugarcane, and other agricultural produce, e.g. milk these crops are comparatively much less significant than food,
production through arrangements for small farmers (Sparovek feed and biomass for energy purposes.
7
About 86 EJ per year (EJ, or exajoule, is equal to 1018 joules), which can be compared to the 390 EJ (60 GJ/capita) of fossil fuels that were commercially traded globally in 2005 (BP 2007)..
Projections about energy demand in the future vary substantially: for 2050 ranging from about 800 EJ to 2,000 EJ. Modelling studies of long range energy system development commonly
see biomass use for energy reaching several hundred EJ per year (BP 2007. Statistical review of world energy 2007. (http://www.bp.com/statisticalreview)
SIWI Policy Brief: Saving Water: From Field to Fork
17Photo: Frida Lanshammar
2.5 Under Nourishment and Over supply. The risk that some of the population may be under
Eating: Changing Perspectives on nourished is very low if food supply is approaching 3,000 kcal/
Food Security capita/day (SEI, 2005); this comparatively high level of food
supply corresponds to projections in FAO reports (Bruinsma,
Discussions about food security refer either to the amount 2003).
of food supply, usually at national level, or the nutritional While the risk of under nourishment is reduced with in-
requirements. The common denominator is the objective to creasing supply of food – provided that access is ensured – the
minimise the risk of under nourishment. According to the 1996 risk for over eating and wastage is likely to increase when food
Rome Declaration: “Food security exists when all people, at becomes more abundant in society. With the very high levels
all times, have physical and economic access to sufficient, safe of food wastage in society and the large number of people who
and nutritious food to meet their dietary needs and food pref- are suffering from being overweight or obese, it is time to pay
erences for an active and healthy life.” (FAO, 1996). Naturally, attention to not only under nourishment but also overeating
the food requirements vary depending age, physical activity and wastage. It is important to differentiate between figures
etc. The most commonly used international norm for food that refer to food supply and figures that refer to intake or
security refers to a food supply where the energy requirements consumption of food. Generally, the amount of food produced
of the national populations are supposed to be met. In addi- must be higher than the amount of food supplied, which in
tion to the energy requirements, a proper diet must contain turn must be higher than food consumed. From a nutritional
essential proteins and micro-nutrients. Figures about dietary point of view, the energy intake should be about 1,900 –2,200
energy requirements vary in literature, but a common refer- kcal/capita/day (FAO, 1996; Schäfer-Elinder, 2005; Smil, 2000;
ence is to a national average food supply of 2,700 kcal/capita/ MSSRF, 2002). A sound diet must, of course, also contain other
day. Slightly higher figures have also been used, 2,800 (CA , nutritional components. If energy intake is lower, the risk of
2007) and 3,000 (Bruinsma, 2003). under nourishment increases9 and if it is higher, the risk of
An analysis of food supply data8 and the incidence of under overweight and obesity increases. Consequently, level of food
nourishment in the world reveal a direct and linear reduction supply and composition of diets have direct consequences
in the number of under nourished people with increased food for water pressure and the environment as well as for public
8
The most comprehensive database for such calculations is FAO’s Food Balance Sheets (see note 3), which provide information for individual countries on production, net exports or imports
and non-food use of food. Quality of data depends on reports from the individual country. These sets of data can be used to estimate the supply of food on a country basis. They do not,
however, show how much food is lost, wasted or eaten.
9
For the poor and under nourished, the need of increased access to and intake of food up to a certain basic level is an overriding issue. Attempts have been made to estimate what is the Mini-
mum Dietary Energy Requirement. According to FAO, for instance, these estimates vary from 1,730 to about 2000 kcal/capita/day for various countries (http://www.fao.org/es/ess/faostat/
foodsecurity/Files/MinimumDietaryEnergyRequirement_en.xls). In MSSRF (2002) it is mentioned that an average food intake that is 70% of the international norm for food security, i.e. 0.7 x
2700 = 1890 kcal/capita, day may be acceptable. What is generally acceptable must be related to nutritional and medical criteria. It is also related to the age and occupational structure of the
population, among other things. Smil (2000) provides examples showing that food intake at levels below 2000 kcal/capita/day have not resulted in documented signs of under nourishment.
SIWI Policy Brief: Saving Water: From Field to Fork
18You can also read