Chapter 4: Korea and the Shipbuilding Global Value Chain - September 2017 Lukas Brun and Stacey Frederick - Duke Global ...
←
→
Page content transcription
If your browser does not render page correctly, please read the page content below
Joint Project between GVCC and KIET

Chapter 4: Korea and the
Shipbuilding Global Value Chain

September 2017
Lukas Brun and Stacey Frederick

© Duke GVC Center, September 2017
Chapter 4. Korea and the Shipbuilding Global Value Chain1

Table of Contents
4. Korea and the Shipbuilding Global Value Chain .................................................................. 4-1
         The Shipbuilding Global Value Chain .......................................................................... 4-2
    4.1.1. Introduction ............................................................................................................ 4-2
    4.1.2. Market and Competitiveness Issues ....................................................................... 4-3
    4.1.3. Mapping the Shipbuilding Global Value Chain..................................................... 4-7
    4.1.4. Global Production and Trade in the Shipbuilding GVC ...................................... 4-13
    4.1.5. Lead Firms and Governance Structure of the Shipbuilding GVC ....................... 4-21
    4.1.6. Standards and Institutions .................................................................................... 4-24
    4.1.7. Human Capital and Workforce Development...................................................... 4-28
    4.1.8. Upgrading Trajectories in the Shipbuilding GVC ............................................... 4-30
         The Asian Regional Value Chain (RVC) .................................................................... 4-33
    4.2.1. The Shifting Geography of the Regional Value Chain: The Rise of China......... 4-34
         Korea and the Shipbuilding Global Value Chain ........................................................ 4-37
    4.3.1. Development ........................................................................................................ 4-38
    4.3.2. Current Status....................................................................................................... 4-40
    4.3.3. Workforce Profile ................................................................................................ 4-43
    4.3.1. Evidence of Upgrading ........................................................................................ 4-44
         Shipbuilding Recommendations ................................................................................. 4-45
  References .............................................................................................................................. 4-47
  Appendix ................................................................................................................................ 4-52

List of Tables
Table 4-1. Ship Types and Characteristics ................................................................................ 4-12
Table 4-2. Top 10 Shipbuilding Countries (based on GT Completed), 2015 ............................ 4-16
Table 4-3. World Completions by Type (No. & GT), 2015 ...................................................... 4-17
Table 4-4. Top 10 Ship Exporters by Value & Year, 2007-2015 .............................................. 4-18
Table 4-5. Top World Ship Exporters by Type & Value, 2015 ................................................. 4-19
Table 4-6. World Exports of Ship Subassemblies/Components, 2015 ...................................... 4-20
Table 4-7. Global Lead System Suppliers ................................................................................. 4-21
Table 4-8. Geographical Distribution of Active Shipyards, 2015 ............................................. 4-23
Table 4-9. Top Global Shipbuilders........................................................................................... 4-23
Table 4-10. Standard Setting Organizations and Agreements in the Shipbuilding GVC .......... 4-24
Table 4-11. IACS Required Inspections (“Surveys”) ................................................................ 4-25
Table 4-12. Management System Certifications in Shipbuilding .............................................. 4-27
Table 4-13. Employee Profile for the Shipbuilding Assembly .................................................. 4-28
Table 4-14. Capability Upgrading in the Shipbuilding GVC .................................................... 4-31
Table 4-15. Korea Ship Completions by Vessel Type, Share of World, 2015 .......................... 4-41
Table 4-16. Key Indicators of Shipbuilding in Korea................................................................ 4-42
Table 4-17. Workforce Profile of the Shipbuilding and Offshore Industry in Korea, 2015 ...... 4-43
Table A-4-1. Shipbuilding HS Codes by Value Chain Stage .................................................... 4-52
Table A-4-2. Delivery of Newbuilds by Vessel Type and Country of Build, 2015 .................. 4-53
Table A-4-3. Supporting Shipbuilding-Specific Stakeholders in Korea by Focus Area ........... 4-53

1
    Chapter prepared by Lukas Brun and Stacey Frederick.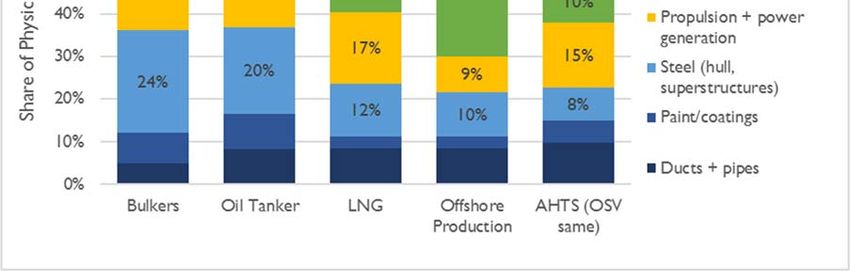
List of Figures
Figure 4-1. World Completions by Country and Ship Type, 2010-2015 .................................... 4-2
Figure 4-2. Cyclical Demand in the Shipbuilding Sector ............................................................ 4-4
Figure 4-3. Shipbuilding Global Value Chain ............................................................................. 4-7
Figure 4-4. Ship Systems and Subsystems .................................................................................. 4-9
Figure 4-5. Cost of Materials and Equipment/Systems by Ship Types ..................................... 4-10
Figure 4-6. Leading Producers and Exporters in Shipbuilding, 2015........................................ 4-14
Figure 4-7. World Ship Completions by Country (GT, million), 2003-15 ................................ 4-16
Figure 4-8. World Ship Completions, Shares by Type (GT), 2000-15...................................... 4-17
Figure 4-9. World Ship Exports, by Type & Value, (US$ billions), 2007-2015 ....................... 4-19
Figure 4-10. Types of Upgrading in the Shipbuilding Value Chain .......................................... 4-32
Figure 4-11. Ship Completions (in thousand GT) and Market Share, by Country 2006-2015.. 4-35
Figure 4-12. Shipbuilding Industry Productivity, China, Korea, and Japan .............................. 4-36
Figure 4-13. Product Portfolio and Value of Ships: Japan, China and Korea, 2010-2015 ........ 4-37
Figure 4-14. Korea: Ship Completions and World Share by GT (‘000), 2006-2015 ................ 4-40
Figure 4-15. Korea Orderbook by Ship Type (as of June 30, 2016) ......................................... 4-41
Figure 4-16. Korea’s Exports, by Product Category, 2007-2015 .............................................. 4-42
Figure 4-17. Vessel Completions of Major Korean Shipyards, by Type (in CGT), 2016 ......... 4-43

List of Boxes
Box 4-1. Unique Aspects of Shipbuilding Data......................................................................... 4-14
Box 4-2. Workforce Development in Singapore's Shipbuilding Sector .................................... 4-29
Acronyms
AHTS       Anchor Handling Tug Supply
ANSI       American National Standards Institute
API        American Petroleum Institute
ASEAN      Association of Southeast Asian Nations
ASME       American Society of Mechanical Engineers
AWS        American Welding Society
B2B        Business to Business
CGT        Compensated Gross Tonnage
COGS       Cost of Goods Sold
DAB        Design and Build
DGPS       Differential Global Positioning System
DP         Dynamic Positioning
DSV        Dive Support Vessel
DWT        Dead Weight Tonnage
EPC        Engineering, Procurement and Construction
ERRV       Emergency Response and Rescue Vessel
ESWBS      Expanded Ship Work Breakdown Structure
EU         European Union
FLNG       Floating LNG Liquefaction Plant
FPSO       Floating Production, Storage and Offloading Vessel
FPSS       Floating Production Semi-Submersible
FPSU       Floating Production and Storage Unit
FPU        Floating Production (or Point) Unit
FSO        Floating Storage and Offloading Vessel (no production plant)
FSRU       Floating Storage and Regasification Unit
FTA        Free Trade Agreement
GT         Gross Ton/Gross Tonnage
GVC        Global Value Chain
HS         Harmonized System
HVAC       Heating, Ventilation and Air Conditioning
IACS       International Association of Classification Societies
ILS        Integrated Logistical Support
IMO        International Maritime Organization
IRM        Inspection, Repair & Maintenance
ISS        In-Service Support
KSE        Korea Stock Exchange
LGC        Large Gas Carrier
LNG        Liquefied Natural Gas
LPG        Liquefied Petroleum Gas
LPH        Landing platform helicopter
LR2     Long Range 2
LSF     Landing ship fast
LST     Landing ship tanker
MGC     Medium Gas Carrier
MNC     Multinational Corporation
MODU    Mobile Offshore Drilling Unit (drillships)
MPSV    Multi-Purpose Support Vessel
MR      Medium Range
MSV     Multi-Support Vessel
NPD     New Product Development
OBO     Ore-bulk-oil
ODM     Original Design Manufacturer
OEM     Original Equipment Manufacturer
OSV     Offshore Support Vessel
PSV     Platform Supply Vessel
R&D     Research and Development
RoRo    Roll-on/Roll-off
SBSR    Shipbuilding and Ship Repair
SGC     Small Gas Carrier
SOLAS   International Convention for the Safety of Life at Sea
SPAR    Single Point Anchor Reservoir
STEM    Science, Technology, Engineering and Mathematics
SURF    Subsea, Umbilicals, Risers, Flowlines vessels
TEU     Twenty-foot Equivalent Unit
TLP     Tension Leg Platform
ULCC    Ultra Large Crude Carrier
US      United States
VLCC    Very Large Crude Carrier
VLGC    Very Large Gas Carrier
WTIV    Wind Turbine Installation Vessel
4. Korea and the Shipbuilding Global Value Chain

Shipbuilding in Korea has been a lynchpin of industrial development, national security, and
source of employment and foreign exchange for the country since the 1970s. From relatively
humble beginnings in 1972, when Korean national economic development plans identified
shipbuilding as a key industrial sector for development, the big three Korean shipbuilding firms,
Hyundai Heavy Industries, Samsung, and Daewoo have become dominant firms in the global
shipbuilding industry, producing sophisticated commercial vessels for customers around the
world. Today, the shipbuilding industry contributes about 2% to Korea’s GDP (OECD 2015),
directly employs approximately 200,000 workers, particularly in rural areas, and makes up
between 7-8% of total exports (KOMEA 2016). Shipbuilding is routinely among the top three
most valuable Korean export industries, competing with automobiles and electronics for the top
spot (KOMEA 2016).

However, key market and competitive trends are affecting this important industry for Korea.
China has emerged as an important producer of commercial vessels and is rapidly increasing its
capability to produce large and sophisticated ships. China’s global market share of commercial
shipbuilding has grown from about 15% in 2006 to more than 35% in 2015 (IHS 2009-2016) and
is increasingly entering the “very large” category of some commercial vessel types (i.e.,
containers and oil carriers) that have historically been the purview of Korean shipbuilders. As a
result, Korean shipbuilders must remain at the forefront of technology development and
production methods to ensure they remain the most competitive shipbuilder in higher value ship
categories, like gas carriers, oil tankers, and the very large container ships they have traditionally
dominated, while at the same time investing in ice-classed and oil-extraction related production
vessels to diversify their product portfolio.

Increased competition from China is happening at a time of global shipbuilding overcapacity
resulting from the aftereffects of the global financial crisis. Reductions in new orders have led to
intense global competition, resulting in lower prices. While there are emerging signs of recovery,
thanks to improved economic conditions and the need to comply with environmental regulations,
shipbuilders across the world have shuttered docks and closed shipyards to reduce overcapacity.
This has exacerbated the shift from higher cost shipyards to lower cost shipyards historically
serving as periodic inflection points in the industry. For Korean shipbuilders to remain globally
competitive, and not see their industry leadership fade as Japanese, European and American ones
before them, the country has focused on production technology to increase productivity,
emphasized ship component technology development and trade, and has continued to invest in
workforce development in the shipbuilding industry. As it moves forward, in addition to product
and process upgrading, Korean shipbuilders may also need to pay more attention to
financialization and other business model changes occurring in the industry. In particular,
servicificaiton of the chain, through ship financing and leasing may become increasingly
important competitive factors in the industry.

In the upcoming sections, we investigate the shipbuilding value chain and Korea’s position in the
regional and global industry. In section 2, we expand on the market and competitiveness issues
faced by the global industry, map the value chain, identify leading shipbuilders and component
firms, discuss important standards and institutions in the value chain, and identify skill

                                                                                                  4-1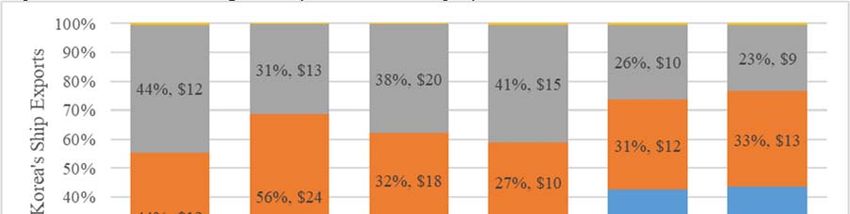
requirements and upgrading trajectories. In section 3, we turn our attention to discussing how
different countries in the region have developed unique niches in the shipbuilding value chain.
This is followed by section 4, in which we focus on Korea’s position in the chain and suggest
approaches to industry upgrading. One important lesson about Korea’s shipbuilding industry is
that it is well-positioned in the industry to remain globally competitive in certain final product
categories and component parts; in many ways, the industry remains the envy of many of its
competitors in other countries. However, the changing dynamics of the chain could very possibly
affect the ability of its builders to remain attractive to customers and retain its global leadership.

This chapter analyzes commercial shipbuilding and the role of Korea in the industry. The chapter
is structured as follows: First, it analyzes the shipbuilding value chain, including an extended
discussion on market and competitiveness issues in the shipbuilding industry, followed by a
description of the key segments of the chain, the countries that participate in each, and how key
stakeholders in the chain interact. It then offers a focused discussion of the role of China, Japan,
and Korea in the industry and concludes with an assessment of the industry in Korea.

         The Shipbuilding Global Value Chain

        4.1.1. Introduction

In the 20th century, shipbuilding was dominated by European nations and the US until the mid-
1960s, when Japan became the premier shipbuilding nation, followed by Korea in 1999, and
China in 2010 (Stopford, 2015). Today, commercial shipbuilding – the construction of seaborne
vessels with the primary purpose of moving large quantities of goods, commodities, or people –
is controlled by these three East Asian countries each completing about a third of the global
commercial shipbuilding market, for a combined 90% of global commercial ship production
(based on gross tons) (Figure 4-1). This report is primarily about commercial shipbuilding,
which is distinct from naval shipbuilding, used for national defense and other sovereign
purposes, and recreational vessels, which are ships used for personal use.

Figure 4-1. World Completions by Country and Ship Type, 2010-2015

Note: Completions measured as percent of global gross tonnage. Ship coverage is 100GT or over.
Source: Authors, calculated from (IHS, 2009-2016)

                                                                                                  4-2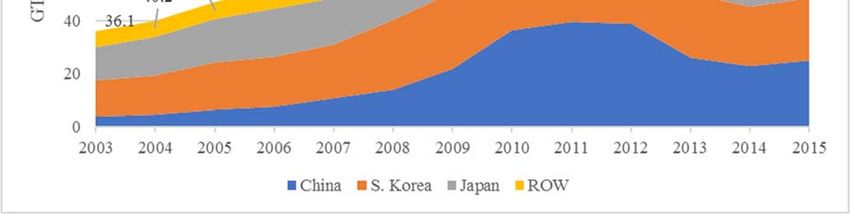
Commercial shipbuilding is comprised of several vessel categories. Most production (80% based
on GTs) occurs in three types of vessels: containerships, oil (crude) tankers, and dry bulkers.
Containerships, making up about 18% of annual commercial ship production, are vessels
optimized to carry containers (called TEUs, for Twenty-foot Equivalent Units) that hold
components and final goods used in international commerce and production. Crude tankers,
making up about 15%, carry crude oil from global production sites to national and regional
refinery sites. Dry bulkers, making up approximately 48%, are designed to transport unpackaged
bulk cargo, such as grains, coal, ore, and cement in large cargo holds. The balance of production
(20%) within the commercial shipping category are general cargo ships used to transport
refrigerated goods (“reefers”) and cars (“RoRos”), gas tankers carrying compressed gasses
(LPG/LNG carriers) used for energy production, passenger and fishing vessels, and “offshore”
vessels used primarily to support oil extraction and undersea construction.
4.1.2. Market and Competitiveness Issues
Five major trends shape the current commercial shipbuilding market. They are:
overcapacity and declining prices
lower order volumes and changing product mix
financing new orders
changing ship design and environmental regulations.
production technologies.
Overcapacity and declining prices: Overcapacity is a major trend affecting prices and profits in
the shipbuilding industry. Persistent overcapacity, in two (container and dry bulk) of the three
major market segments is the result of a related stream of events including reduced transportation
prices, reduced profits for shippers, cancelled ship orders, increased idling and demolition of
existing ships, and market consolidation among shippers occurring as the result of the 2008
global financial crisis.
The global shipyard capacity utilization rate in 2016 is estimated at approximately 78%, down
from 92% in 2008 (DSF, 2016). Of the three major shipbuilding countries, China utilized 68%,
Japan 83%, and Korea 94%, of its shipyards in 2016. Major shipbuilders around the world are
reducing the number of active yards through complete shutdowns and bankruptcies. The number
of active yards is predicted to decline to 260 in 2017, down from 1,130 in 2010 and 780 in 2015.
Newbuild prices for all major vessel categories have declined by at least 25% since their highs in
2009 (DSF, 2016).2
A major cause of overcapacity in the shipbuilding industry is weak demand for shipping and the
existing stock of relatively young vessels in the three major shipbuilding market segments. As
shipping demand declines, freight rates drop, ship prices decrease, newbuild demand decreases,
demolitions increase, leading to an eventual recovery in freight rates and newbuild demand
2
Newbuild and secondhand prices for major vessel categories are provided by DSF (2016). Newbuild prices in 2015
declined by 2% for containerships, crude carriers, and gas carriers; 11% for bulk carriers.
4-3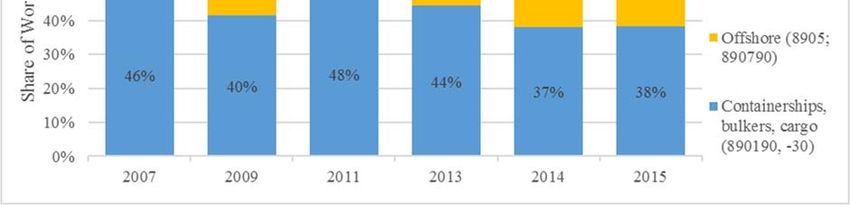
(OECD, 2015a). These long-term market cycles may be 30-40 years, with the current period
indicative of a cycle which saw its last 2011 peak in 1975 (see figure below).

Figure 4-2. Cyclical Demand in the Shipbuilding Sector

Source: World Shipbuilding Scenario from Clarksons (2013)

Reduced prices for transportation services have led to container and dry bulk shippers operating
at or below operating costs, creating ripple effects throughout the shipbuilding market. Shippers
have responded to excess supply by reducing demand (or cancelling orders) for newbuilds, and
increasing the demolition rate of older ships. Increased demolition rates in containerships
removed 201,000 TEUs of older ships from the global fleet (BRSGroup, 2016), but still only
accounted for 12% of newbuild deliveries over the same period, exacerbating overcapacity. In
the dry bulk segment, scrapping accounted for almost three-fourths of global scrapping activity,
reducing fleet growth to its lowest level in 15 years (Clarksons, 2016; UNCTAD, 2016b). Idling
ships has also been used in the bulk market, accounting for a reduction of 5 million DWT (DSF,
2016; UNCTAD, 2016b). However, these responses were still unable to balance supply and
demand and return the container and dry bulk shipping sectors to profitability.3

To increase profitability, market consolidation among shippers has occurred. Japan’s three
biggest shippers, Nippon Yusen KK, Mitsui OSK Lines, and Kawasaki Kisen Kaisha, announced
a merger in November 2016 as a way to remain competitive and avoid bankruptcy.4 Additional
consolidation among shippers is ongoing, both in Asia and Europe (Park, 2017). Insolvencies
and liquidations among shipping companies, including those of Hanjin Shipping in August 2016,
has led to greater concentration in the market, reducing the ability of smaller companies to
operate, and which may result in an oligopolistic market (UNCTAD, 2016b). Strategic
partnerships have also occurred, with shipping alliances developing in both the container and dry
bulk markets to coordinate chartering and transportation services. Capesize Chartering, for
example, originated in the bulk carrier market during 2015 to share information and optimize
fleet costs (Alix Partners, 2016; UNCTAD, 2016b).

3
  Information about profitability levels across major market segments is provided in (DSF, 2016).
4
  Nippon Yusen president Tadaaki Naito stated “the aim of becoming one this time is so none of us become zero” as
reported in (Chandran, 2016).

                                                                                                             4-4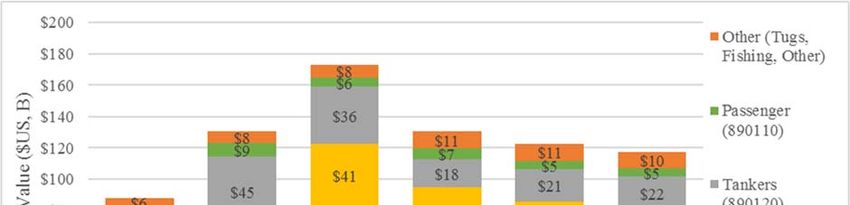
In addition to the cyclical decline in demand, there are structural and non-market causes for
overcapacity in shipbuilding. Among structural causes of overcapacity are factors common in
capital-intensive industries with long investment horizons. These include the long delivery times
of vessels (approximately two years), long lead times in adding or reducing shipyard capacity,
and push from buyers to add shipbuilding capacity during periods of tight capacity. Non-market
factors causing overcapacity in the shipbuilding sector include strategic capacity expansions by
incumbents to discourage new entrants, industrial policies favoring new capacity investment or
limiting restructuring, and protectionist policies, including cabotage polices. In the current
period, policies providing government financial support for maintaining capacity, including
production subsidies, capital participation, tax benefits, and lax regulations on the use of lands
and facilities are limiting the elimination of shipyard overcapacity (OECD, 2015a). Overcapacity
in the shipbuilding and shipping industry will exist for the foreseeable future (Clarksons, 2013;
DSF, 2016; UNCTAD, 2016b), recovering only as existing in-service vessels are scrapped or
retired after an average of 23 years of service (OECD, 2015a).

Lower volumes and changing product mix: Future vessel requirement estimates by OECD
indicate that the major shipbuilding sectors – tankers, bulkers, and containers – will not return to
levels seen in the last decade until the 2030’s, if at all. Tanker completion volumes of those seen
in 2008 (20 million GT) are not expected to return until 2028. Bulker deliveries peaked at 50
million GT in 2011, and are not expected to return through the predictable future (2035). The
high containership volumes of 2008 and 2014 (approximately 15 million GT) are not expected to
return until 2033. While reduced vessel requirements are partly the result of the existing
inventory of vessels discussed above, more persistent changes are expected with longer-term
trends reducing the linkage between GDP and trade growth (UNCTAD, 2016b). These trends
include demographic shifts, shortened GVCs, and IT-related efficiency and productivity gains
occurring as the result of Industry 4.0 technologies which could signal structural changes in the
demand for shipborne transportation (DSF, 2016; UNCTAD, 2016b). These changes will impact
the product mix; although the majority of production in commercial shipbuilding has been in
bulkers and oil tankers, growth will likely be in LNG/LPG gas carriers, RoRos and ferries, and
the offshore market (Kent, 2016).5 Although participation in the offshore market involves large
risks (OECD, 2015a), it is an increasingly large share of shipyard production, and is composed of
vessels that tend to have higher unit values.

Financing new orders: Access to finance has been a limiting factor in the shipbuilding industry
since the 2008 economic crisis when Western commercial banks reduced their exposure to
shipbuilding finance (Albertijn et al., 2011; Liu, 2016). This was in part due to capital
requirements under the Basel III Accords (Liu, 2016) which introduced new banking regulations
to enhance the sector’s ability to absorb financial and economic shocks (BIS, n.d.). Stepping into
the breach have been Asian lenders, typically with state-backed funds (Aw et al., 2016; Liu,
2016) and shipbuilders seeking to secure orders in a buyer’s market (DSF, 2016). Shipbuilders
have provided generous payment terms to potential shipowners to maintain their orderbooks and
shipyard activity. New terms reduce payments from the traditional 20% payments over five years
to four 10% payments and one 60% payment at the end of five years, resulting in a “heavy tail”
for ship finance (Hyun, 2013). However, these payment and financing arrangements have
affected shipbuilders’ profitability. Shipyards with limited ability to provide financing options,

5
    The fleet age for RoRos is higher than other product categories, with about half older than 20 years (p. 18).

                                                                                                                    4-5
particularly refund guarantees and export credit guarantees, are at a disadvantage when
compared to large, state-affiliated shipyards with better financing options.6 Nevertheless, even
shipyards in countries traditionally providing state-backing are experiencing financial challenges
in the current environment. In Korea, the “big three” shipyards - Samsung Heavy Industries
(SHI), Hyundai Heavy Industries (HHI), Daewoo Shipbuilding and Marine Engineering (DSME)
- and STX Offshore & Shipbuilding all announced the need to restructure. In China, five
shipyard bankruptcies were announced in 2016 with a sixth restructuring (Kent, 2016).
Changing ship design to increase efficiency and comply with environmental regulations: Ships
have become larger, more fuel efficient, and compliant with stricter environmental standards
since the early 2000s. Larger vessels have become attractive to shipowners because they can
achieve economies of scale in transportation, which have been made possible by the physical
expansion of the Panama Canal and Suez Canal. Ship designers have also increasingly focused
on fuel efficiency as an important factor affecting profitability, as ship fuel costs (“bunker
prices”) have become an increasingly large portion of operating costs, especially before the rapid
decline in bunker costs from 2014 to the current period. As a result, vessels in the global fleet
have become more fuel efficient, while the use of alternative fuels, especially LNG, to power
ships may also become increasingly common.7
Finally, the implementation of environmental regulations has affected shipbuilders. Most notable
of these is the ballast water convention (2004 International Convention for the Control and
Management of Ships’ Ballast Water and Sediments) requiring the bilge to be free from fouling
organisms by September 2017, and the International Maritime Organization’s (IMO) adoption of
enhanced environmental regulations, including reductions in the emission of air pollutants from
ships. Marine pollution (“MARPOL”) conventions, including the Energy Efficiency Design
Index (EEDI), require reductions in carbon dioxide (CO2) emissions. Specifically, the EEDI
requires stepwise reductions in CO2 emissions from 2000 levels, including 10% in 2015, 20% in
2020 and 30% in 2025.8 Conventions under MARPOL Annex VI also establish emission control
areas (ECAs) for sulphur oxide and nitrogen oxide emissions in specific geographic areas.9
Construction Technologies: since the 1980s modular approach to shipbuilding (“block
construction”) developed in Asia. In modular shipbuilding, pieces of the hull of up to 300 tons
are separately built and assembled in blocks on land before assembled in docks, dramatically
increasing efficiency and reducing the costs of shipbuilding. Korean firms, like HHI and SHI,
rose to prominence by building large shipyards capable of block construction and vertically
integrating the steps of the shipbuilding process, including the integration of major systems.
Today, the efficiency of the block construction method has been enhanced by automated
welding. Large ship blocks are quickly constructed by programmable robots made by ABB and
6
Refund guarantees provide for a return of pre-delivery payments made by the shipowner to the shipbuilder,
typically as security against the insolvency of the shipbuilder (Heward, 2010). Export credit guarantees, typically
provided by governments or quasi-governmental entities, ensure that an exporter receives payment for goods
shipped overseas in the event the customer defaults, reducing the risk to the exporter's business (Davis, 2012).
7
See www.marineinsight.com/future-shipping/shipbuilding-technologies
8
The Ship Energy Efficiency Management Plan (SEEMP) is a complimentary convention regarding the energy
efficient operation of ships.
9
For more information, see www.imo.org/en/MediaCentre/hottopics/ghg/Pages/default.aspx
4-6Inrotech, among others. SHI’s Geoje shipyard in Korea is particularly well known for achieving
efficiency gains in shipbuilding due to its adoption of these welding robots.10
4.1.3. Mapping the Shipbuilding Global Value Chain
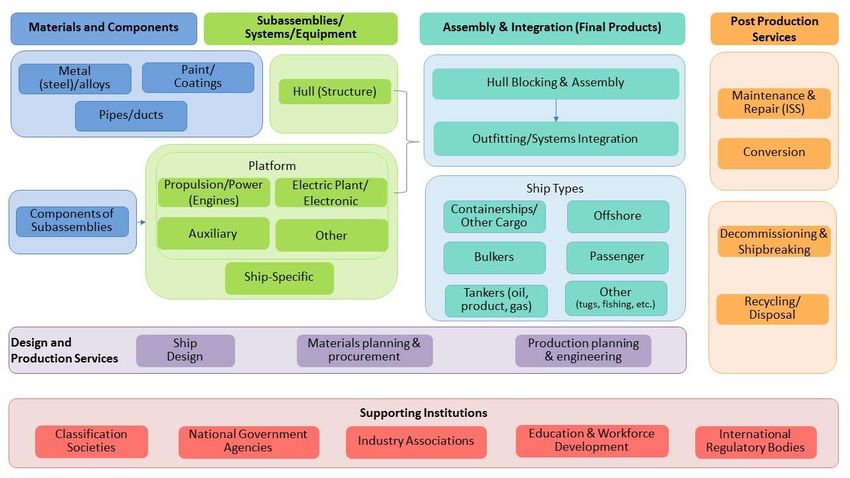
Modern shipbuilding involves multiple actors to design, construct and maintain a ship. Figure 4-
3 illustrates the complex set of design, production, and post-production activities involving
multiple actors across the shipbuilding value chain. The purpose of this section is to illustrate the
shipbuilding process using the value chain as an orienting framework.
Figure 4-3. Shipbuilding Global Value Chain
Source: Authors
The shipbuilding value chain is comprised of three major phases: pre-production, production,
and post-production. The pre-production phase of shipbuilding includes the phases of design and
project management. The production phase includes hull construction and equipment/systems
purchasing and integration. Hull construction components and activities are those required to
build the structure of the ship. All ships require these systems, however their relative importance
varies by ship type. Platform or standard systems/equipment account for a similar share of
equipment purchases on most types of ships. Ship-specific systems are those needed to make the
vessel perform the tasks for which it is designed and account for a larger share of total equipment
purchases Finally, post-production activities include in-service support (ISS) of the vessel after
its final construction, customer support. ISS may be comprised of repair, conversion and
maintenance activities. As a ship reaches the end of its service life, which for commercial vessels
10
See for example, www.kranendonk.com/shipbuilding/double-hull-welding-line
4-7is about 25 years, they are disassembled (“ship breaking”) and recycling/disposal occurs. Next
each major segment is described in turn.
Design: The major design phases, comprising of concept, preliminary, contract, and detailed
designs, have different objectives and may be conducted by different firms. In the concept phase,
the design process begins with a decision, usually by the ship owner, about the mission
requirements of the vessel. A ship architect can then begin the process of defining the parameters
and features of the ship. In the preliminary design phase, major equipment needs are determined,
and the general arrangement of the hull and equipment is made. In the contract design phase,
specification of the hull form is conducted and initial selection of systems and major equipment
suppliers is made. In the detailed design phase, the goal is to design the construction of the
vessel. This design phase includes designing the details of compartment arrangements,
specifications of equipment integration, shock specification and maintainability. For some
vessels,11 a full engineering analysis may be conducted, including analysis of the ship’s structure,
noise and vibration, weight and stability. This phase also covers construction standards,
including how factory automation, cutting of parts in the factory, and data management will be
conducted in a specific shipyard as part of the construction (or “build”) design.
Component production and subsystems assembly: The main systems and subsystems for a
ship are illustrated in Figure 4-4. The three main categories are:12
Hull: Hulls are built in sections called blocks, primarily from steel. Hull fabrication is a
labor-intensive process involving welding. Steel plates are cleaned, straightened, shaped,
and cut by specialized plate-burning machines to build the ship’s outer surface, or “skin”.
The framework, to which the skin is attached, consists of the ship’s structural
components, specifically the keel, girders, frames and beams.
Standard/Platform Systems: These, for the most part, will be found on all ships. They
are labeled here as ‘standard’ because they account for a lower, more stable share of
equipment purchases across ship types. These include ship operation, basic
accommodations, electrical systems/plant and electronic navigational and communication
systems, and auxiliary systems, notably HVAC and environmental pollution control.
Ship-Specific Systems: These depend on the intended use and purpose of the vessel. In
large commercial carriers, the propulsion system is the most important, because the
purpose of the ship is to move as quickly and efficiently as possible for long distances.
Alternatively, cargo handling equipment is more important on offshore production and
drilling vessels as these primarily remain stationary. Accommodations (e.g. furniture) are
more important in cruise ships and passenger vessels (Brodda, 2014). For research/survey
vessels, advanced sensing, navigation and communication technologies are needed (e.g.
radar apparatus, radio navigational aid devices, and radio remote control apparatus).
11
Military and passenger ships in particular.
12
Additional information on each of the assemblies and subassemblies may be found in Gereffi et al. (2013). An
alternative categorization is offered in (EC, 2014). It divides materials, major systems and services into three
segments: 1) external services and contractors; 2) materials (steel, pipes, ducts, paint/coatings); and 3) ship operation
systems, cargo handling and processing equipment, accommodation systems/equipment, propulsion/power
generation systems, auxiliary systems, electrical plants and electronic systems.
4-8Figure 4-4. Ship Systems and Subsystems
Shipbuilder
Hull/Structure Equipment
Ship‐Specific Ship‐Specific
Steel Propulsion Cargo Handling
Standard Standard
Paint/Coatings Pipes Electrical
Auxiliary
Accommodations
Ship Operation
Source: Authors; ship-specific subassemblies and components account for the largest shares of input costs, but the
specific ones of most importance to a particular ship depend on the type of ship produced.
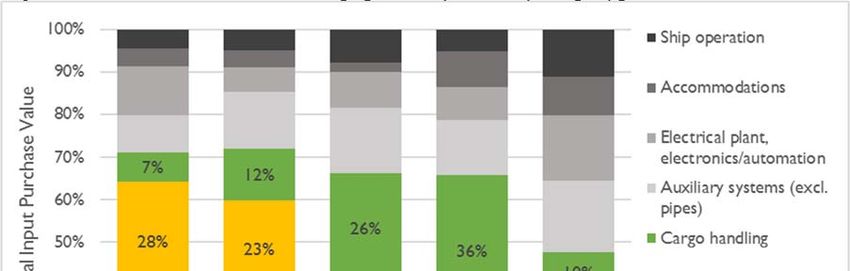
The distribution of physical input costs can be divided into two parts: materials (steel, pipes and
ducts, paint and coatings) and systems and equipment. Materials account for approximately 25%
of goods purchased and systems and equipment 75% (EC, 2014). These shares vary depending
on the size, configuration and purpose of the ship. Within materials, piping and paint make up
relatively stable shares of input costs across all ship types, and in equipment/systems, all ships
have similar shares for ship operation, accommodations,13 electrical plant and auxiliary systems.
The main variations are in steel/structural components, propulsion and cargo handling. Steel and
propulsion systems are the primary inputs for bulkers, containerships and oil tankers, whereas
cargo handling equipment is significant for LNG and offshore production vessels. Smaller
offshore vessels (AHTS and PSV) have the lowest share for material components, and the widest
variety/most eventually distributed need for equipment (Figure 4-5).
13
For passenger vessels, the share for accommodations is significantly higher, but these are not a particular focus in
this report.
4-9Figure 4-5. Cost of Materials and Equipment/Systems by Ship Types
Source: Authors, calculated from (EC, 2014), which is based on purchase forecasts for 2013-17. Note: The
“materials” category consists of steel, painting/coating, and pipes + ducts. The “equipment/systems” category
consists of all other physical input categories.
Ship assembly and integration: The main activities in assembly and integration are:
Hull blocking and assembly: Hull subassemblies are coated with protectant or
specialized marine coatings, welded together to form large prefabricated units, and
welded into position to form the ship. Once assembled, the ship is ready for launch and
outfitting.
Outfitting: After launch, the ship is berthed for completion. The main machinery, piping
systems, deck gear, lifeboats, accommodation equipment, insulation, rigging and deck
coverings are installed. The tendency is to schedule the outfitting of a vessel in sections,
to synchronize fitting work in the different sections and compartments.
Systems integration: Systems integrators install platform and ship-specific systems and
ensure cross-functionality of subsystems. As subsystems become increasingly complex,
the integrator’s role becomes increasingly important.
Production support services: Production support consists of materials selection and
procurement, and production planning and engineering.
Materials selection and procurement (sourcing): As the design for a ship develops, the
shipbuilder identifies suitable suppliers or subcontractors to supply items the shipyard
does not produce. Materials planning and procurement requires coordination between the
design and procurement functions of the shipbuilding value chain. The design team
provides the material needs and estimates for steel, pipes, and cables, subsystems,
mechanical and electronic components, and optional equipment, while the procurement
4-10team gathers technical product information to create a database of potential suppliers.
Selection of equipment in the design and build (DAB) phase has implications for post-
production services. For example, propulsion systems made by two manufacturers may
have similar prices, meet design specifications, yet have different maintenance costs and
schedules. Evaluating systems based on total cost of ownership is one reason why
coordination between the DAB team and ISS provider has become increasingly common.
A second reason is the creation of the technical data package; this “owner’s manual” lists
the specifications and maintenance schedules for the ship’s systems and subsystems.
Production planning and engineering: Given the long build time for large commercial
vessels, production planning is a critical and complex undertaking involving design,
assembly, and installation. It ensures that individual parts and equipment are allocated to
the appropriate stage in the production hierarchy of assemblies and subassemblies.
Production planning and engineering includes assembly and production planning, cut and
weld planning, and approval and release of designs. Specialized firms are often retained
for production planning and engineering, though some shipbuilders maintain this
capability in-house.
Post-production services and end-of-life: Post production services include in-service support
(ISS), conversion, and technical training. ISS provides the maintenance, conversion and repair of
the vessels, and generally occurs at planned intervals required by classification societies to
ensure the ships remain seaworthy and in good condition. ISS is the responsibility of the ship
owner, and typically performed by the original shipbuilder or specialized service provider
contracted to conduct maintenance and repair. Under normal operation, post production services
in the commercial shipbuilding sector account for approximately 30% of the selling price of a
ship. This percentage does not include significant conversions, for example, those required for
LNG bunkering or for meeting MARPOL standards. Technical training is needed to teach
personnel on the operation and maintenance of the vessels’ systems. The operational expense of
onboard training makes companies specialized in virtual reality and training simulation attractive
alternatives.
Shipbreaking and recycling: At the end of ship’s useful life, it is purchased by a shipbreaking
or demolition shipyard where it is disassembled. Largely due to the high quality standards for
materials used in shipbuilding, nearly all of a ship (estimated 95%) can be recycled or reused
(SBC, 2008). Ships are recycled primarily to recover their steel, which makes-up approximately
75% to 85% of a ship’s weight, or “lightweight.”14 Some steel plates and beams can be extracted
and directly reused by the construction industry or they can be re-rolled and reused (without
melting),15 and irregular scrap pieces can be melted into crude steel and reprocessed using an
electric arc furnace (EAF) method. Ship steel scrap is attractive for steelmaking because it is
high quality steel due to its high yield strength, ductility and impact strength. The annual average
of 3.6 million tons of melting steel scrap from the global ship recycling industry (not including
steel that is reused or only rerolled) accounts for around 1.5% of the global steel making industry
14
Lightweight (LDT) is the mass of the ship’s structure, propulsion machinery, other machinery, outfit and
constants. Another way of defining LDT is as the displacement of a ship when fully equipped and ready to proceed
to sea but with no crew, passengers, stores, fuel, ballast, water or cargo on board.
15
The re-rolling process is simpler and uses less energy compared to melting steel scrap.
4-11from old steel scrap (Mikelis, 2013). Other equipment still operational can be taken offboard and
repurposed in another vessel.
Types of Ships/Vessels and Ship Owners/Buyers
There are several types of oceangoing vessels that can be described in terms of purpose or the
type of cargo they are intended to carry (which relates to construction), size, and the main ship
buyers or owners. Ships are typically designed to serve one of the following purposes: transport
various types of cargo, conduct an activity at sea (extract oil or other resources, construction,
research), and defense. In terms of cargo, ships are designed to transport dry goods (bulk raw
materials, component/intermediate goods in containers, or large unpackaged general cargo),
liquids/gases (oil, natural gas/petroleum, chemicals, beverages), and/or people.
Categories of ship owners/buyers are aligned with the different ships functions and types of
cargo. Commercial shipping companies buy ships that transport dry goods (particularly
containerships), oil and gas companies purchase liquid/gas carriers and offshore oil exploration
units, and cruise lines purchase large passenger ships. Governments purchase a range of vessels
used to conduct various duties and activities related to defense (warships, destroyers, frigates,
corvettes, patrol vessels, fast attack crafts), research/survey (research vessels, icebreakers, and
search and rescue), offshore oil exploration, and smaller passenger vessels for domestic
transportation and shipping needs (Table 4-1).
The scope and terminology used to describe the shipbuilding industry varies based on the data
provider. For example, the term ‘tanker’ may refer to any ship carrying liquids/gas, including oil,
gas, chemicals or other products. Similarly, the term ‘cargo ship’ may combine containerships
and general cargo ships or even bulk carriers. Offshore vessels are often included in an ‘other’
category, however this also often includes large passenger ships, ferries, fishing boats or smaller,
multipurpose cargo/passenger vessels. Some sources include recreational vessels and boats (or
more generally smaller vessels less likely to be used to travel across the ocean), research vessels
or government/military-related production (see Box 4-1).
Table 4-1. Ship Types and Characteristics
Sub-Type/Alt. Type of Size (Unit, Range, Newbuild Price
Type Description
Names Cargo Terms) (US$, Mil, 2016)
DWT: 10-100,000
Unpackaged bulk cargo; Dry-
Bulk Handysize,
Bulkers separate areas if more than grains, $20-42
Carriers Handymax,
one product coal, ore
Panamax, Capesize
TEU: < 1-12,000
Carry load in truck-size Feeder,
Dry-
Container containers, in a technique Intermediate, Neo- $12-$109
containers
called containerization. Panamax, Post-
Panamax
Cu.M/m3: < 5-
Gas
160,000 $42-71;
LPG, LNG, LNG larger than LPG Liquid/Gas
SGC, MGC, LGC, $192
FSRU
Tankers VLGC
DWT: < 55-320,000
Oil/Crude Liquid/Gas Handy, Panamax, $33-85
Suezmax, VLCC,
4-12Sub-Type/Alt. Type of Size (Unit, Range, Newbuild Price
Type Description
Names Cargo Terms) (US$, Mil, 2016)
ULCC
DWT: < 25-125,000
Chemical/Prod
Liquid/Gas SR, SH, MR, LR1, --
uct
LR2
Cargo; other
Carry various forms of cargo
dry cargo;
or cargo and ≤ 12 fare paying # of cars
General barge; reefer
passengers (Pax). Barges are Dry/People Reefer: cubic feet RoRo: $45-58
Cargo (refrigerated);
non-propelled (must be towed RoRo: Lane m.
Pax/General/
or provide stationary support).
RoRo; RoRo
Carry passengers; for
transport purposes only or
Ferries, Cruise
Passenger where the voyage itself and People Cruise: # of berths
ships
the ship’s amenities are part of
the experience.
Generally below
size threshold to be
Fishing N/A
included. Small, 30
Other up to 100 meters
Designed for towing or
Tug pushing; increasing share used N/A
in the offshore segment.
Drillship: water
Designed for exploration and
depth
Offshore See Box extraction of natural gas and N/A
AHTS: HP
oil.
Dredger: GT
Source: Authors. Newbuild Prices: 2016 (Dec) based on average of all sizes: Clarksons (2017b).
Newbuilding prices increased during the early 2000s, but have declined across ship types since
2009 (Clarksons, 2017a; UNCTAD, 2011). The decline has more significant for bulkers and
mid-size containerships than tankers and LNG. LNG carriers are the most expensive (US$192
million) and bulkers are the least expensive (US$20-42 million). Oil tankers and LPG carriers
have similar price ranges (US$40-80 million), and containerships have the largest variation
based on size (US$12-109). Bulkers and general cargo ships can be constructed in roughly 6-9
months and tankers in 14-16 months. A large passenger ship or LNG/LPG carrier may take two
years to complete.
In terms of complexity, bulkers and general cargo ships are the most basic, followed by tankers,
then containerships, and lastly LNG/LPG carriers as the most complex (G. Collins & M. Grubb,
2008). Offshore vessels, particularly large platforms research vessels, can be quite complicated
and would be on par with LNG/LPG. The level of complexity is reflected in average newbuild
prices, time to complete, as well as the type and cost of materials. For instance, over half of the
cost of materials in bulkers and oil tankers are steel and engines, whereas LNG/LPG and
offshore have higher shares in ship-specific systems.
4.1.4. Global Production and Trade in the Shipbuilding GVC
Most commercial shipbuilding and construction activity occurs in three countries. Japan, Korea,
and China routinely account for over 90% of annual commercial ship production, a competitive
4-13advantage resulting from the continued development of block construction techniques during the
1980s in which large pieces of a ship are constructed on land before assembly, and more
recently, access to inexpensive inputs, including steel (China). Within the “big three” segments
of commercial shipbuilding - containerships, bulkers, and oil tankers - Japan and China
specialize in building containerships and bulkers, while Korea is especially competitive at
building tankers. European shipbuilding nations are specialized in passenger ships, dredgers, and
ice classed vessels, which are typically higher value vessels (per CGT) than other commercial
vessels. Italy, and to a lesser extent Germany, is particularly strong in designing and building
passenger cruise vessels, the Netherlands and Belgium are specialized in dredgers, while Norway
has particular strengths in designing and building ice-classed vessels and offshore vessels (EC,
2014). Shipbreaking, the demolition and scrapping of vessels, occurs primarily in South Asian
countries, especially Bangladesh, India, and Pakistan, and China.
Box 4-1. Unique Aspects of Shipbuilding Data
There are several caveats to measuring the size and scope of the global shipbuilding industry that are
important to take into consideration when evaluating this GVC.
The first is related to data providers. Generally, the primary source of industry statistics related to
production, trade, number of firms and employment is typically compiled by national statistical offices
and customs (trade) based on international classification systems. While these are available for
shipbuilding, the main sources used are private, third parties such as Clarkson, IHS, Lloyds, and Dewry
that have access to ship production data. Due to the strong regulatory requirements for oceangoing
commercial vessels, detailed production, ownership and service information must be collected by
international classification societies. This data is collected for safety purposes, but it also useful for
market research purposes. As such, several of these societies have separate units that sell this
information via a separate business unit. That data collected by these agencies covers the entire
population of shipyards (as opposed to samples in national statistics), and the level of detail is much
higher. All three types of data are used in this report, and efforts to point out differences are made when
possible.
Second, the size of any segment also varies depending on the unit of measurement; the market is
commonly described in terms of weight/carrying capacity of ships with common units including GT,
CGT, DWT or TEUs. Market statistics are also produced based on orders, completions and deliveries
(which can alter top categories and countries as well). The actual number of vessels produced and value
are less commonly used, however the importance of the relative segments and top companies changes
when using these indicators. Employment data also varies due to high use of temporary or contract
workers (subcontractors). The minimum size of a ship to be included in statistics from IHS, UNCTAD
and Clarkson’s is typically 100GT.
The third important feature is geographic concentration of both demand and supply. Production is highly
concentrated in a few countries, and a significant share of this is purchased by domestic buyers. As such,
production and trade data will provide different perspectives. Furthermore, ‘ship exports’ are convoluted
by the fact that ships are often ‘flagged’ by a country that is not the ship owner/buyer, and the fact that
ships are never ‘consumed’ in one country. Therefore, import statistics are not particularly pertinent.
Figure 4-6. Leading Producers and Exporters in Shipbuilding, 2015
4-14Sources for figures above: Completions from IHS (GT and #); Exports (UNComtrade)
Global Statistics on Shipbuilding
Deliveries (2016): 1,664 vessels; 66.3 million GT; 34.7 million CGT; 100.5 million DWT;
value: US$80.2 billion (Clarksons, 2017b)
Exports (2015): US$117 billion (UNComtrade, 2016)
Revenue (2016): US$175 billion (IBIS, 2016)
Production (Completions, 2015): 67.6 million GT; 2,870 ships (IHS, 2009-2016)
Production (Deliveries, 2015): 64.1 million GT (UNCTAD, 2016b); based on Clarkson
(UNCTAD matches Clarkson in 2014; IHS matches in 2015)
Contracted (2015): 38 million CGT (DSF, 2016)
Active Shipyards (2015): 730 (DSF, 2016)
Shipyards with new orders (2015): 240 (DSF, 2016)
The expansion of global new ship orders since the early 2000s was hit by the 2008-2009
economic crisis. New orders dropped from 170 million GT in 2007 to 34 million GT in 2009.16
The economic recovery since 2010 has rekindled demand for new ships, raising new orders to 77
million GT in 2015.17
16
Gross tonnage (GT), a measure of ship size, is calculated based on "the molded volume of all enclosed spaces of
the ship" and is used to determine a ship's manning regulations, safety rules, registration fees and port dues.
17
Based on IHS (formerly Lloyd’s Register) World Shipbuilding Statistics, which only includes ships 100GT or
over.
4-15Figure 4-7. World Ship Completions by Country (GT, million), 2003-15
Sources: IHS (2009-2016)
In terms of vessels completed, China (37%), Korea (34%), and Japan (19%) accounted for 91%
of the world’s approximately 68 million GT of ships completed in 2015 (see Figure 4-7). Korea
completed 358 ships totaling approximately 23.3 million GT, equivalent to 34.4% of the world’s
total tonnage (see Table 4-2).
Table 4-2. Top 10 Shipbuilding Countries (based on GT Completed), 2015
No. GT
GT Share No. GT
Rank Country No. ‘000 GT Share (000)/
(%) Change Change
(%) Ship
2015 2015 2015 2015 2010-15 2010-15 2015
World Total 2,870 67,566 -23% -30% 24
1 China 949 25,160 33.1 37.2 -33% -31% 27
2 Korea 358 23,272 12.5 34.4 -32% -27% 65
3 Japan 520 13,005 18.1 19.2 -10% -36% 25
4 Philippines 42 1,865 1.5 2.8 24% 61% 44
5 Taiwan 56 749 2.0 1.1 167% 29% 13
6 Vietnam 90 591 3.1 0.9 -32% 6% 7
7 Romania 39 485 1.4 0.7 -9% -21% 12
8 US 75 427 2.6 0.6 -1% 79% 6
9 Germany 10 384 0.3 0.6 -72% -59% 38
10 Brazil 32 361 1.1 0.5 52% 668% 11
Top 10 (based on GT) Share 76 98
Source: IHS (2016)
Regarding the type of vessels completed in 2015, product carriers dominated the market. Bulkers
(39%), containerships (26%), and oil tankers (9%) are the top three vessel types in terms of
world ship completions by gross tonnage (see Table and Figure). The share of LPG/LNG gas
carriers has been rising in recent years (based on GT and numbers), indicating the growing
markets for these vessel types. Offshore vessels account for less than 5% of GT, however, they
are much more important based on value.
4-16Table 4-3. World Completions by Type (No. & GT), 2015
No. GT
GT GT Share No. GT
Rank Type No. Share (000)/ Countries
(‘000) (%) Change Change
(%) Ship
2015 2015 2015 2015 2010-15 2010-15 2015
World Total 2,870 67,566 -23% -30% 24
China,
1 Bulker 645 26,520 22% 39% -35% -39% 41
Japan
2 Container ship 212 17,339 7% 26% -18% 18% 82 Korea
3 Other Dry Cargo 332 3,876 12% 6% -42% -49% 12 China
4 Oil Tanker 130 6,384 5% 9% -61% -66% 49 Korea
5 LPG/LNG (Gas) 114 5,226 4% 8% 30% 42% 46 Korea
6 Chemical Tanker 208 4,588 7% 7% -36% 1% 22 China
7 Miscellaneous 1,182 2,976 41% 4% 3% 16% 3
8 Passenger Ship 47 656 2% 1% 4% -48% 14
Bulker/Containership/Cargo 41% 71%
Tankers (oil, gas, chemical) 16% 24%
Offshore 2,500 4% 4%
Source: IHS (2016); p. 7, p. 35 (for offshore). Offshore classified under ‘miscellaneous’ in IHS data, however
Clarkson’s includes offshore as a category.
Figure 4-8. World Ship Completions, Shares by Type (GT), 2000-15
Source: IHS (2016)
A majority (63%) of the world’s commercial shipping fleet, including oil tankers and bulk
carriers, is under 10 years of age, 26% is between 10-19 years old, with the balance (11%) 20
years or older (IHS, 2016). The average in-service life for commercial vessels is 23 years, with
few ships remaining in-service after 25 years (OECD, 2015a). World disposals peaked in 2012,
with 38.4 million GT being scrapped. Bangladesh, India, China, Turkey and Pakistan are the
leading countries for shipbreaking and disposal.
4-17Global ship exports
Global exports of ships were US$117 billion in 2015.18 The effect of the economic recession was
noticed and disruptive to both trade in ships and new orders, although many shipbuilders are still
completing orders made prior to the global financial crisis.19
Table 4-4. Top 10 Ship Exporters by Value & Year, 2007-2015
Exports (US$, Billions) Share of World Ship Exports (%)
Exporter
2007 2010 2012 2014 2015 2007 2010 2012 2014 2015
Total 88 156 140 123 117
Korea 27 47 38 38 38 30% 30% 27% 31% 33%
China 12 40 39 25 28 14% 26% 28% 20% 24%
Japan 15 26 22 13 11 17% 17% 16% 10% 10%
Poland 3 3 4 5 5 4% 2% 3% 4% 4%
Germany 3 5 3 4 4 4% 3% 2% 3% 4%
India 1 4 4 5 4 1% 3% 3% 4% 3%
Saudi Arabia 1 1 2 2 2 1% 0% 1% 2% 2%
Brazil 1 0 2 2 2 1% 0% 1% 2% 2%
Netherlands 1 1 1 2 2 2% 1% 1% 1% 2%
US 1 1 2 1 2 1% 0% 1% 1% 1%
Top 10 (in 2015) 80 140 124 104 107 75% 81% 83% 79% 85%
Source: UNComtrade (2016)
Korea is the top ship exporter whereas China is the top producer (based on GT); at least one-
third of China’s production is for national buyers.
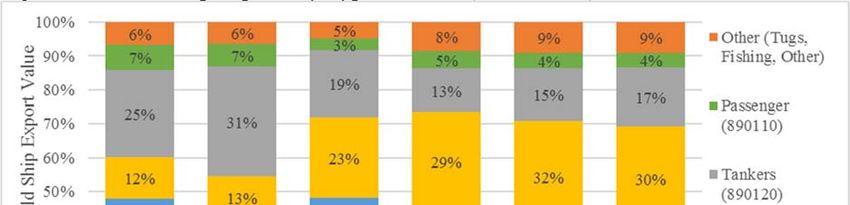
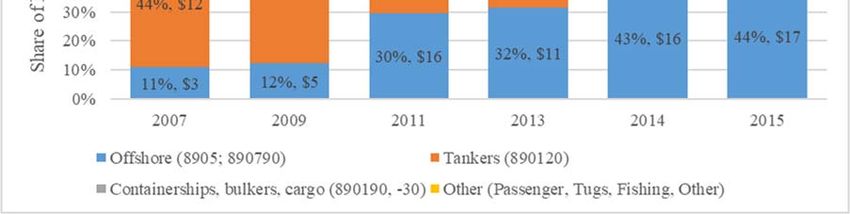
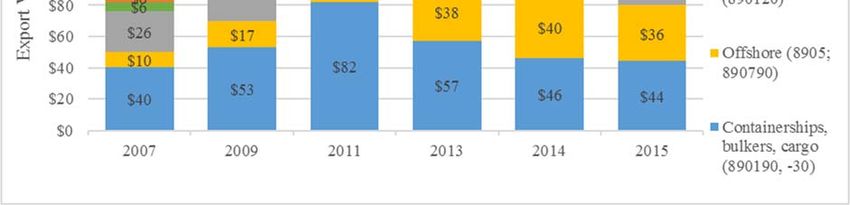
Figure 4-9 shows the world’s ship exports by vessel type. As with production,
containerships/bulkers and tankers are two of the leading categories in exports. However,
offshore ships account for a much larger share of the market based on value than by GT as these
are smaller, higher value vessels (IBIS, 2016). They also account for a larger share because more
are produced for foreign customers than domestic buyers.
18
These and following export figures were compiled from UNComtrade, unless otherwise stated.
19
The typical production time varies by the type of ship; a bulk cargo ship takes 6-9 months to build while a cruise
or LNG ship takes up to 2 years or more for construction (European Commission, 2003, p. 11).
4-18You can also read