A Comprehensive Guide to Graph Algorithms in Neo4j - Mark Needham & Amy E. Hodler
←
→
Page content transcription
If your browser does not render page correctly, please read the page content below

The #1 Platform for Connected Data

White Paper

A Comprehensive Guide to
Graph Algorithms in Neo4j
Mark Needham & Amy E. Hodler

                                                        neo4j.com
The #1 Platform for Connected Data

Ebook

TABLE OF CONTENTS

Part I: Connected Data and
Graph Analysis              3
                                  A Comprehensive Guide
Making Sense of
Connected Data              4
                                  to Graph Algorithms
                                  Mark Needham, Developer Relations Engineer
The Rise of Graph Analytics 8    Amy E. Hodler, Director, Graph Analytics and AI Programs
Neo4j Graph Analytics       14

Part II: Graph Algorithms
in Neo4j                    17

Graph Algorithm Concepts 18      Preface
                                  Connectivity is the single most pervasive characteristic of today’s networks and systems.
The Neo4j Graph
Algorithms Library          20   From protein interactions to social networks, from communication systems to power grids,
                                  and from retail experiences to supply chains – networks with even a modest degree of
Pathfinding and                   complexity are not random, which means connections are not evenly distributed nor static.
                                  This is why simple statistical analysis alone fails to sufficiently describe – let alone predict
Graph Search Algorithms     24
                                  – behaviors within connected systems. Consequently, most big data analytics today do
                                  not adequately model the connectedness of real-world systems and have fallen short in
Centrality Algorithms       34   extracting value from huge volumes of interrelated data.

                                  As the world becomes increasingly interconnected and systems increasingly complex,
Community Detection
                                  it’s imperative that we use technologies built to leverage relationships and their dynamic
Algorithms                  52
                                  characteristics. Not surprisingly, interest in graph data science has exploded because it
                                  was explicitly developed to gain insights from connected data. Graph analytics reveal the
Graph Algorithms                  workings of intricate systems and networks at massive scales – not only for large labs but
in Practice                 71   for any organization. Graph algorithms are processes used to run calculations based on
                                  mathematics specifically created for connected information.
Conclusion                  79   We are passionate about the utility and importance of graph analytics as well as the joy of
                                  uncovering the inner workings of complex scenarios. Until recently, adopting graph analytics
Appendix A:                       required significant expertise and determination, since tools and integrations were difficult
Performance Testing         80   and few knew how to apply graph algorithms to their quandaries. It is our goal to help change
                                  this. We wrote this ebook to help organizations better leverage graph analytics so they make
                                  new discoveries and develop intelligent solutions faster.
Appendix B: Installing the
Neo4j Graph Algorithms            While there are other graph algorithm libraries and solutions, we’ve chosen to focus on
Library                     81   the graph algorithms in the Neo4j platform. However, you'll find this guide helpful for
                                  understanding more general graph concepts regardless of what graph technology you use.

1                                                                                                                       neo4j.com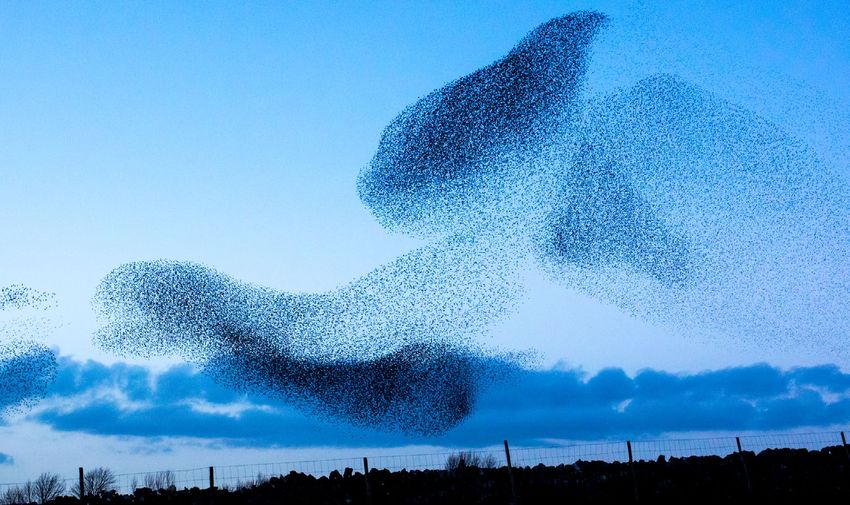
A Comprehensive Guide to Graph Algorithms in Neo4j

"Graph analysis is              How to Use This Ebook
                                This ebook is written in two parts. For product managers and solution owners, Part I provides
 possibly the single            an overview of graph algorithms and their uses. In these chapters, the background of
 most effective                 graph analytics is used to illustrate basic concepts and their relevance to the modern data
 competitive                    landscape.

 differentiator for             Part II, the bulk of this ebook, is written as a practical guide to getting started with graph
 organizations                  algorithms for engineers and data scientists who have some Neo4j experience. It serves
                                as a detailed reference for using graph algorithms. At the beginning of each category of
 pursuing data-driven           algorithms, there is a reference table to help you quickly jump to the relevant algorithm.
 operations and
                                For each algorithm, you’ll find:
 decisions.”
                                  • An explanation of what the algorithm does
           – Gartner Research     • Use cases for the algorithm and references to read more about them

                                  • Walkthroughs with example code providing concrete ways to use the algorithm

                                In the reference section, you’ll find notes, tips and code.

                                       Note: Details about the workings of the algorithm that you may want to know about.

                                       Tip: Details you should be aware of with regard to the algorithm, such as the types of
                                 !     graphs it works best with or values that are not permitted.

                                       Code examples, node names and relationships are shown in a code font,
                                       Courier New.

                                If you have any questions or need any help with any of the material in this ebook, send us an
                                email at devrel@neo4j.com.

                                Acknowledgments
                                We’ve thoroughly enjoyed putting together the material for this ebook and would like to
                                thank all those who assisted. We’d especially like to thank Michael Hunger for his guidance
                                and Tomaz Bratanic for his keen research. Finally, we greatly appreciate Yelp for permitting
                                us to use its rich dataset for powerful examples and Tomer Elmalem for brainstorming with
                                us on ideas.

2                                                                                                                      neo4j.com
A Comprehensive Guide to Graph Algorithms in Neo4j

Part I:
Connected Data and Graph Analysis

3                                                    neo4j.com
A Comprehensive Guide to Graph Algorithms in Neo4j

                           Chapter 1
                           Making Sense of Connected Data
The Latin root of          Connected Data Today
valence is the same        There are four to five “Vs” often used to help define big data (volume, velocity, variety, veracity
as value, valere, which    and sometimes value) and yet there’s almost always one powerful “V” missing: valence. In
                           chemistry, valence is the combining power of an element; in psychology, it is the intrinsic
means to be strong,
                           attractiveness of an object; and in linguistics, it’s the number of elements a word combines.
powerful, influential or
                           Although valence has a specific meaning in certain disciplines, in almost all cases there is an
healthy.                   element of connection and behavior within a larger system. In the context of big data, valence
                           is the tendency of individual data to connect as well as the overall connectedness of datasets.
                           Some researchers measure the valence of a data collection as the ratio of connections to the
                           total number of possible connections. The more connections within your dataset, the higher
                           its valence.

                           Your data wants to connect, to form new data aggregations and subsets, and then connect
                           to more data and so forth. Moreover, data doesn't arbitrarily connect for its own sake; there's
                           significance behind every connection it makes. In turn, this means that the meaning behind
                           every connection is decipherable after the fact. Although this may sound like something
                           that’s mainly applicable in a biological context, most complex systems exhibit this tendency.
                           In fact, we can see this in our daily lives with a simple example of highly targeted purchase
                           recommendations based on the connections between our browsing history, shopping habits,
                           demographics, and even current location. Big data has valence – and it’s strong.

                           Scientists have observed the growth of networks and the relationships within them for some
                           time. Yet there is still much to understand and active work underway to further quantify and
                           uncover the dynamics behind this growth. What we do know is that valence increases over
                           time but not uniformly. Scientists have described preferential attachment (for example, the
                           rich get richer) as leading to power-law distributions and scale-free networks with hub and
                           spoke structures.

                                                                  Preferential attachment means that the more connected
                                                                  a node is, the more likely it is to receive new links.
                                                                  Source: Wikipedia

4                                                                                                                 neo4j.com
A Comprehensive Guide to Graph Algorithms in Neo4j

Highly dense and lumpy data networks tend to develop, in effect growing both your big data
and its complexity. This is significant because densely yet unevenly connected data is very
difficult to unpack and explore with traditional analytics. In addition, more sophisticated
methods are required to model scenarios that make predictions about a network’s evolution
over time such as how transportation systems grow. These dynamics further complicate
monitoring for sudden changes and bursts, as well as discovering emergent properties. For
example, as density increases in a social group, you might see accelerated communication
that then leads to a tipping point of coordination and a subsequent coalition or, alternatively,
subgroup formation and polarization.

This data-begets-data cycle may sound intimidating, but the emergent behavior and patterns
of these connections reveal more about dynamics than you learn by studying individual
elements themselves. For example, you could study the movements of a single starling but
until you understood how these birds interact with each other in a larger group, you wouldn't
understand the dynamics of a flock of starlings in flight. In business you might be able to
make an accurate restaurant recommendation for an individual, but it’s a significant challenge
to estimate the best group activity for seven friends with different dietary preferences and
relationship statuses. Ironically, it’s this vigorous connectedness that uncovers the hidden
value within your data.

                                                                                                   Economist Jeffrey
                                                                                                   Goldstein defined
                                                                                                   emergence as "the
                                                                                                   arising of novel and
                                                                                                   coherent structures,
                                                                                                   patterns and
                                                                                                   properties during
                                                                                                   the process of self-
                                                                                                   organization in
                                                                                                   complex systems."

Economist Jeffrey Goldstein defined emergence as "the arising of novel and coherent
structures, patterns and properties during the process of self-organization in complex
systems.” That includes the common characteristics of:

    • Radical novelty (features not previously observed in systems);

    • Coherence or correlation (meaning integrated wholes that maintain themselves over
      some period of time);

    • A global or macro "level" (i.e., there is some property of "wholeness");

    • Being the product of a dynamical process (it evolves); and

    • An ostensive nature (it can be perceived). (Source: Wikipedia)

5                                                                                                                neo4j.com
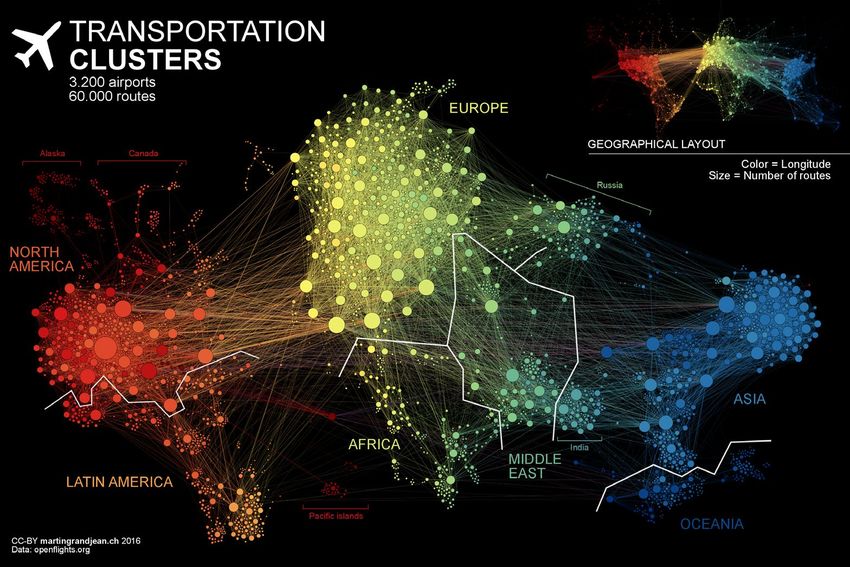
A Comprehensive Guide to Graph Algorithms in Neo4j For today’s connected data, it’s a mistake to scrutinize data elements and aggregations for insights using only simple statistical tools because they make data look uniform and they hide evolving dynamics. Relationships between data are the linchpin of understanding real-world behaviors within – and of – networks and systems. Network Science & the Rise of Graph Models Networks are a representation, a tool to understand complex systems and the complex connections inherent in today’s data. For example, you can represent how a social system works by thinking about interactions between pairs of people. By analyzing the structure of this representation, we answer questions and make predictions about how the system works or how individuals behave within it. In this sense, network science is a set of technical tools applicable to nearly any domain, and graphs are the mathematical models used to perform analysis. Networks also act as a bridge for understanding how microscopic interactions and dynamics lead to global or macroscopic regularities as well as correlate small scale clusters to a larger scale element and shape projection. Networks bridge between the micro and the macro because they represent exactly which things are interacting with each other. It's a common assumption that the average of a system is sufficient because the results will even out. However, that's not true. For example, in a social setting, some people interact heavily with others while some only interact with a few. An averages approach to data completely ignores the uneven distributions and locality within real-world networks. Transportation networks illustrate the uneven distribution of relationships and groupings. Source: Martin Grandjean An extremely important effort in network science is figuring out how the structure of a network shapes the dynamics of the whole system. Over the last 15 years we’ve learned that for many complex systems, the network is important in shaping both what happens to individuals within the network and how the whole system evolves. 6 neo4j.com

A Comprehensive Guide to Graph Algorithms in Neo4j

Graph analytics, based on the specific mathematics of graph theory,
                                                                                                      Propagation
examine the overall nature of networks and complex systems through their                               Pathways
connections. With this approach, we understand the structure of connected
systems and model their processes to reveal hard-to-find yet essential
information: propagation pathways, such as the route of diseases or network
failures; flow capacity and dynamics of resources, such as information or
electricity; or the overall robustness of a system. Understanding networks and             Interactions              Flow &
the connections within them offers immense potential for breakthroughs by                   & Resiliency            Dynamics
unpacking structures and revealing patterns used for science and business
innovations as well as for safeguarding against vulnerabilities, especially those
unforeseen within the labyrinth.

The Power of Graph Algorithms
Researchers have found common underlying principles and structures across a wide variety of networks and have figured out how to
apply existing, standard mathematical tools (i.e., graph theory) across different network domains.

But this raises questions: How do people who are not mathematicians conversant in network science apply graph analytics
appropriately? How can everyone learn from connected data across domains and use cases?

This is where graph algorithms come into play. In the simplest terms, graph algorithms are mathematical recipes based on graph
theory that analyze the relationships in connected data.

Even a single graph algorithm has many applications across multiple use cases. For example, the PageRank graph algorithm –
invented by Google founder Larry Page – is useful beyond organizing web search results. It’s also been used to study the role of
species in food webs, to research telomeres in the brain, and to model the influence of particular network components in just about
every industry.

                                                                    In studying the brain, scientists found that the
                                                                    lower the PageRank of a telomere, the shorter it
                                                                    was – and there's a strong correlation between
                                                                    short telomeres and cellular aging.

Graph algorithms play a powerful role in graph analytics, and the purpose of this ebook is to showcase that role. But first let’s step
back and look at the rise of graph analytics as a whole and its many applications in exploring connected data.

7                                                                                                                              neo4j.com
A Comprehensive Guide to Graph Algorithms in Neo4j

"The tools of graph                     Chapter 2
 theory can be utilized
 in order to analyze                    The Rise of Graph Analytics
 the networks and
 obtain a better                        The Roots of Graph Analytics
 understanding of their                 Graph analytics has a history dating back to 1736, when Leonhard Euler solved the “Seven
 overall construction.                  Bridges of Königsberg” problem. The problem asked whether it was possible to visit all
                                        four areas of a city, connected by seven bridges, while only crossing each bridge once. It
 This approach                          wasn’t. With the insight that only the connections themselves were relevant, Euler set the
 has led to several                     groundwork for graph theory and its mathematics.
 groundbreaking
 discoveries on the
 nature of networks,
 crossing fields of
 research from biology,
 to social science and
 technology.”
                                        Source: Wikipedia
             – Albert-László Barabási
Director, Center for Complex Network
    Research, Northeastern University   But graph analytics did not catch on immediately. Two hundred years would pass before the
                                        first graph textbook was published in 1936. In the late 1960s and 1970s, network science and
                                        applied graph analytics really began to emerge.

                                        In the last few years, there’s been an explosion of interest in and usage of graph
                                        technologies. Demand is accelerating based on a need to better understand real-world
                                        networks and forecast their behaviors, which is resulting in many new graph-based solutions.

                                        Why Now? Forces Fueling the Rise in Graph Analytics
                                        This growth in network science and graph analytics is the result of a combined shift in
                                        technical abilities, new insights, and the realization that existing business intelligence systems
                                        and simple statistics fail to provide a complete picture of real-world networks. Several forces
                                        are driving the rise in graph analytics.

                                        First of all, we’ve seen real-world applications of graph analytics and their impact on us all.
                                        The power of connected data for business benefit has been demonstrated in disruptive
                                        success stories such as Google, LinkedIn, Uber, and eBay, among many others.

                                        At the same time, digitization and the growth in computing power (and connected
                                        computing) have given us an unprecedented ability to collect, share and analyze massive
                                        amounts of data. But despite the masses of data they have, organizations are frustrated with
                                        the unfulfilled promises of big data and their inability to analyze it.

                                        The majority of analytics used today handle specific, well-crafted questions efficiently but fall
                                        short in helping us predict the behavior of real systems, groups and networks. Most networks
                                        defy averages and respond nonlinearly to changes. As a result, more businesses are turning
                                        to graph analytics, which are built for connected data and responsive to dynamic changes.

8                                                                                                                             neo4j.com
A Comprehensive Guide to Graph Algorithms in Neo4j

In addition, there’s been a recognition of how graphs enhance machine learning and provide        "We need to combine
a decision-making framework for artificial intelligence. From data cleansing for machine
learning to feature extraction in model development to knowledge graphs that provide rich
                                                                                                   transactional and
context for AI, graph technology is enhancing AI solutions. This is described in more detail       analytic systems into
later in this chapter.                                                                             transalytic systems
                                                                                                   and stop thinking
Bringing Together Analytics & Transactions                                                         about these as two
Historically, the worlds of analytics (OLAP) and transactions (OLTP) have been siloed              separate systems.
despite their interdependence (analytics drives smarter transactions, which creates new            2018 is going to be
opportunities for analysis), which is especially true with connected data.
                                                                                                   the year we’ll see
This line has been blurred in recent years and modern data-intensive applications combine          major corporations
real-time transactional queries with less time-sensitive analytics queries. The merging
of analytics and transactions enables continual analysis to become ingrained in regular
                                                                                                   collapse these two
operations. As data is gathered – from point-of-sale (POS) systems, from manufacturing             systems together,
equipment, from IoT devices, or from wherever – analytics at the moment and location               so that you have
support an application’s ability to make real-time recommendations and decisions. This
blending of analytics and transactions was observed several years ago, and terms to describe
                                                                                                   simplified architecture
this blurring and integration include “Transalytics” and Hybrid Transactional and Analytical       and can move at the
Processing (HTAP).                                                                                 pace of business.”
“[HTAP] could potentially redefine the way some business processes                                                          – Bill Powell,
are executed, as real-time advanced analytics (for example, planning,                                Director of Enterprise Architecture,
forecasting and what-if analysis) becomes an integral part of the                                 Automotive Resources International (ARI)

process itself, rather than a separate activity performed after the
fact. This would enable new forms of real-time business-driven
decision-making process. Ultimately, HTAP will become a key enabling
architecture for intelligent business operations.”
                                                                                      – Gartner

Graph algorithms provide the means to understand, model and predict complicated
dynamics such as the flow of resources or information, the pathways through which
contagions or network failures spread, and the influences on and resiliency of groups. Neo4j
brings together analytics and transactional operations in a native graph platform, helping not
only uncover the inner nature of real-world systems for new discoveries, but also enabling
faster development and deployment of graph-based solutions with more closely integrated
processing for transactions and analytics.

                                                               According to Gartner’s
                                                               Magic Quadrant
                                                               survey, the biggest
       Analytics              Transactions                     reason for using the
                                                               Neo4j Graph Platform
                                                               "is to drive innovation.”

       Enrichment,               Operational
    Discovery & Design            Activities

9                                                                                                                          neo4j.com
A Comprehensive Guide to Graph Algorithms in Neo4j
Use Cases for Graph Transactions & Analytics
Today’s most pressing data challenges center around connections, not just tabulating
discrete data. Graph analytics accelerate breakthroughs across industries with more
intelligent solutions.
eBay uses graphs to deliver real-time, personalized user experiences and recommendations.
Cybersecurity and fraud systems correlate network, social and IoT data to uncover patterns.
More accurate modeling and decisioning for a range of dynamic networks drives use cases
from subsecond packaging of financial commodities and routing logistics to IT service
assurance to predicting the spread of epidemics. Graph technologies help businesses with
many practical use cases across industries and domains, a few of which are highlighted in the
sections that follow.
Real-Time Fraud Detection
Traditional fraud prevention measures focus on discrete data points such as specific
account balances, money transfers, transaction streams, individuals, devices or IP addresses.
However, today’s sophisticated fraudsters escape detection by forming fraud rings comprised
of stolen and synthetic identities. To uncover such fraud rings, it is essential to look beyond
individual data points to the connections that link them. Connections are key to identifying
and stopping fraud rings and their ever-shifting patterns of activities. Graph analytics enable
us to find these patterns and shows us that indeed, fraud has a shape.
Real-Time Recommendations
Graph-powered recommendation engines help companies personalize products, content
and services by contextualizing a multitude of connections in real time. Making relevant
recommendations in real time requires the ability to correlate product, customer, historic
preferences and attributes, inventory, supplier, logistics and even social sentiment data.
Moreover, a real-time recommendation engine requires the ability to instantly capture any
new interests shown during the customer’s current visit – something that batch processing
can’t accomplish.
360° View of Data
As businesses become more customer centric, it has never been more urgent to tap the
connections in your data to make timely operational decisions. This requires a technology
to unify your master data, including customer, product, supplier and logistics information to
power the next generation of ecommerce, supply chain and logistics applications.
Organizations gain transformative real-time business insights from relationships in
master data when storing and modeling data as a graph. This translates to highlighting
time- and cost-saving queries around data ownership, customer experience and support,
organizational hierarchies, human capital management, and supply chain transparency.
10 neo4j.comA Comprehensive Guide to Graph Algorithms in Neo4j
A flexible graph database model organizes and connects all of an organization's master data
to provide a live, real-time 360° view of customers.
Streamline Regulatory Compliance
Graph technology offers an effective and efficient way to comply with sweeping regulations like
the EU’s General Data Protection Regulation (GDPR), which requires that businesses connect
all of the data that they have about their customers and prospects. Organizations manage
enterprise risk by providing both the user-facing toolkit that allows individuals to curate their
own data records and the data lineage proof points to demonstrate compliance to authorities.
Management & Monitoring
of Complex Networks
Graph platforms are inherently suitable for making sense of complex interdependencies
central to managing networks and IT infrastructure. This is especially important in a time of
increasing automation and containerization across both cloud and on-premises data centers.
Graphs keep track of these interdependencies and ensure that an accurate representation of
operations is available at all times, no matter how dynamic the network and IT environment.
Identity & Access Management
To verify an accurate identity, the system needs to traverse through a highly interconnected
dataset that is continually growing in size and complexity as employees, partners and
customers enter and leave the system. Users, roles, products and permissions are not only
growing in number but also in matrixed relationships where standard “tree” hierarchies are
less relevant. Traditional systems no longer deliver real-time query performance required
by two-factor authentication systems, resulting in long wait times for users. Using a graph
database for identity and access management enables you to quickly and effectively track
users, assets, devices, relationships and authorizations in this dynamic environment.
Social Applications or Features
Social media networks are already graphs, so there’s no point converting a graph into tables
and then back again by building a social network on an RDBMS. Having a data model that
directly matches your domain model helps you better understand your data, communicate
more effectively and avoid needless work. A graph database such as Neo4j enables you to
easily leverage social connections or infer relationships based on user activity to power your
social network application or add social features to internal applications.
These are just a few of the use cases that are fueled by graph technology. Next we’ll look at
how graphs are supporting an emerging category of algorithms and applications based on AI.
11 neo4j.comse Icons for:
me Fraud Detection
A Comprehensive Guide to Graph Algorithms in Neo4j
me Recommendations
ew of data
mline Regulatory Compliance
gement and Monitoring of Complex Networks
y and Access Management
Graph Technology & AI Applications
Applications or Features
Graph technologies are the scaffolding for building intelligent applications, enabling more accurate predictions and faster
decisions. In fact, graphs are underpinning a wide variety of artificial intelligence (AI) use cases.
Graph-Accelerated AI Development
Knowledge Graphs & Model Enhancement
Provide rich context for AI Faster, more accurate development
Graph Execution of AI
AI Visibility & Decision Tracking
Human-friendly graph visualization For real-time execution and
decisioning lineage
Global Graph Analtyics
Connected AI System of Record Graph algorithms to percolate global
Maintain a source of truth of AI composites structures and patterns that then provide
graph-driven theories
Knowledge Graphs
Andrew Ng, a preeminent thought leader in the field, includes knowledge graphs as one
of the five main areas of AI. Knowledge graphs represent knowledge in a form usable by
machines.
Graph analysis surfaces relationships and provides richer and deeper context for prescriptive
analytics and AI applications like TextRank (a PageRank derivative) alongside natural language
processing (NLP) and natural language understanding (NLU) technologies. For example,
in the case of a shopping chatbot, a knowledge graph representation helps an application
intelligently get from text to meaning by providing the context in which the word is used
(such as the word “bat” in sports versus zoology).
Machine Learning Model Enhancement & Accelerated AI
Graphs are used to feed machine learning models and find new features to use for training,
subsequently speeding up AI decisions. Graph centrality algorithms such as PageRank
identify influential features to feed more accurate machine learning models and measurable
predictive lift. Graph analysis computes Boolean (yes/no) answers in real time and
continuously provides them as a tensor for AI recalculation and scoring.
12 neo4j.comA Comprehensive Guide to Graph Algorithms in Neo4j
"The major areas of Graph Execution of AI & Decision Tracking
An operational graph – replacing a rules engine to run AI – is a natural, next step for
artificial intelligence intelligent applications. As coding AI systems in graphs becomes a norm, it will enable the
are speech, NLP, tracking of AI decisions. This kind of decision tree lineage is essential for adoption and
computer vision, maintenance of AI logic in critical applications.
machine learning, Global Graph Analytics for Theory Development
[and] knowledge Graph analytics lift out global structures and reveal patterns in your data – without you
requiring any prior knowledge of the system. For example, community detection and
graph.” other algorithms are used to organize groups, suggest hierarchies, and predict missing
or vulnerable relationships. In this way, you are essentially using graph-driven theory
– Andrew Ng development that infers micro and macro behaviors.
AI Visibility
The adoption of AI in part depends largely on the ability to trust the results. Human-friendly
graph visualizations display or explain machine learning processes that are often never
exposed within ML’s “black box.” These visualizations serve as an abstraction to accelerate
data scientists’ work and to provide a visual record of how a system’s logic has changed over
time. Visualizations help explain and build confidence in and comfort with AI solutions.
System of Record for AI Connections
Graphs serve as a source of truth for all your related AI components to create a pipeline for
iterative tasks. They automate the sourcing and capture of related AI components so that
data scientists focus on analysis and more easily share frameworks.
What Makes a Machine Intelligent?
While AI is the headliner, there are actually subsets of the technology
that can be applied to solving human problems in different ways.
Artificial Intelligence (AI) Machine Learning (ML)
A process where a computer Algorithms that allow
solves a task in a way that computers to learn from
mimics human behavior. examples without being
Today, narrow AI – when a explicitly programmed.
machine is trained to do Artificial Intelligence
one particular task – is
becoming more widely
used, from virtual
assistants to self-driving
cars to automatically Machine Learning
tagging your friends
in your photos on
Deep Learning (DL)
Facebook.
A subset of ML that uses
deep artificial neural
networks as models and
Deep Learning does not require feature
engineering.
Source: Curt Hopkins
13 neo4j.comA Comprehensive Guide to Graph Algorithms in Neo4j
Chapter 3 “In fact, the rapid rise
of graph technologies
Neo4j Graph Analytics may signal that data
At a fundamental level, a native graph platform is required to make it easy to express connectedness is
relationships across many types of data elements. To succeed with connected data
indeed a separate
applications, you need to traverse these connections at speed, regardless of how many hops
your query takes. paradigm from the
model consolidation
A graph platform must also offer a variety of skill-specific tools for business users, solution
developers and data scientists alike. Each user group has different needs to visualize happening across the
connectedness, explore query results and update information. rest of the NoSQL
landscape.”
– Frost & Sullivan
A graph platform like Neo4j offers an efficient means for data scientists and solutions teams
to move through the stages of discovery and design.
First, when exploring a concept, teams look for broad patterns and structures best served
by global analysis. They need the ability to easily call upon packaged procedures and
algorithms. Organizations want tools to identify communities, bottlenecks, influence points
and pathways. In addition, a supported library of algorithms helps ensure that results are
consistent by reducing variability introduced by many individual procedures.
In the next phase of solution modeling, a streamlined process becomes extremely important
as teams must test a hypothesis and develop prototypes. And the iterative, continuous
nature of the above workflow heightens the need for extremely efficient tools with fast
feedback loops.
Teams will be using various data sources and tools, so a common, human-friendly way to
express connections and leverage popular tools is essential.
14 neo4j.comA Comprehensive Guide to Graph Algorithms in Neo4j
Connections-First
Native Graph Database Query Language
Never lose relationships Declarative and easy to read
Analytics Robust
Integration ANALYTICS Procedures
Streamline Extensive, trusted
workflows code resource
Optimized Algorithms
Reveal groups, influences and paths
Neo4j offers a growing, open library of graph algorithms that are optimized for fast results.
These algorithms reveal the hidden patterns and structures in your connected data around
community detection, centrality and pathfinding with a core set of tested and supported
algorithms.
Finds the shortest
path or evaluates route
Pathfinding availability and quality
Community
Centrality
Detection
Determines the Evaluates how a
importance of distinct group is clustered
nodes in the network or partitioned
Graph algorithm types
Neo4j graph algorithms are simple to apply so data scientists, solution developers and
operational teams can all use the same graph platform.
Neo4j graph algorithms are efficient so you analyze billions of relationships and get results
in seconds to minutes, or in a few hours for more complicated queries that process large
amounts of connected data.
15 neo4j.comA Comprehensive Guide to Graph Algorithms in Neo4j The following table offers a sampling of problems and the specific graph algorithms that have been used to solve them. Challenges & Graph Algorithms That Have Been Used to Solve Them1 Challenge Algorithm Algorithm Type Figure out traffic load capacity and plan All Pairs Shortest Path Pathfinding distribution or logistics in an urban area Create a low-cost tour of a travel Minimum Weight Pathfinding destination Spanning Tree Identify the most influential machine PageRank Centrality learning features for extraction and model updates Separate the fraudsters from the Weighted Degree Centrality legitimate users in an online auction Centrality Identify the bridge points that connect Betweenness Centrality Centrality separate groups Determine the delivery ETA for a Closeness Centrality Centrality package Find potential duplicate records Union Find Community Detection Figure out dangerous interactions Label Propagation Community Detection between prescription drugs Research structures in the brain Louvain Modularity Community Detection 1. This list offers inspiration about the types of problems that graph algorithms have solved. Inclusion on this list does not imply that the work in question was done using Neo4j. 16 neo4j.com
A Comprehensive Guide to Graph Algorithms in Neo4j

Part II:
Graph Algorithms in Neo4j

17                                                   neo4j.com
A Comprehensive Guide to Graph Algorithms in Neo4j

“Graphs are one                  Chapter 4
 of the unifying
 themes of computer              Graph Algorithm Concepts
 science – an abstract
 representation                  Traversal
 that describes                  The most fundamental graph task is to visit nodes and relationships in a methodical way;
 the organization                this is called traversing a graph. Traversal means moving from one item to another using
                                 predecessor and successor operations in a sorted order.
 of transportation
 systems, human                  Although this sounds simple, because the sorted order is logical, the next hop is determined
                                 by a node’s logical predecessor or successor and not by its physical nearness. Complexity
 interactions, and               arises as values assigned to not only nodes but relationships may be factored in. For
 telecommunication               example, in an unsorted graph, a node’s predecessor would hold the largest value that is
 networks. That                  smaller than the current node’s value and its successor would be the node with the smallest
                                 value that is larger.
 so many different
 structures can be
                                 Fundamental Traversal Algorithms
 modeled using a
 single formalism is a           There are two fundamental graph traversal algorithms: breadth-first search (BFS) and depth-
                                 first search (DFS).
 source of great power
 to the educated
 programmer.”                                           1                                                    1

            – Frost & Sullivan                    2     3       4                                     2      7      8

                                          5       6             7      8                      3       6             9       12

                                  9      10                    11     12               4      5                    10       11

                                 Breadth-first search                                Depth-first search

                                 The main difference between the algorithms is the order in which they explore nodes in the
                                 graph. Breadth-first search traverses a graph by exploring a node’s neighbors first before
                                 considering neighbors of those neighbors, whereas depth-first search will explore as far
                                 down a path as possible, always visiting new neighbors where possible.

                                 While they are not often used directly, these algorithms form an integral part of other graph
                                 algorithms:

                                   • Depth-first search is used by the Strongly Connected Components algorithms.

                                   • Breadth-first search is used by the Shortest Path, Closeness Centrality and Connected
                                     Components algorithms.

18                                                                                                                  neo4j.com
A Comprehensive Guide to Graph Algorithms in Neo4j
It’s sometimes not obvious which algorithm is being used by other graph algorithms. For
example, Neo4j’s Shortest Path algorithm uses a fast bidirectional breadth-first search as
long as any predicates can be evaluated while searching for the path.
Graph Properties
There are several basic properties of graphs that will inform your choice of how you traverse
a graph and the algorithms you use.
Undirected Directed Cyclic Acyclic
Weighted Unweighted Sparse Dense
2 8
3
Undirected vs. Directed. In an undirected graph, there is no direction to the relationships
between nodes. For example, highways between cities are traveled in both directions. In a
directed graph, relationships have one specific direction. For example, within cities, some
roads are one-way streets. For some analyses, you may also want to ignore direction, for
example in friendships where you want to assume the relationship is mutual. We’ll also see
how this is relevant to Community Detection algorithms, especially Weakly and Strongly
Connected Components.
Cyclic vs. Acyclic. In graph theory, cycles are paths through relationships and nodes where
you walk from and back to a particular node. There are many types of cycles within graphs,
but cycles require consideration when using algorithms that may cause infinite loops, like
PageRank, for example. An acyclic graph has no cycles; a tree structure is a common type of
connected and acyclic (and undirected) graph.
Weighted vs. Unweighted. Weighted graphs assign values (weights) to either the nodes or
their relationships; one example is the cost or time to travel a segment or the priority of a node.
The shortest path through an unweighted graph is quickly found with a breadth-first search as it
will always be the path with the fewest number of relationships. Weighted graphs are commonly
used in pathfinding algorithms and require consideration for calculating additional values.
Sparse vs. Dense. Graphs with a large number of relationships compared to nodes are
called dense. Although not strictly defined, sparse graphs are loosely linear in the number of
relationships to nodes, whereas in a clearly dense graph the number of relationships would
typically be the square of the nodes. Most graphs tend toward sparseness, especially where
physical elements, such as pipe sizes, come into play. Care should be taken when preparing
your graph data for community detection algorithms: On graphs that are extremely dense
you’ll find overly clustered, meaningless communities; and at the other end of the spectrum,
an extremely sparse graph may find no communities at all.
19 neo4j.comA Comprehensive Guide to Graph Algorithms in Neo4j
Chapter 5
The Neo4j Graph Data Science Library
The Neo4j Graph Data Science Library is used on your connected data to gain new insights
more easily within Neo4j. These graph algorithms improve results from your graph data, for
example by focusing on particular communities or favoring popular entities.
We developed this library as part of our effort to make it easier to use Neo4j for a wider
variety of applications. These algorithms have been tuned to be as efficient as possible in
regards to resource utilization as well as streamlined for management and debugging.
They are available as user-defined procedures called as part of Cypher statements running
on top of Neo4j.
Here is an architecture diagram.
3
Graph API
1, 2
Algorithm
Datastructures
4
1. Load data in parallel from Neo4j
2. Store in efficient data structures
3. Run graph algorithm in parallel using the Graph API
4. Write data back in parallel
If you want to try out the examples in the rest of the book, you’ll need to first install the graph
algorithms library. Please see the “Installing Graph Algorithms” section in Appendix B.
20 neo4j.comA Comprehensive Guide to Graph Algorithms in Neo4j
Usage
These algorithms are exposed as Neo4j procedures. They are called directly using Cypher in
your Neo4j Browser, from cypher-shell or from your client code.
For most algorithms, there are two procedures:
• algo. – This procedure writes results back to the graph as node-properties,
and reports statistics.
• algo..stream – This procedure returns a stream of data. For example, node-
ids and computed values.
For large graphs, the streaming procedure might return millions, or even billions, of results.
In this case it may be more convenient to store the results of the algorithm, and then use
them with later queries.
This is one of the use cases for a handy feature called graph projection. Graph projection
places a logical subgraph into a graph algorithm when your original graph has the wrong
shape or granularity for that specific algorithm. For example, if you’re looking to understand
the relationship between drug results for men versus women but your graph is not
partitioned for this, you’ll be able to temporarily project a subgraph to quickly run your
algorithm upon and move on to the next step.
We project the graph we want to run algorithms on with either label and relationship-type
projection, or Cypher projection.
Label and relationship-type
Execute algorithm
Cypher projection
Neo4j stored graph Projected graph
The projected graph model is separate from Neo4j’s stored graph model to enable fast
caching for the topology of the graph, containing only relevant nodes, relationships and
weights. During projection of a directed subgraph, only one relationship directed in and
one relationship directed out is allowed between a pair of nodes. During the projection of
an undirected subgraph, two relationships between a pair of nodes is allowed (there is no
direction).
Label & Relationship-Type Projection
We project the subgraph we want to run the algorithm on by using the label parameter to
describe nodes, and relationship-type to describe relationships.
The general call syntax is:
CALL algo.("NodeLabel", "RelationshipType", {config})
21 neo4j.comA Comprehensive Guide to Graph Algorithms in Neo4j
Cypher Projection
If label and relationship-type projection is not selective enough to describe our subgraph to run the
algorithm on, we use Cypher statements to project subsets of our graph. Use a node-statement
instead of the label parameter and a relationship-statement instead of the relationship-type, and use
graph:"cypher" in the config.
Relationships described in the relationship-statement will only be projected if both source and target
nodes are described in the node-statement. Relationships that don’t have both source and target nodes
described in the node-statement will be ignored.
We also return a property value or weight (according to our config) in addition to the ids from these
statements.
Cypher projection enables us to be more expressive in describing the subgraph that we want to analyze,
but it might take longer to project the graph with more complex Cypher queries.
The general call syntax is:
CALL algo.(
"MATCH (n) RETURN id(n) AS id",
"MATCH (n)-->(m) RETURN id(n) AS source, id(m) AS target",
{graph: "cypher"})
Huge Graph Projection
The default label and relationship-type projection has a limitation of two billion nodes and two billion
relationships, so if our projected graph is bigger than this, we need to use a huge graph projection. This
is enabled by setting graph:"huge" in the config.
The general call syntax is:
CALL algo.("NodeLabel", "RelationshipType", {graph: "huge"})
22 neo4j.comA Comprehensive Guide to Graph Algorithms in Neo4j
Algorithm Types
For transactions and operational decisions, you need real-time graph analysis to provide a
local view of relationships between specific data items and take action. To make discoveries
about the overall nature of networks and model the behavior of complex systems, you need
graph algorithms that provide a broader view of patterns and structures across all data and
relationships.
The following table is helpful for working out the appropriate algorithm for your use case.
Algorithm Type Graph Problem Examples
Find the optimal path or • Find the quickest route
evaluate route availability to travel from A to B
and quality
• Telephone call routing
Pathfinding & Search
Determine the importance of • Determine social media
distinct nodes in the networks influencers
• Find likely attack targets
in communication and
transportation networks
Centrality
Evaluate how a group is • Segment customers
clustered or partitioned
• Find potential members
of a fraud ring
Community Detection
The next three chapters provide a reference for these three types of algorithms. They can be
treated as a reference manual for the algorithms currently supported by the Neo4j Graph
Platform.
If you want to try out the examples in these chapters, you’ll need to install the Graph
Algorithms library. Please see the “Installing Graph Algorithms” section in Appendix B.
23 neo4j.comA Comprehensive Guide to Graph Algorithms in Neo4j
Chapter 6
Pathfinding and Graph Search Algorithms
Pathfinding and graph search algorithms start at a node and expand relationships until the destination
has been reached. Pathfinding algorithms do this while trying to find the cheapest path in terms of
number of hops or weight whereas search algorithms will find a path that might not be the shortest.
Algorithm Type What It Does Example Uses
Shortest Path Calculates the shortest weighted path between a pair of Shortest Path is used for finding directions between
nodes. physical locations, such as driving directions. It’s also used
to find the degrees of separations between people in social
networks as well as their mutual connections.
Single Source Calculates a path between a node and all other nodes Single Source Shortest Path is faster than Shortest Path and
Shortest Path whose summed value (weight of relationships such as cost, is used for the same types of problems.
distance, time or capacity) to all other nodes is minimal.
It’s also essential in logical routing such as telephone call
routing (e.g., lowest cost routing).
All Pairs Calculates a shortest path forest (group) containing all All Pairs Shortest Path is used to evaluate alternate routes
Shortest Path shortest paths between all nodes in the graph. for situations such as a freeway backup or network capacity.
Commonly used for understanding alternate routing when It’s also key in logical routing to offer multiple paths, for
the shortest route is blocked or becomes suboptimal. example, call routing alternatives in case of a failure.
Minimum Weight Calculates the paths along a connected tree structure with Minimum Weight Spanning Tree is widely used for network
Spanning Tree the smallest value (weight of the relationship such as cost, designs: least cost logical or physical routing such as laying
time or capacity) associated with visiting all nodes in the cable, fastest garbage collection routes, capacity for water
tree. It’s also employed to approximate some problems with systems, efficient circuit designs and much more.
unknown compute times such as the traveling salesman
problem and randomized or iterative rounding. It also has real-time applications with rolling optimizations
such as processes in a chemical refinery or driving route
corrections.
24 neo4j.comA Comprehensive Guide to Graph Algorithms in Neo4j
Shortest Path
The Shortest Path algorithm calculates the shortest (weighted) path between a pair of nodes.
In this category, Dijkstra’s algorithm is the most well known. It is a real-time graph algorithm,
and is used as part of the normal user flow in a web or mobile application.
Pathfinding has a long history and is considered to be one of the classical graph problems; it
has been researched as far back as the 19th century. It gained prominence in the early 1950s
in the context of alternate routing, that is, finding the second shortest route if the shortest
route is blocked.
Edsger Dijkstra came up with his algorithm in 1956 while trying to show off the new ARMAC
computers. He needed to find a problem and a solution that people not familiar with
computing would be able to understand, and he designed what is now known as Dijkstra’s
algorithm. He later implemented it for a slightly simplified transportation map of 64 cities in
the Netherlands.
When Should I Use Shortest Path?
• Finding directions between physical locations. This is the most common usage, and web
mapping tools such as Google Maps use the shortest path algorithm, or a variant of it, to
provide driving directions.
• Social networks use the algorithm to find the degrees of separation between people. For
example, when you view someone’s profile on LinkedIn, it will indicate how many people
separate you in the connections graph, as well as listing your mutual connections.
! TIP: Dijkstra does not support negative weights. The algorithm assumes that adding
a relationship to a path can never make a path shorter — an invariant that would be
violated with negative weights.
Shortest Path Example
Let’s calculate Shortest Path on a small dataset.
The following Cypher statement creates a sample graph containing locations and connections
between them.
MERGE (a:Loc {name:"A"}
MERGE (b:Loc {name:"B"}
MERGE (c:Loc {name:"C"}
MERGE (d:Loc {name:"D"}
MERGE (e:Loc {name:"E"}
MERGE (f:Loc {name:"F"}
MERGE (a)-[:ROAD {cost:50}]->(b)
MERGE (a)-[:ROAD {cost:50}]->(c)
MERGE (a)-[:ROAD {cost:100}]->(d)
MERGE (b)-[:ROAD {cost:40}]->(d)
MERGE (c)-[:ROAD {cost:40}]->(d)
MERGE (c)-[:ROAD {cost:80}]->(e)
MERGE (d)-[:ROAD {cost:30}]->(e)
MERGE (d)-[:ROAD {cost:80}]->(f)
MERGE (e)-[:ROAD {cost:40}]->(f);
25 neo4j.comA Comprehensive Guide to Graph Algorithms in Neo4j
E 80
40 ROAD
AD
RO
C
F
ROA
30 40
AD
D
80 RO
RO
AD
ROAD
50
D
100
RO
40 AD
AD
RO A
ROAD
B 50
Graph Model
Now we can run the Shortest Path algorithm to find the shortest path between A and F.
Execute the following query.
MATCH (start:Loc{name:"A"}), (end:Loc{name:"F"})
CALL algo.shortestPath.stream(start, end, "cost")
YIELD nodeId, cost
MATCH (other:Loc) WHERE id(other) = nodeId
RETURN other.name AS name, cost
Results
Name Cost
A 0
C 50
D 90
E 120
F 160
The quickest route takes us from A to F, via C, D, and
E, at a total cost of 160:
• First, we go from A to C, at a cost of 50.
• Then, we go from C to D, for an additional 40.
• Then, from D to E, for an additional 30.
• Finally, from E to F, for a further 40.
26 neo4j.comA Comprehensive Guide to Graph Algorithms in Neo4j
Single Source Shortest Path
The Single Source Shortest Path (SSSP) algorithm calculates the shortest (weighted) path
from a node to all other nodes in the graph.
SSSP came into prominence at the same time as the Shortest Path algorithm and Dijkstra’s
algorithm acts as an implementation for both problems.
Neo4j implements a variation of SSSP, the delta-stepping algorithm. The delta-stepping
algorithm outperforms Dijkstra’s and efficiently works in sequential and parallel settings for
many types of graphs.
When Should I Use Single Source Shortest Path?
Open Shortest Path First is a routing protocol for IP networks. It uses Dijkstra’s algorithm
to help detect changes in topology, such as link failures, and come up with a new routing
structure in seconds.
! TIP: Delta-stepping does not support negative weights. The algorithm assumes that
adding a relationship to a path never makes a path shorter – an invariant that would be
violated with negative weights.
Single Source Shortest Path Example
Let’s calculate Single Source Shortest Path on a small dataset.
The following Cypher statement creates a sample graph containing locations and connections
between them.
MERGE (a:Loc {name:"A"})
MERGE (b:Loc {name:"B"})
MERGE (c:Loc {name:"C"})
MERGE (d:Loc {name:"D"})
MERGE (e:Loc {name:"E"})
MERGE (f:Loc {name:"F"})
MERGE (a)-[:ROAD {cost:50}]->(b)
MERGE (a)-[:ROAD {cost:50}]->(c)
MERGE (a)-[:ROAD {cost:100}]->(d)
MERGE (b)-[:ROAD {cost:40}]->(d)
MERGE (c)-[:ROAD {cost:40}]->(d)
MERGE (c)-[:ROAD {cost:80}]->(e)
MERGE (d)-[:ROAD {cost:30}]->(e)
MERGE (d)-[:ROAD {cost:80}]->(f)
MERGE (e)-[:ROAD {cost:40}]->(f);
27 neo4j.comA Comprehensive Guide to Graph Algorithms in Neo4j
E 80
40 ROAD
AD
RO
C
F
ROA
30 40
AD
D
80 RO
RO
AD
ROAD
50
D
100
RO
40 AD
AD
RO A
ROAD
B 50
Graph Model
Now we can run the Single Source Shortest Path algorithm to find the shortest path between
A and all other nodes. Execute the following query.
MATCH (n:Loc {name:"A"})
CALL algo.shortestPath.deltaStepping.stream(n, "cost", 3.0
YIELD nodeId, distance
MATCH (destination) WHERE id(destination) = nodeId
RETURN destination.name AS destination, distance
Results
Name Cost
A 0
B 50
C 50
D 90
E 120
F 160
The above table shows the cost of going from A to each of the other nodes, including itself at
a cost of 0.
28 neo4j.comA Comprehensive Guide to Graph Algorithms in Neo4j
All Pairs Shortest Path
The All Pairs Shortest Path (APSP) algorithm calculates the shortest (weighted) path between
all pairs of nodes. This algorithm has optimizations that make it quicker than calling the Single
Source Shortest Path algorithm for every pair of nodes in the graph.
Some pairs of nodes might not be reachable from each other, so no shortest path exists
between these pairs. In this scenario, the algorithm returns infinity value as a result between
these pairs of nodes.
When Should I Use All Pairs Shortest Path?
• The All Pairs Shortest Path algorithm is used in urban service system problems, such as
the location of urban facilities or the distribution or delivery of goods. One example of
this is determining the traffic load expected on different segments of a transportation
grid. For more information, see Urban Operations Research.
• All Pairs Shortest Path is used as part of the REWIRE data center design algorithm, which
finds a network with maximum bandwidth and minimal latency. There are more details
about this approach in the following academic paper: "REWIRE: An Optimization-based
Framework for Data Center Network Design."
All Pairs Shortest Path Example
Let’s calculate All Pairs Shortest Path on a small dataset.
The following Cypher statement creates a sample graph containing locations and connections
between them.
MERGE (a:Loc {name:"A"})
MERGE (b:Loc {name:"B"})
MERGE (c:Loc {name:"C"})
MERGE (d:Loc {name:"D"})
MERGE (e:Loc {name:"E"})
MERGE (f:Loc {name:"F"})
MERGE (a)-[:ROAD {cost:50}]->(b)
MERGE (a)-[:ROAD {cost:50}]->(c)
MERGE (a)-[:ROAD {cost:100}]->(d)
MERGE (b)-[:ROAD {cost:40}]->(d)
MERGE (c)-[:ROAD {cost:40}]->(d)
MERGE (c)-[:ROAD {cost:80}]->(e)
MERGE (d)-[:ROAD {cost:30}]->(e)
MERGE (d)-[:ROAD {cost:80}]->(f)
MERGE (e)-[:ROAD {cost:40}]->(f);
29 neo4j.comYou can also read