Our annual exploration of the UK's viewing habits - MAY 2018
←
→
Page content transcription
If your browser does not render page correctly, please read the page content below
Our annual exploration of the UK’s viewing habits

MAY 2018

bjective information is critical
     for the UK’s television and
advertising industry. Each year,
£7.5 billion is spent by broadcasters
and advertisers on the production
and distribution of programme and
commercial content. BARB provides
an independent, joint-industry
currency that is trusted to assess
the return on this investment.

Dealing with audience fragmentation
has been a constant aspect of
BARB’s work since our formation
in 1981. Fragmentation today is
driven by the rise of programmes
and commercials being delivered
online and on-demand.

We constantly develop our
measurement techniques to meet
the needs of the industry with
high-quality data. In recent years
we have developed techniques
for tracking live and on-demand
audiences across TV sets, tablets,
PCs and smartphones. We have
also pioneered the reporting of
dynamically inserted advertising.

The Viewing Report brings to life
the latest insights from BARB.
We hope you enjoy reading it.
CO N T E N TS INTRODUCTION 5
MEET OUR
CONTRIBUTORS
Tim Harford
Tim is an author, columnist
for the Financial Times
GUEST ESSAYS
6 A guide to statistics in a misleading age
Tim Harford
HELLO,
and presenter of Radio 4’s More 9 A matter of fact
I PA & I S B A
or Less. In an article originally Welcome to the 2018 edition of The Viewing people watching programmes across four BARB NOW HAS
published in the Financial Times, Report. screens. In BARB Explained, you can read
Tim offers a guide to statistics in a
10 W h a t w i l l v i d e o m e a s u r e m e n t l o o k
how we are delivering a trusted source of
TECHNIQUES
misleading age.
like in 2022?
When I wrote my introduction for last year's viewing behaviour across TV sets, tablets, PCs TO REPORT
Ed Shedd
edition, the speech given by Marc Pritchard, and smartphones. AUDIENCES
Ed Shedd 12 G e t t i n g ‘ e x t r a ’ o v e r B A R B Procter & Gamble's global marketing chief, FOR ONLINE
Ed Shedd leads Deloitte’s Neil Mortensen was still ringing in the ears of the industry. It In a guest essay, ITV’s Neil Mortensen uses
North West Europe was the catalyst for many things, not least a Love Island as a case study to demonstrate
T V, O N - D E M A N D
Technology, Media & Telecoms (TMT) NEW INSIGHT renewed scrutiny on audience measurement. why a trusted currency is still relevant in PROGRAMMES AND
industry team, as well as the UK We like scrutiny at BARB; it's part of our DNA. an era of proliferating data sources. BARB D Y N A M I C A L LY-
TMT industry team. He looks into viewing figures are the catalyst for blending SERVED
the future to ask: what kind of video 14 T r a c k i n g n o n - l i n e a r v i e w i n g Here in the UK, the IPA and ISBA published insight from different sources in a way that
measurement will the industry need A Matter of Fact which reinforced the amplifies the strengths of each dataset. ADVERTISING
16 B r i n g o n t h e b o x s e t s
in 2022? importance of having accountable media
20 To p o n - d e m a n d p r o g r a m m e s audience data. It emphasised how the Deloitte’s Ed Shedd looks further ahead in his
Neil Mortensen Online TV viewing principles that underpin BARB and other essay and considers what our industry will
Neil Mortensen is Director joint industry currencies are the best-in- need in 2022. Not all data are equal and we
of Audiences, ITV, where he CENTREFOLD - class approach; independence, objectivity face choices on what to measure, from screen
has responsibility for ITV’s research and transparency are enshrined in these size and audio quality to video visibility,
and planning teams and sits on the
THE TOP TENS OF 2017* principles. prominence and adjacent content.
BARB board. Neil gets ‘extra’ on
BARB, discussing the importance 21 To p l i v e p r o g r a m m e s BARB has delivered a trusted currency since Returning to the need for trusted data, we
of the data for broadcasters and Online TV viewing 1981 and is committed to delivering relevant feature Tim Harford’s guide to statistics in
explaining why the future is bright audience measurement in an ever-changing a misleading age. You might know Tim as
22 O n l i n e T V v i e w i n g p a r t o n e :
for audience insight. world. This is why we now have techniques the Undercover Economist; this article first
On-demand v live streaming
to report audiences for online TV, on-demand appeared in the Financial Times. He provides
24 O n l i n e T V v i e w i n g p a r t t w o : programmes and dynamically-served practical tips on how to decipher the barrage
PC, tablet or smartphone? advertising. of statistical propaganda that increasingly
fills our lives. Tim wasn't writing with
26 O n l i n e T V v i e w i n g p a r t t h r e e : You'll find a bucketful of new insight from our audience measurement in mind, although his
W h o i s d o i n g t h e v i e w i n g? new techniques in this annual report. advice is very pertinent in our world.
28 S V O D n a t i o n We bring to life how on-demand viewing There's much for you to read, so let me get
drove audience levels for programmes out of your way.
BARB EXPLAINED such as The Tunnel: Vengeance and Top of
the Lake, both before and after they were Happy reading.
30 D e l v i n g i n t o d i f f e r e n t a s p e c t s o f broadcast as part of a linear schedule. We
what BARB does showcase the most watched non-linear
programmes on TV sets, and also the
U P DAT E D I N S I G H T programmes that were most popular on
tablets, PCs and smartphones. We look
at when people watch online TV on these
34 I n t r o d u c t i o n
devices and find out who is watching,
35 T i m e s h i f t taking The Great British Bake Off final as an
example. And we keep an eye on the growth
36 S h a r e b y g e n r e of SVOD services such as Netflix, Amazon
Prime Video and Now TV.
37 S h a r e b y b r o a d c a s t e r
2018 is the year we will deliver the next stage
38 T r a i n i n g & f i n d o u t m o r e of Project Dovetail. Building on the successful Justin Sampson
beta phase that reports the number of Chief Executive
* Please let us know if the centrefold has already devices being used to watch online TV BARB
b e e n r e m o v e d a n d y o u w o u l d l i k e a n o t h e r. programmes, we will publish the number of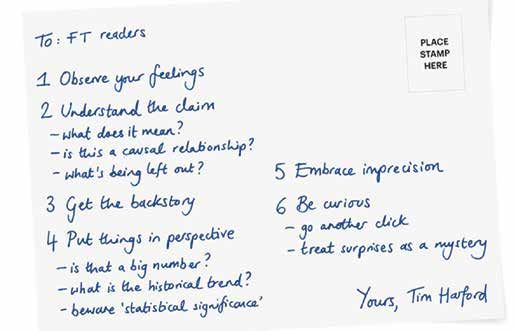
6                                   TIM HARFORD                                                                                                                              TIM HARFORD                                       7

A GUIDE TO
		 STATISTICS IN A                                                                                                          MISLEADING AGE
                       “The best financial advice for most               “chocolate prevents dementia”. If we don’t
                       people would fit on an index card.” That’s        notice and pay attention to those feelings,
                       the gist of an off-hand comment in 2013           we’re off to a shaky start.
                       by Harold Pollack, a professor at the
                       University of Chicago.                            What sort of feelings? Defensiveness.
                                                                         Triumphalism. Righteous anger. Evangelical
                       When I heard about Pollack’s notion, I asked      fervour. Or, when it comes to chocolate and
                       myself: would this work for statistics, too?      dementia, relief. It’s fine to have an emotional
                       There are some obvious parallels. In each         response to a chart or shocking statistic - but
                       case, common sense goes a surprisingly long       we should not be led astray by it.
                       way; in each case, dizzying numbers and
                       impenetrable jargon loom; in each case, there     There are certain claims we rush to tell the
                       are stubborn technical details that matter;       world, others we use to rally like-minded
                       and, in each case, there are people with a        people, still others we refuse to believe.
                       sharp incentive to lead us astray.                Our belief or disbelief in these claims is part
                                                                         of who we feel we are. If we don’t at least
                       The case for everyday practical numeracy          acknowledge that we may be bringing some
                       has never been more urgent. Statistical           emotional baggage along with us, we have
                       claims fill our newspapers and social media       little chance of discerning what’s true.
                       feeds, unfiltered by expert judgment and
                       often designed as a political weapon. We do       The second crucial piece of advice is to
                       not necessarily trust the experts - or more       understand the claim. That seems obvious.
                       precisely, we may have our own distinctive        But all too often we leap to disbelieve or         figuring out which one is being made before      We should never forget, either, that statistics
                       view of who counts as an expert and who           believe (and repeat) a claim without pausing       retweeting it.                                   are a summary of a more complicated truth.
                       does not.                                         to ask whether we really understand what                                                            For example, what’s happening to wages? We
                                                                         the claim is. To quote Douglas Adams’s             All this can seem like pedantry - or worse,      might look at the median increase in wages,
                       Nor are we passive consumers of statistical       philosophical supercomputer, Deep Thought,         a cynical attempt to muddy the waters            which isn’t the same thing as the increase
                       propaganda; we are the medium through             “once you know what the question actually          and suggest that you can prove anything          in the median wage - not at all. Sir Andrew
                       which the propaganda spreads. We are              is, you’ll know what the answer means”.            with statistics. But there is little point       Dilnot, former chair of the UK Statistics
                       arbiters of what others will see: what we                                                            in trying to evaluate whether a claim is         Authority, warns that an average can never
                       retweet, like or share online determines          For example, take the claim “inequality            true if one is unclear what the claim            convey the whole of a complex story. “It’s
                       whether a claim goes viral or vanishes. If we     of income before taxes is rising” (and you         even means.                                      like trying to see what’s in a room by peering
                       fall for lies, we become unwittingly complicit    should be asking yourself, since when?), there                                                      through the keyhole,” he tells me.
                       in deceiving others. On the bright side, we       are several different ways to measure this.        One particular obstacle to our
                       have more tools than ever to help weigh up        One approach is to compare the income of           understanding is the question of                 In short, “you need to ask yourself what’s
                       what we see before we share it - if we are able   people at the 90th percentile and the 10th         causation. “Taller children have a higher        being left out,” says Mona Chalabi, data
                       and willing to use them.                          percentile, but that tells us nothing about        reading age”, goes the headline. This may        editor for The Guardian US. There is no
                                                                         the super-rich, nor the ordinary people in         summarise the results of a careful study         shame in leaving something out. No chart,
                       My statistical postcard begins with advice        the middle. An alternative is to examine           about nutrition and cognition. Or it may         table or tweet can contain everything. But
                       about emotion rather than logic. When you         the income share of the top 1 per cent - but       simply reflect the obvious point that eight-     what is missing can matter.
I F W E FA L L FO R    encounter a new statistical claim, observe        this approach has the opposite weakness,           year-olds read better than four-year-olds
LIES, WE BECOME        your feelings. Yes, it sounds like a line from    telling us nothing about how the poorest fare      - and are taller. Causation is philosophically   Channel the spirit of film noir: get the
U N W I T T I N G LY   Star Wars, but we rarely believe anything         relative to the majority.                          and technically a knotty business but, for       backstory. Of all the statistical claims in the
                       because we’re compelled to do so by pure                                                             the casual consumer of statistics, the           world, this particular stat fatale appeared in
COMPLICIT              deduction or irrefutable evidence. We have        There is no single right answer. In fact,          question is not so complicated: just ask         your newspaper or social media feed, dressed
IN DECEIVING           feelings about many of the claims we might        there are many true statements that one            whether a causal claim is being made, and        to impress. Why? Where did it come from?
OTHERS                 read - anything from “inequality is rising” to    can make about inequality. It may be worth         whether it might be justified.                   Why are you seeing it?
8                                                  TIM HARFORD                                                                                             I PA & I S B A                                                                   9

                                                                                                                                          A MATTER
  Sometimes the answer is little short of a        “It is better to be vaguely right than exactly       CURIOSITY IS
conspiracy: a PR company wanted to sell ice        wrong”, wrote Carveth Read in Logic (1898),
cream, so paid a penny-ante academic to put        and excessive precision can lead people
                                                                                                        A CARDINAL
together the equation for the perfect summer       astray. It makes numbers needlessly                  VIRTUE BECAUSE

                                                                                                                                              OF FACT
afternoon, pushed out a press release on a         cumbersome to remember and to handle. So,            IT ENCOURAGES
quiet news day, and won attention in a media       embrace imprecision. The budget of the NHS           US TO WORK A
environment hungry for clicks.                     in the UK is about £10bn a month. One can be
                                                   much more precise about these things, but            LITTLE HARDER
Just as often, the answer is innocent but          carrying the approximate number around in            TO U N D E RSTA N D
unedifying: publication bias. A study              my head lets me judge pretty quickly when -          W H AT W E A R E
confirming what we already knew is unlikely        say - a £50m spending boost is noteworthy,
                                                                                                        BEING TOLD
to make news. But a study with a surprising        or a rounding error.
result - maybe smoking doesn’t cause cancer
after all - is worth a headline. The new study     Be curious. Curiosity is a cardinal virtue                                                 The IPA and ISBA joined together in June            on trust. Proven media metrics are vital in
may have been rigorously conducted but is          because it encourages us to work a little                                                  2017 to call upon the media industry                demonstrating the effectiveness of any
probably wrong: one must weigh it up against       harder to understand what we are being told,                                               to demand and provide objective and                 media channel.
decades of contrary evidence.                      and to enjoy the surprises along the way.                                                  independent data to underpin the
                                                                                                                                              accountability of all media and their               The principle of joint industry oversight
Publication bias is an even bigger problem in      This is partly because almost any statistical                                              respective trading markets.                         of the research underpinning media is
the media – and perhaps bigger yet in social       statement raises questions: who claims this?                                                                                                   fundamental to confidence in advertising.
media. Increasingly, we see a statistical claim    Why? What does this number mean? What’s                                                    A Matter of Fact highlighted that the long-         Joint Industry Currencies (JICs) have provided
because people like us thought it was worth a      missing? If a statistic is worth sharing, isn’t it                                         term health and prosperity of the media             the advertising industry with objective inputs
Like on Facebook.                                  worth understanding first? The digital age is                                              industry is reliant on objectivity and              into the calculation of marketing effectiveness
                                                   full of informational snares - but it also makes                                           confidence. This can only be maintained             for many years; their metrics are derived from
OK. You’ve noted your own emotions,                it easier to look a little deeper before our                                               if trading data is understood and trusted.          independent data-collection methodologies.
checked the backstory and understood               minds snap shut on an answer.                                                              Audience data is a cornerstone of the
the claim being made. Now you need to                                                                                                         industry; it is fundamental to decision-            The JICs are increasingly moving to hybrid
put things in perspective. A few months            While curiosity gives us the motivation to ask                                             making and monetary transactions.                   measurement systems that combine proven,
ago, a horrified citizen asked me on Twitter       another question, it gives us something else,                                                                                                  people-based research techniques with
whether it could be true that in the UK,           too: a willingness to change our minds. If we                                              Media data needs to deliver a trusted               connected online data. It is vital that the
seven million disposable coffee cups were          treat statistical surprises as mysteries to be                                             assessment of the size and composition of a         industry is reassured about the quality
thrown away every day. I didn’t have               resolved, we are more likely to spot statistical                                           campaign’s audience. This is vital to calculate     and veracity of any proprietary data that
an answer. But I did have an alternative           foul play, but we are also more open-minded                                                a campaign’s return on investment, whether          is absorbed into these industry-owned
question: is that a big number? The                when faced with rigorous new evidence.                                                     the objective is driving sales, building brand      currencies.
population of the UK is 65 million. If one                                                                                                    awareness or any other goals.
person in 10 used a disposable cup each day,       Isaac Asimov is thought to have said, “The                                                                                                     The IPA and ISBA have called on their
that would do the job.                             most exciting phrase in science isn’t ‘Eureka!’,                                           The need for consistent measurement of              respective members to uphold the following
                                                   but ‘That’s funny…’” The quip points to an                                                 media exposure across channels can’t be             standards.
Many numbers mean little until we can              important truth: if we treat the open question                                             underestimated; advertising campaigns
compare them with a more familiar quantity.        as more interesting than the neat answer,                                                  benefit from the multiplier effect, which            	Ensure the audience data used for trading
How big is the number compared with other          we’re on the road to becoming wiser.                                                       comes from using a variety of media                    is based on metrics and methods that
things I might intuitively understand? How                                                                                                    channels. The IPA Effectiveness Awards show            comply with agreed and open industry
big is it compared with last year, or five years   In the end, my postcard has 50-ish words                                                   that the average number of media channels              standards.
ago, or 30?                                        and six commandments. Simple enough,                      Source: Tim Harford 2018         used in a successful ad campaign continues           	Insist those standards are upheld by
                                                   I hope, for someone who is willing to make                Tim Harford’s guide to           to grow each year.                                     independent auditing.
Finally, beware statistical significance. The      an honest effort to evaluate – even briefly –             statistics in a misleading                                                            	Hold proprietary data sets to the same
simplest point to appreciate is that a number      the statistical claims that appear in front of            age FT.com 8th February.         Data users are concerned, specifically when            level of accountability as industry-owned
can be statistically significant while being       them. That willingness, I fear, is what is most           Used under licence from          it comes to data collection and reporting              trading currencies.
of no practical importance. Particularly in        in question.                                              the Financial Times.             techniques. These concerns are fuelled               	Support the principles of the Joint Industry
the age of big data, it’s possible for an effect                                                             All Rights Reserved.             by a number of specific issues around the              Currency (JIC) model as the best-in-class
to clear the technical hurdle of statistical                                                                 Broadcasters’ Audience           provision of online and proprietary data sets;         approach to providing objective and
significance while being tiny.                                                                               Research Board Ltd is            are these sufficiently objective for advertisers?      comparable audience data and metrics.
                                                                                                             solely responsible for                                                                	Encourage all media owners and platforms
One study was able to demonstrate that                                                                       providing this abridged          Data transparency is challenging in an                 to engage with the Joint Industry
unborn children exposed to a heatwave while                                                                  version of the original          increasingly connected world where                     Currencies (JICs), not to the exclusion of
in the womb went on to earn less as adults.                                                                  article and The Financial        intellectual property is fiercely guarded,             their own data sets, but to enhance their
The finding was statistically significant. But      Tim Harford                                              Times Limited does not           speed to market is essential and data privacy          credibility with advertisers.
the impact was trivial: $30 in lost income per      Author, journalist                                       accept any liability for         is paramount. Media companies should
year. Just because a finding is statistically       and broadcaster                                          the accuracy or quality of       understand the commercial benefits of               The full report can be downloaded from
robust does not mean it matters.                                                                             the abridged version.            building a relationship with advertisers based      www.ipa.co.uk/matter-of-fact
10 ED SHEDD ED SHEDD 11
WHAT WILL VIDEO
MEASUREMENT LOOK LIKE IN 2022?
Measurement is a fascinating, oft- video, but the TV set was we need to think about the types of thing we Regulation may also thwart data sharing. Our ALL VIDEO
overlooked topic, which doesn’t get enough the preferred screen among measure and why. Mobile Consumer Survey indicated a lack of
attention. This matters as measurement is all age groups for watching understanding by consumers about the data
I M PA C TS A R E N ’ T
vital to the television industry, and to the long-form content, be it live, There are many hundreds of millions of they are sharing with services. Three quarters N E C E S S A R I LY
media sector more generally. catch-up or on-demand. In screens that can show video around the world, of UK adults claimed that they know their EQUAL, SO WE
2022, TV sets will still be in but each video format has different attributes. data are being used by companies and they NEED TO THINK
The TV advertising market is worth billions of 90% of homes and television A video watched on a smartphone screen will are aware of the risks. However, half said they
pounds in the UK, tens of billions of dollars in will continue to deliver the have a different impact to one seen on a 50- never share their email address online, yet
ABOUT THE TYPES
the US, and hundreds of billions globally. watercooler moments that inch screen. In turn, there is a question about they are on social networks. Two thirds said OF THING WE
advertisers crave. the size of the screen and the effectiveness they don’t share their phone numbers but MEASURE AND
This means that getting measurement of the advertising message. There is ample they are on WhatsApp. WHY
right for a digital age is critical: trusted Despite this, over the next research showing the differential impact of
measurement is fundamental to the industry, four years, the amount of content watched on screens of different sizes. The advent of GDPR this year will also have
but the job is far from done – video content traditional television viewing For me this says that they are of different a big impact on how we collect data. It will
remains in a state of metamorphosis, and is likely to fall. Research value and measuring the audiences needs to necessitate a different approach: greater
advertisers are arguably befuddled. from Thinkbox on video recognise these differences. consent, awareness and collaboration
consumption in 2016 showed around the data sets you are collecting
How is video consumption likely to look that 16-24-year-olds are We are unlikely to have a consistent and this will have an impact on audience
by 2022, and what will the imperatives for watching less traditional television than methodology for measuring everything by measurement and the data sets we can
measurement be then? 2022 is just four years the UK population as a whole, in favour of 2022, so we need to start making choices on expect to see in 2022.
away, so it’s tangible enough to influence consuming video content via other methods what to measure, from screen size and audio
industry decision-making today. such as SVOD and social media platforms. quality to video visibility and prominence and Imperatives for measurement
Our Mobile Consumer Survey indicates adjacent content. In conclusion, what are the imperatives for
Video consumption in 2022 that the behaviour of young people is measurement in 2022 for the industry as
Firstly, what will video consumption look replicated by all ages around five to eight Video measurement in 2022 a whole? It is important to recognise the
like in 2022? We anticipate that it will have years later. Measurement is likely to be as important in significance of measurement today and in
reached a new peak in terms of minutes of 2022 as it is today, if not more. There will be the medium term, and to understand what
viewing per person per day. This viewing will This means that while there will be more more data, richer data and more data sets advertisers expect and the digital platforms
be more atomised than ever, spread across video consumption in 2022, less than half of it than ever before, but these will be owned currently deliver. We must then evaluate the
an ever-widening array of devices. may be accounted for by live television. There by multiple parties, and they may not be consequences if television measurement fails
will be a huge increase in the range of SVOD inclined to share. to match what digital platforms offer.
One reason for this new peak will be better services available.
mobile networks, with improvements to By 2022 we will be able to collect more data Data sets are proliferating, but not all data
4G and the introduction of 5G, and better Broadcasters in the UK and worldwide are sets than ever. It’s technically possible that are equally important, and not all sets will Ed Shedd, Managing
smartphone screens, both of which will make currently looking at the success of SVOD the entirety of a purchase journey could be be available to access or link together. This Partner, North West
it even easier to watch video on the go. services and the reduced technology costs
IN 2022, TV SETS tracked from view to action to transaction lack of collective agreement will mean Europe TMT Practice
and deciding to follow suit and go direct to WILL STILL BE IN across multiple channels, devices and people will have to identify which data sets at Deloitte UK
However, while smartphones will be the consumers. Disney is launching an ESPN 90% OF HOMES networks, even if the purchase was weeks, and combinations are really important for
default for short-form content, TV sets SVOD service this year and a Disney branded AND TELEVISION months or even years after the first view. the success of their businesses, and then
will likely remain the dominant device for SVOD offering in 2019. We predict many The problem is that these data sets are in have collaborative conversations with
watching long-form content. content creators will similarly be diversifying WILL CONTINUE different silos. Data sets could be merged, their owners. Finally, we must establish
into SVOD, often as a complementary TO DELIVER THE but will the various companies that own the available technologies for delivering
In Deloitte’s Mobile Consumer Survey 2017, offering. W AT E R CO O L E R these data permit it? Unless we change the measurement and execute it. These
we asked interviewees in the UK which was conversation, there will be few collective data imperatives will hopefully stimulate us
their preferred device for certain activities. We must also consider that video is utterly
M O M E N TS T H AT sets, which will impinge on the effectiveness to have more collective conversations
Smartphones were the preferred device heterogeneous which in turn means that all ADVERTISERS of audience measurement and businesses and get much further in audience
for many activities, including short-form video impacts aren’t necessarily equal, so CRAVE that depends on it. measurement.12 NEIL MORTENSEN NEIL MORTENSEN 13
GETTING ‘EXTRA’
Left: ITV’s Love Island
© ITV plc
OVER BARB
I’m hoping that there is a decent overlap So, how did this research process work on
between readers of BARB’s Viewing Report a show like Love Island? At the beginning,
and devotees of Love Island; I can imagine our network wanted a new reality show for
the Venn diagram. I love a good Venn ITV2, so we held brainstorms to stimulate
diagram. ideas. We pulled huge stacks of BARB data
together, mapping the gaps in the market 22% OF ALL
If you are still reading on and aren’t in in and sprinkling on qualitative insights from VIEWING TO EACH
my sub group don’t worry, I’ll explain. I’m our youth panel. When the decision was
about to get ‘extra’ over BARB. Which in Love made to commission a re-booted Love Island,
EPISODE WAS
Loveitbetter
Island parlance means I’m pushing things, we tested the brand with our BARB-derived THROUGH A NON-
perhaps taking something too far, by being target audience and then fed this insight into TV DEVICE
over-the-top. the marketing campaign. We also made sure
that the press team had all the important those unique shows that has high device- We clearly have an exciting opportunity to
So, why am I getting ‘extra’? I sit on BARB’s facts so they could brief journalists quickly based online viewing. In the latest series, live take media research and consumer insight to
board, so I must declare an interest, but I when the ratings started to flood in. and on-demand viewing via devices added the next level, enhancing – and potentially
want to address two points. an average of 700k viewers per episode. even revolutionising – our understanding
We were able to do some of our most This means that 22% of all viewing to each of audiences and their interactions with
The first is to reveal just how fundamental effective work when the show was on air, episode was through a non-TV device. At messages and brands. For example,
BARB data are to a broadcaster/producer like combining minute-by-minute BARB data with present, we combine BARB data with our understanding the relationship between
ITV, using Love Island as a case study; and the insights from our viewer panel and online own ITV Hub statistics to find out how many media exposure and consumer behaviour
second is to illustrate how exciting the future ITV community, to help our commissioning people watched on all of our platforms. Soon via data overlays, described as the holy grail
is for those of us working in audience data and production teams tweak aspects of we will have Dovetail in place to make this of single source with large sample sizes, is
and insight, as we build brands on the back of the show, from format and pace to set and much easier. now a reality.
this strong currency. presentation. This really helped the show to
engage with and grow its audience. At the Online viewing through the ITV Hub is clearly We will continue to have BARB data at the
To explain the importance of BARB to a end of the series, we got together with all key very important to Love Island, and as we heart of any of these new opportunities. As
broadcaster, let’s start with the obvious. stakeholders to review the performance data match our registered user data with ITV Hub in the Love Island case study, the BARB data
You know that BARB data come in overnight; in tandem with qualitative insight in order to viewing we can get really granular detail on offer us the springboard to mix and match
what you may not appreciate is how that gauge viewer perceptions and expectations who is watching online. This is where things the appropriate data and insight to create
early morning email can change the whole for the next series. get really interesting, as we can start to something that amplifies the strengths of all
temperature of the company and the hyper-target audiences for advertisers and for datasets to create a whole bigger than the
workload on that day. You get hooked Naturally, we did lots of research to ensure marketing our new shows. sum of its parts.
on a rush of endorphins when a show we got the maximum value from the show
launches with a bang or grows week-on- and to prove to our clients the great benefits Audiences of all ages are not just embracing My hope is that this goes some way to
week; I won’t mention how it feels when they received from being associated with new platforms, they are demanding them; explaining why it feels odd to anyone working Neil Mortensen,
B A R B DATA a hit misses! the brand and advertising within it. And of the ITV Hub is on 30 platforms and we in a broadcaster to hear media experts Director of
OFFER US THE course, we wanted to make sure we had have over 21 million registered users of the talking about BARB not being relevant or Audiences, ITV
SPRINGBOARD TO Our audience insight process follows the the best information to help ITV’s service, as well as 10 million downloads of as important as it once was. I have been in
M I X A N D M ATC H full life of a programme, from development, international distribution team sell the companion apps for our biggest shows. many a meeting or conference when media
commission, production and broadcast format all over the world. Results from people say that they don’t believe in it. My
T H E A P P R O P R I AT E through to recommission, advertising impact BARB data formed the basis of this pitch Broadcasters now have a multitude response is that it isn’t a belief system, it’s
DATA A N D I N S I G H T and international distribution. The lifecycle and helped us to demonstrate how well the of opportunities to capture data from mathematics.
TO C R E AT E A of a programme doesn’t always follow a format had launched. interactions with their audience. ITV is
linear process like this, but we work on every becoming increasingly data-rich as it moves its If you don’t believe in maths, that’s up to
WHOLE BIGGER show at some point in its life, even if it is The other major part of the picture we deliver shows online, leverages social media, deploys you, but – to use a final bit of Love Island
THAN THE SUM OF simply measuring how many viewers came to is the overall programme performance for apps and other interactive solutions and lingo – you may find things a little ‘muggy’
I TS PA RTS it (which isn’t so simple!). this and every show. Love Island is one of explores advanced advertising technology. without it!14 NEW INSIGHT NEW INSIGHT 15
TRACKING NON- THE TUNNEL: VENGEANCE (SKY ATLANTIC) – VIEWING VIA TV SETS
On-demand pre-broadcast Live On-demand post-broadcast
LINEAR VIEWING Episode 1
Episode 2
Episode 3
Episode 4
Episode 5
These days, viewing on-demand isn’t just
about catching up on programmes that have Episode 6
already been shown in the linear schedule.
0 100 200 300 400 500 600 700 800 900 1000
Increasingly, broadcasters are making the
whole series of a show available on-demand Individuals (000s)
on the day the first episode is transmitted
Source: BARB panel, 2017/18. Timeshift (excl Sky On Demand) and on-demand post-broadcast to 28 January 2018
– so people can get ahead with a series,
viewing episodes prior to their appearance
in the linear schedule. This is a practice
sometimes referred to as stacking.
PROFILE OF TV SET VIEWING TO THE TUNNEL: VENGEANCE
BARB can now track these new patterns of
TV set viewing behaviour that combine on-
demand, live broadcast viewing and catch-up Total On-demand pre-broadcast
– perhaps predictive of the shape of viewing on-demand post-broadcast)
in an on-demand world. As percentage of adults (%)
16-24 16-24 16-24
The Tunnel: Vengeance is the third series of
25-34 25-34 25-34
the British-French crime drama The Tunnel. It
aired on Sky Atlantic in December 2017, with 35-44 35-44 35-44
all six episodes released on-demand 45-54 45-54 45-54
on the day of the broadcast debut of saw a complete shift across the life of the Above: Sky Atlantic's 55-64 55-64 55-64
episode one. series. Two thirds of viewing to the final The Tunnel: Vengeance
65+ 65+ 65+
© Sky UK Limited
two episodes was accounted for by people 0 5 10 15 20 25 30% 0 5 10 15 20 25 30% 0 5 10 15 20 25 30%
Fans of the first two series of The Tunnel watching those shows pre-broadcast.
were no doubt looking forward to the debut
episode of series three. Of course, they Drama series generally have a slight skew Gender
couldn’t watch episode one in advance, but (55%) to upscale ABC1 audiences but looking
Women Men Women Men Women Men
hardly anyone viewed it live, depending at the demographic profile of total TV set
on timeshift or on-demand to catch up viewing to The Tunnel: Vengeance, we see
afterwards instead. that over 70% of viewing was ABC1, with a
50/50 gender split.
And that tiny proportion of episode one Social group
viewed live was characteristic of the whole Indeed, the pronounced middle-aged C2DE C2DE
C2DE
series, with even smaller percentages for the bulge would also be typical of traditional
later episodes, leading to a series aggregate TV viewing to drama series, but clearly
BARB CAN NOW ABC1 ABC1 ABC1
of only 3% viewed live. those viewers are making the most of new TRACK THESE
technologies, with more than half of on- N E W PA T T E R N S O F
That’s because the series was viewed almost demand pre-broadcast viewing to the series TV SET VIEWING
entirely on-demand, whether pre- or post- accounted for by the 45-64 age range.
broadcast (70% of total series viewing) or B E H AV I O U R T H AT
timeshifted via PVR (27%). We can also now examine the demographics COMBINE ON-
of online viewing on tablets and PCs because DEMAND, LIVE
But while the small proportion viewed we have installed software meters on our
live was consistent across the series, the panel members’ devices. This information
BROADCAST
difference between viewing in advance can be combined with the census-level data VIEWING AND
of broadcast and catch-up afterwards we have for viewing on these devices. C ATC H - U P Source: BARB panel, 2017/1816 NEW INSIGHT NEW INSIGHT 17
THE GREAT BRITISH BAKE OFF FINAL (CHANNEL 4) – AUDIENCE PROFILES Left: Channel 4's The Great British
Bake Off
Online viewing profiles* vs linear viewing profile ** © Mark Bourdillon / Love
Productions / Channel 4
Audience profiles for online TV viewing
Total PC Laptop Tablet Linear**
Adults 16+ Children 4-15
As percentage of adults (%)
16-24
25-34
35-44
45-54
55-64
65+
To give an example, census data tell us higher amongst women, who accounted for
0 10 20 30% 0 10 20 30 40 50% 0 10 20 30% 0 10 20 30% 0 10 20%
that the 2017 final of The Great British almost 76% of total viewing minutes. And
Bake Off on Channel 4 achieved 311,000 while linear viewing to this show was skewed
average programme streams, but without strongly to upmarket viewers (60.8%), the
BARB panel data, we don’t know how many proportion of online TV viewing by those
Total PC Laptop Tablet Linear** people that was or who they were. BARB viewers (77.5%) reminds us that this typically
panel data tell us that this represented time-poor audience was determined not to
Women Men Women Men 397,000 people viewing that episode, miss out on the Bake Off final.
which – when combined with the panel’s
demographic profile of online TV viewing – Looking at the age and gender profile
can give us the demographic breakdown we of those using each device to watch
see in the chart. this particular show, we can see that a
disproportionate amount of viewing on
The Great British Bake Off has long been tablets is accounted for by younger viewers
credited with boosting the popularity of (16-24s represented 36.8% of tablet viewing
baking amongst younger audiences, and to Bake Off); whilst viewing on laptops was
ABC1 Adults
this was reflected with a healthy 27% of also high amongst 16-34s and children 4-15;
77.5% 78.2% 78.1% 76.0% 60.8% linear viewing to the final accounted for by and more than half of viewing on PCs was
young adults 16-34. Clearly, for lots of these by 25-34s – no doubt driven by workplace
younger viewers, linear viewing wasn’t an catch-up.
option as they were responsible more than
half (53.8%) of all online viewing on devices. The reporting of non-linear viewing on TV
sets like in The Tunnel: Vengeance example EXAMINING THE
And when we say young, it’s clear that is a core BARB panel capability. This is likely DEMOGRAPHICS OF
viewing this show online was a big hit for our to become increasingly important as more ONLINE VIEWING
youngest viewing segment of children aged broadcasters decide to make entire series
4-15, accounting for nearly 10% of minutes. available on-demand on the first day of linear IS POSSIBLE
With over 46% of its online viewing in the transmission. B E C A U S E PA N E L
25-44 segment, it looks clear that the final of MEMBERS ALLOW
Bake Off was a big family online viewing hit. Meanwhile, The Great British Bake Off final
Panel data from software meters, 2017 – currently unpublished demographic insights are a preview of the
US TO MONITOR
There are perhaps no surprises in the gender type of learnings that will come from the next THEIR VIEWING ON
Source: BARB panel, 2017 skew – online device viewing was much stage of Project Dovetail. TA B L E TS A N D P CS18 NEW INSIGHT NEW INSIGHT 19
BR ING ON NON-LINEAR VIEWING VIA TV SETS IN 2017*
P rogramme Average audience
– individuals (000s)
THE BOX SETS
1 Gun powder Se r i e s 1 Epi s ode 2 925.4
2 Top of the Lake Chi n a Gi rl Epi s ode 6 860.4
3 Top of the Lake Chi n a Gi rl Epi s ode 4 843.3
4 Top of the Lake Chi n a Gi rl Epi s ode 5 817.0
5 Motherl an d Se r i e s 1 Epi s ode 6 811.1
6 Top of the Lake Chi n a Gi rl Epi s ode 2 802.7
7 Top of the Lake Chi n a Gi rl Epi s ode 3 760.0
8 Motherl an d Se r i e s 1 Epi s ode 5 759.1
We’re all used to hearing industry chatter dominated by drama series. In top place is 9 Motherl an d Se r i e s 1 Epi s ode 4 677.2
about the decline of TV viewing; and it’s true Gunpowder, which premiered on BBC One
10 Motherl an d Se r i e s 1 Epi s ode 3 666.9
that traditional TV viewing declined from in the autumn, and was highly acclaimed by
11 Top of the Lake Chi n a Gi rl Epi s ode 1 523.8
212 minutes daily for the average person in critics and popular with audiences.
2016 to 203 minutes in 2017. Yet the total 12 Motherl an d Se r i e s 1 Epi s ode 2 518.4
amount of time spent in front of the TV set is Multiple episodes of Top of the Lake (series 13 Room on the Broom 489.4
only marginally down, dropping by just two two – China Girl) dominate the top of the 14 Bad Educati on Se r i e s 3 Epi s ode 4 462.4
minutes a day. chart, perhaps not surprising given its overall 15 Bad Educati on Se r i e s 3 Epi s ode 2 444.4
popularity and critical acclaim following the 16 Bad Educati on Se r i e s 3 Epi s ode 3 413.7
The reason for that apparent disconnect is series two debut in 2017. Box set viewing 17 Cl i que Se r i e s 1 Epi s ode 5 393.0
what’s called unmatched viewing, which has seems to be baked into this programme – the 18 Stacey Dool ey In vesti gates Se r i e s 1 Epi s ode 8 376.2
grown fast in recent years, accounting for first series launched at The Sundance Film 19 Bad Educati on Se r i e s 3 Epi s ode 5 371.0
14% of all TV set activity in 2016, growing to Festival 2013 with a seven-hour screening
20 Cl i que Se r i e s 1 Epi s ode 6 367.5
16% in 2017. of the whole series. Here in the top 50 we’re
seeing what happened when the whole series 21 Sti ck Man 360.2
BARB defines unmatched viewing as was released on-demand on the day of its 22 The Tun n el : Ven gean ce Se r i e s 3 Epi s ode 6 360.1
when the TV is on but the content wasn’t first broadcast. 23 The Gruf fal o 355.3
broadcast as part of a linear schedule in the 24 Stacey Dool ey In vesti gates Se r i e s 1 Epi s ode 8 353.0
last 28 days. This includes gaming, viewing This show illustrates a pattern over the 25 Bad Educati on Se r i e s 3 Epi s ode 1 351.8
to SVOD services and shows that haven’t lifetime of a series that has both a linear 26 The Tun n el : Ven gean ce Se r i e s 3 Epi s ode 4 349.7
been broadcast in the previous four weeks. broadcast and on-demand availability. The 27 The Gruf fal o's Chi l d 339.2
However, BARB can now identify the last later episodes accrue the bigger numbers, a 28 Quacks Se r i e s 1 Epi s ode 2 337.9
of these and take it out of unmatched, if consequence of viewers having more time
29 Cl i que Se r i e s 1 Epi s ode 3 336.8
broadcasters provide us with their non-linear to see the programme on-demand pre-
programme assets. broadcast and less patience to wait for the
30 Murdered for Bei n g Di f feren t 330.8
linear broadcast to find out how it ends. 31 Cl i que Se r i e s 1 Epi s ode 4 329.9
The table shows the top 50 most viewed 32 The Tun n el : Ven gean ce Se r i e s 3 Epi s ode 5 328.5
non-linear programmes of 2017. We can A similar pattern is also in evidence for older 33 Reg g i e Yates: Hi dden Austral i a Se r i e s 1 Epi s ode 1 322.1
begin to examine the patterns of behaviour series like Bad Education. Later episodes 34 Li ttl e Bri tai n Se r i e s 1 Epi s ode 3 305.7
when viewers access libraries of on-demand still capture the biggest views on-demand, 35 Quacks Se r i e s 1 Epi s ode 6 302.1
content, including box-sets. perhaps because they were missed last time. 36 Love an d Drug s on the Street : Gi rl s Sl eepi n g Roug h Se r i e s 1 Epi s ode 1 296.1
37 Quacks Se r i e s 1 Epi s ode 1 294.9
The table features multiple appearances The online-only BBC Three also delivers
38 Sex , Drug s & Murder: Li fe i n the Red Li g ht Zon e Se r i e s 1 Epi s ode 4 293.4
of classic children’s programmes like The some shows with on-demand audiences not
39 The Tun n el : Ven gean ce Se r i e s 3 Epi s ode 3 286.6
Gruffalo’s Child and Stick Man. These far behind those for shows that have also
programmes made the top 50 for 2017 after had a broadcast airing. Here we see bold, 40 Stacey Dool ey In vesti gates Se r i e s 1 Epi s ode 0 284.7
being made available alongside a range of hard-hitting, factual content that captured 41 I Shot My Paren ts 281.6
other BBC content via the BBC iPlayer over big audiences for one-off documentaries like 42 Quacks Se r i e s 1 Epi s ode 3 281.1
Christmas. It’s easy to picture the scene with Stacey Dooley investigates and I Shot My BARB CAN 43 Thi s Coun tr y Se r i e s 1 Epi s ode 1 280.9
little ones, parents and grandparents all Parents. 44 Peopl e Just Do Nothi n g Se r i e s 1 Epi s ode 1 269.9
enjoying these timeless classics. But the top REPORT VIEWING 45 W1 A Se r i e s 3 Epi s ode 6 269.8
50 helps to illustrate the characteristics of on- This evidence of shifting viewer behaviour TO S H O W S T H AT 46 Jami e John son Se r i e s 1 Epi s ode 3 267.3
demand, box-set viewing behaviour across supports BARB's development of techniques HAVEN’T BEEN 47 Bad Educati on Se r i e s 3 Epi s ode 6 267.1
the year too. that enable the comprehensive measurement
of viewing across all devices. We welcome
BROADCAST IN 48 W1 A Se r i e s 3 Epi s ode 2 265.9
As we’d expect from what we’ve long known working with broadcasters and rights owners THE PREVIOUS 49 Bi l l i on ai re Boy Se r i e s 1 Epi s ode 1 261.0
about timeshift behaviour, the rankings are on the reporting of non-linear viewing. FOUR WEEKS 50 Gan g sta Gran n y Se r i e s 1 Epi s ode 1 257.3
Source: BARB panel, non-linear viewing via TV sets to programmes 10 minutes+ in duration, 1 January - 31 December 2017
*Table includes content from rights owners that have provided their programme assets for measurement by BARB20 ONLINE TV VIEWING ONLINE TV VIEWING 21
TOP ON-DEMAND TOP LIVE
PROGRAMMES* PROGRAMMES*
Program m e B roa d ca s te r Average P rogramme C h anne l Average
P ro gramme Programme
S trea m s ( 000s ) Streams (000s)
1 Three Girls S e ri e s 1 Ep i sod e 1 BBC 611 1 Love Island 24/ 07/ 2017 ITV2 249
2 Love Island S e ri e s 3 Ep i sod e 2 9 ITV 541 2 I’m A Celebrity - Get Me Out Of Here! 19/ 11/ 2017 ITV 182
3 Doctor Foster S e ri e s 2 Ep i sod e 4 BBC 478 3 Election 2017 08/ 06/ 2017 BBC1 158
4 EastEnders 2 6 /1 2 /2 0 1 7 BBC 420 4 Love Island: The Reunion 30/ 07/ 2017 ITV2 124
5 The Apprentice S e ri e s 1 3 Ep i sod e 8 BBC 386 5 Live Pl: Liverpool v Everton 10/ 12/ 2017 Sky Sports ME 122
6 Blue Planet II S e ri e s 1 Ep i sod e 1 BBC 383 6 Love Island: Aftersun 25/ 06/ 2017 ITV2 121
7 The Replacement S e ri e s 1 Ep i sod e 3 BBC 344 7 One Love Manchester 04/ 06/ 2017 BBC1 111
8 Line Of Duty S e ri e s 4 Ep i sod e 6 BBC 344 8 World Cup 2018 Qualifier: England v Slovakia 04/ 09/ 2017 ITV 100
9 Rio Ferdinand: Being Mum And Dad BBC 315 9 England Friendlies: England v Brazil 14/ 11/ 2017 ITV 94
10 The Great British Bake -Off S e ri e s 1 E p is o d e 1 Channel 4 291 10 Doctor Foster 03/ 10/ 2017 BBC1 85
11 Liar Ser ie s 1 Ep i sod e 6 ITV 280 11 Match Of The Day 08/ 12/ 2017 BBC1 82
12 Louis Th eroux Dark States Ep i sod e 1 BBC 280 12 Weather 12/ 08/ 2017 BBC1 75
13 Peaky Blinders S e ri e s 4 Ep i sod e 5 BBC 277 13 Live Mexican GP: Race 29/ 10/ 2017 Sky Sport s ME 71
14 I’m A Celebrity... Get Me Out Of Here! S er ies 1 7 E p is o d e 2 ITV 270 14 Live Nissan Super Sunday: Chelsea v Arsenal 17/ 09/ 2017 Sky Sports 1 68
15 The X Factor S e ri e s 1 4 Ep i sod e 1 ITV 256 15 The Apprentice 04/ 10/ 2017 BBC1 68
16 Love Island: The Reunion S e ri e s 1 E p is o d e 1 ITV 251 16 Live British & Irish Lions Tour 08/ 07/ 2017 Sky Sports 1 66
17 Strike - The Cuckoo’s Calling S e ri es 1 E p is o d e 1 BBC 223 17 Live WCQ: Wales v ROI 09/ 10/ 2017 Sky Sports ME 64
18 Our Girl S e ri e s 5 Ep i sod e 4 BBC 223 18 Live Bristol City v Man Utd Carabao Cup 20/ 12/ 2017 Sky Sports ME 62
19 The Only Way Is Essex S e ri e s 2 1 Ep i s o d e 1 5 ITV 214 19 The BBC Election Debate 31/ 05/ 2017 BBC1 62
20 Trust Me S e ri e s 1 Ep i sod e 4 BBC 214 20 The Great British Bake -Off 31/ 10/ 2017 Channel 4 61
21 Made In Chelsea S e ri e s 1 3 Ep i sod e 1 1 Channel 4 207 21 BBC News 12/ 08/ 2017 BBC1 59
22 The Apprentice M e et The Cand i d ate s: S er ies 1 3 BBC 205 22 Match Of The Day 2 13/ 08/ 2017 BBC1 57
23 Call The Midwife S e ri e s 1 Ep i sod e 1 3 BBC 196 23 Ten O’Clock News 03/ 10/ 2017 BBC1 55
24 Mrs Brown’s Boys S e ri e s 1 1 Ep i sod e 1 BBC 194 24 Liar 16/ 10/ 2017 ITV 50
25 Made In Chelsea: Ibiza S e ri e s 1 Ep i s o d e 5 Channel 4 194 25 Blue Planet II 12/ 11/ 2017 BBC1 46
* Table only inc l ud e s si ngl e hi ghe st rate d e p i so d e p er p ro g ra m m e t it le a n d s p o r t in g e ven t *Tabl e on l y i n cl u de s s i n gl e h i gh e s t rate d e pi s ode pe r program m e t i t l e an d s por t i n g e ve n t
Viewing to personal computers, tablets and smartphones Viewing to personal computers, tablets and smartphones
Source: BARB TV Player Report 2017 - weekly data Source: BARB TV Player Report 2017 - weekly data22 NEW INSIGHT ONLINE TV VIEWING NEW INSIGHT 23
ON-DEMAND v HOW BIG IS TV VIEWING ON TABLETS, PCS AND SMARTPHONES?
Live streaming On-demand
LIVE STREAMING
Device viewing
Live adds approximately
1.3%
streaming
peaks due to
General Election
results
viewing to TV set
Billion minutes per week viewing
1.4bn Love Island
BARB’s TV Player Report is the UK’s as the UK general election, drive spikes in live finale
first joint-industry, audited measure of streaming. Six Nations I’m a Celebrity
viewing to online TV and reports on the Championship finale
consumption of TV content on PCs, tablets Because on-demand represents people starts
1.2
and mobile phones from data generated by having total control over what, when and v
software code embedded in TV player apps. where they watch, it’s not surprising that the
These are census data, not panel data – biggest programmes are the most popular,
providing a measure of total viewing across talked-about ones, across genres (see Top
devices by all users of the players, not just On-Demand Programmes and Top Live 1.0
by BARB panel members. Programmes, pages 20-21).
Viewing on devices has been much talked Drama (Three Girls, EastEnders, Doctor Foster,
about in our industry and is conspicuous etc) dominates the top on-demand rankings
because it’s often being done in public or on along with event TV (The Apprentice, I’m a 0.8
the move, leading to a belief that it might Celebrity and the Channel 4 debut of The
be higher than it actually is. In fact, the vast Great British Bake Off); with big numbers also
majority of viewing time is still happening on for one-off documentaries (Rio Ferdinand:
the TV set; our data show that total viewing Being Mum and Dad), natural history (the
0.6
time on devices adds approximately 1.3% to Blue Planet II debut) and entertainment
total TV set viewing levels. reality (Love Island, Made in Chelsea, The Only
Way is Essex). In fact, Love Island would have
Summer dip
Looking specifically at the share of online dominated the on-demand and live charts if in online viewing
TV viewing by devices, we can distinguish every episode had been treated separately. 0.4 reflects established
between BBC iPlayer viewing via smartphone seasonal trends in
apps, browser-based access and via the If the top on-demand programmes table viewing on
TV sets
iPlayer app on connected TVs. Our data show represents the content that people can’t bear
that 50% of all iPlayer viewing in 2017 was via to have missed, the top live programmes
connected TVs and this proportion appears to table tells us what they’ll make an absolute 0.2
be steadily growing. With connected TVs now priority for. Dominated by big football
available for 63% of individuals in TV homes games, rugby and Grand Prix racing, it’s again
(according to BARB’s Establishment Survey, not surprising to see Love Island and I’m a
Q4 2017), it makes sense that people will view Celebrity in the top 10. 0.0
online TV content on the biggest and best 1 Jan 5 Feb 5 Mar 2 Apr 7 May 4 Jun 2 Jul 6 Aug 3 Sep 1 Oct 5 Nov 3 Dec 31 Dec
available screen. We see that exceptional drama series like
Week ending 2017
Doctor Foster and Liar can command a
The iPlayer data on viewing behaviour are live streaming audience too – as well as a
consistent with data about which devices different kind of unmissable live drama in the
people prefer for certain activities. In form of the General Election exit poll, which
Deloitte’s Mobile Consumer Survey 2017 (see commanded big live-streaming numbers
Ed Shedd’s essay on pages 10-11) , the TV from 10pm on election night.
set was the preferred screen among all age TOTA L V I E W I N G
groups for watching long-form content. So online viewing seems to reflect two need- TIME ON
states that TV satisfies in us: the edge-of-the- DEVICES ADDS
The chart breaks down total viewing to seat live experience and the sit-back-and-
distinguish live streaming from on-demand. It relax personal viewing appointment. Let’s
A P P R O X I M A T E LY
shows that viewing on-demand accounts for now see what we can discover about when 1.3% TO TV SET See pages 20-21 for 2017’s top on-demand and live programmes
the vast majority, but particular events, such and how people are doing this online viewing. VIEWING LEVELS Source: BARB TV Player Report, 201724 NEW INSIGHT ONLINE TV VIEWING NEW INSIGHT 25
PC, TABLET OR
ONLINE TV VIEWING BY TIME OF DAY BY DEVICE
Smartphone PC Tablet
Minutes viewed (billion) by clock hour
SMARTPHONE?
7.0bn Smartphone
18.5%
6.0 Percentage Tablet
share across 46.0%
5.0 all audited TV
player apps
PC
4.0 35.5%
BARB’s TV Player Report can tell us more us that while smartphones are always within 3.0
than total viewing levels for online TV – we reach, they are rarely first-choice device for
can also build a picture of when and how viewing TV content.
2.0
people are viewing.
So, device usage grows throughout the day
1.0
In the top chart, aggregated data for the and tablets are the device of choice; but
whole of 2017 show us the pattern of viewing has that been changing over time? In short,
throughout the day on PCs, tablets and not really. The TV Player Report has been 0
06 08 10 12 14 16 18 20 22 24 02 04
smartphones. Broadly speaking, it shows an gathering data since 2015 and in the third Time of day
evening viewing peak, just like TV – although chart we show the trend for the past six
the viewing peak for devices (8-11pm) is later quarters.
than TV’s peak (around 7-10pm). SHARE OF ONLINE TV VIEWING BY TIME OF DAY AND DEVICE TYPE
Since Q3 2016 (and indeed consistently
Looking in detail at share of viewing by device since 2015), tablets have been the nation’s
at different times of the day, we see a picture favourite device for viewing TV content 60%
that’s consistent overall (tablets ranking first, away from the TV set – taking around 45%
PC second and smartphones in third place), of viewing time on non-TV devices. This Tablet
but with some interesting peaks and troughs. first-choice position for tablets looks to be 40
pretty unassailable, as viewing on PCs, the
Tablets peak in the morning – and it’s clear next most popular device, has declined 4.3 PC
that tablet viewing dominates breakfast time percentage points year-on-year from Q4 2016 20 Smartphone
and the morning commute, peaking at 7am to Q4 2017.
with 58% of device viewing, and dominating
all the clock hours from 6-9am with more In contrast to this, viewing via smartphones
0
than 50% share. It’s tempting to put this has been on the increase – climbing more 06 08 10 12 14 16 18 20 22 24 02 04
down solely to viewing while commuting, than three percentage points year-on-year Time of day
but from what we also know about the - most likely due to a combination of the
popularity of tablets amongst children, ubiquity of smartphones, the trend towards
perhaps there is also an element of tablets larger handset screens and cheaper data SHARE OF ONLINE TV VIEWING OVER TIME BY DEVICE
as breakfast-time childminders. packages.
Smartphone PC Tablet
PCs get their highest share of device viewing Nevertheless, the ranking of devices seems to
in the middle of the day between 12-3pm, reflect what we’d expect by way of the quality 50%
no doubt driven by workplace viewing in the of the television viewing experience – larger
lunch hour (but perhaps not just in the lunch screen sizes winning out over smaller and 40
hour!), peaking with 40% share at 2pm. By PCs losing out to the more personal devices
contrast, share of viewing on tablets slumps of tablets and smartphones. 30
at lunchtime (from 12-2pm) – with a share
of 41% at 1pm (just fighting off PC to retain But overall, it’s clear that we love watching 20
top place). In fact, in the second chart, we TV around the clock on whichever device we
see that the share of tablet viewing and PC can get our hands on; and, if we can, having DEVICE
10
viewing are inversely related to one another prime time all the time. Let’s take a look next USAGE GROWS
over the day. at who’s doing this online viewing. THROUGHOUT THE 0
Meanwhile, smartphones get their highest
DAY A N D TA B L E TS Q3 2016 Q4 2016 Q1 2017 Q2 2017 Q3 2017 Q4 2017
share (23%) at 2am and throughout the early ARE THE DEVICE
hours of the morning from 1-5am – reminding OF CHOICE Source: BARB TV Player Report, 201726 NEW INSIGHT ONLINE TV VIEWING NEW INSIGHT 27
WHO IS DOING AUDIENCE PROFILES BY GENDER AND AGE – PC AND TABLET VIEWING
60%
On-demand Live streaming Total
THE VIEWING? 50
40
30
BARB’s TV Player Report has been providing inclined to view live, while viewing on-
device-based census data about online demand satisfies the desire among younger
viewing since 2015 – from the UK population people to view when (and where) they want. 20
at large. From 2018, BARB will tell us
exactly who is doing this online TV viewing. We can see a gender difference too between
on-demand viewing and live streaming, 10
This is the outcome of Project Dovetail, which with men much more likely to view live –
links the device-based census data to BARB’s largely driven by their interest in sports
people-based panel data to provide the UK’s programming – and women more likely to 0
only authoritative source of the demographic catch up with their chosen programming Women Men Age 4-15 16-34 35-54 55+
profile of online TV viewing. While BARB on-demand. This is in keeping with long-
hasn’t yet been reporting this information, established genre differences between live
we have been gathering it for some time and and timeshifted viewing.
so we can share some findings from the BARB
panel on just who it is that is viewing on PCs Patterns of online TV viewing over the day
and tablets (we don’t yet record viewing via bear a strong resemblance to the shape of TIME OF DAY VIEWING BY AGE – PC AND TABLET VIEWING
smartphones for the BARB panel). These TV set viewing generally – dominated by Average viewing (000s)
data are taken from the whole of 2017. evening viewing, although a little later than
traditional TV. The peak in online TV viewing
The top chart shows the gender and age for adult audiences is between 9-11pm, which 50
profiles of online TV viewing. Looking at builds earlier (from around 8pm) for older
total online TV viewing, we can see that it audiences (55+), but is concentrated into a
skews to women more than men (perhaps shorter, earlier peak (9-10pm) for younger 40
challenging the convention that men, as adults (16-34). This 9-10pm spike in young
TV’s lighter viewers, might have been more adult viewing (followed by a sharp drop)
likely to turn to online viewing), and to older is accounted for by live streaming to Love 30
audiences too. However, when compared Island (in June and July) and I’m a Celebrity
with traditional TV set viewing profiles, the (in November and December). With fear of
online picture is more as we might expect. missing out (and of spoilers on social media), 20
these reality series are clearly something you
Children’s share of online viewing by device have to see live. Adults 55+
(8.4%) leads their share of traditional TV set 10 Adults 35-54
viewing (6.5%), while 16-34s take a far higher These articles on online TV viewing have
share of device viewing at 24%, compared given us a glimpse into the new insights A D U LT S I N T H E Adults 16-34
to 15% of that via a TV set. Figures match that Project Dovetail will bring in 2018. 0 Children 4-15
more closely for 35-54s (taking 33% of device Soon we’ll be able to compare - across
PRIME OF THEIR
06:00 08:00 10:00 12:00 14:00 16:00 18:00 20:00 22:00 24:00 02:00 04:00 06:00
viewing and 28% of TV set viewing), while on-demand, live-streaming and linear - the WORKING LIVES
Time of day
the over 55s take 51% of TV set viewing, viewer profiles of schedule stalwarts like APPEAR TO BE THE
compared to 35% of device viewing. Adults in EastEnders and Coronation Street that GROUP WHOSE
the prime of their working lives, possibly pre- dominate the rankings in all environments,
parental responsibility, and most likely to be and see who’s viewing what. ONLINE VIEWING
out and about, appear to be the group whose BEHAVIOUR IS
online viewing behaviour is diverging from DIVERGING FROM
their TV set behaviour most sharply.
THEIR TV SET
But age does seem to drive different viewing BEHAVIOUR MOST
patterns – we see that older people are more S H A R P LY Source: BARB panel – PCs & tablets, 2017You can also read