SESAME - AN EXPERIMENT OF THE ROSETTA LANDER PHILAE: OBJECTIVES AND GENERAL DESIGN
←
→
Page content transcription
If your browser does not render page correctly, please read the page content below
SESAME – AN EXPERIMENT OF THE ROSETTA LANDER PHILAE:
             OBJECTIVES AND GENERAL DESIGN

     K. J. SEIDENSTICKER1,∗ , D. MÖHLMANN1,2 , I. APATHY3 , W. SCHMIDT4 ,
          K. THIEL5 , W. ARNOLD6 , H.-H. FISCHER5 , M. KRETSCHMER1,8 ,
         D. MADLENER1,9 , A. PÉTER3 , R. TRAUTNER7 and S. SCHIEKE1,10
                   1 DLR,   Institute of Space Simulation, D-51170 Köln, Germany
                  2 DLR,  Institute of Planetary Research, D-12489 Berlin, Germany
                3 KFKI, Atomic Energy Research Institute, H-1525 Budapest, Hungary
                     4 FMI, Space Research Division, FIN-00560 Helsinki, Finland
           5 University of Cologne, Dept. of Nuclear Chemistry, D-50674 Köln, Germany
  6 Fraunhofer-Institute for Non-Destructive Testing (IZFP), Building E 3.1, University, D-66123

                                          Saarbrücken, Germany
       7 RSSD/SCI-SB, ESA/ESTEC, Keplerlaan 1, NL-22200AG Noordwijk, The Netherlands
8 Present address: Max-Planck Institute for Extraterrestrial Physics, D-85741 Garching, Germany
     9 Present address: University of Cologne, I. Institute of Physics, D-50674 Köln, Germany
             10 Present address: GE Inspection Technologies, D-50354 Hürth, Germany

                  (∗ Author for correspondence: E-mail: Klaus.Seidensticker@dlr.de)

                (Received 25 April 2006; Accepted in final form 13 November 2006)

Abstract. SESAME is an instrument complex built in international co-operation and carried by the
Rosetta lander Philae intended to land on comet 67P/Churyumov-Gerasimenko in 2014. The main
goals of this instrument suite are to measure mechanical and electrical properties of the cometary
surface and the shallow subsurface as well as of the particles emitted from the cometary surface. Most
of the sensors are mounted within the six soles of the landing gear feet in order to provide good contact
with or proximity to the cometary surface. The measuring principles, instrument designs, technical
layout, operational concepts and the results from the first in-flight measurements are described. We
conclude with comments on the consequences of the last minute change of the target comet and how
to improve and to preserve the knowledge during the long-duration Rosetta mission.

Keywords: space missions, Rosetta, cometary nuclei, cometary surface, cometary particles, in-situ
science

                       1. Introduction and Scientific Motivation

The primary motivation to send spacecrafts to cometary nuclei is the well-founded
assumption that they are the least modified objects of the solar system since it was
born out of a collapsing interstellar cloud. Thus cometary nuclei are expected to
contain the primordial matter (interstellar grains made of refractory and volatile
matter) and their physical properties and structure on small and large scales should
give insight into the formation processes of the larger bodies 4.6 billion years
ago. On the other side, one can reasonably expect that at least the surface layers
Space Science Reviews (2007) 128: 301–337
DOI: 10.1007/s11214-006-9118-6
                                                                                       C   Springer 2007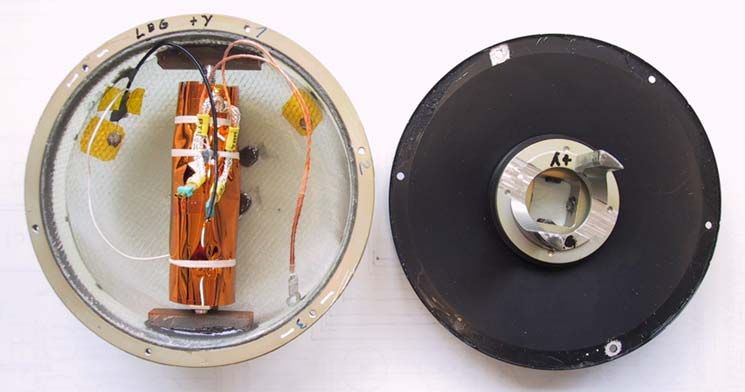
302                            K. J. SEIDENSTICKER ET AL.

of cometary nuclei have been modified by cosmic radiation and solar insolation,
when entering the inner solar system (e.g. Belton and A’Hearn, 1999).
    Sublimated ices will not only evaporate from the cometary nucleus but also
will flow inward transporting energy and changing the mechanical texture of the
surface layer. The bond sizes between the cometary grains would grow by con-
densing molecules, causing an increase of the thermal conductivity as well as of
the compressive strength of the layer matrix. Prialnik and Mekler (1991) postulated
that the condensation of the inward-flowing vapor will form a dense ice crust. If
several ices like H2 O, CO and CO2 were present in the primordial surface layer,
their different volatility would lead to a compositional fractionation (stratification)
(Benkhoff and Huebner, 1995). Each ice component would also build up its own
crust at the boundary to the next upper layer. During the comet simulation (KOSI)
experiments at DLR, Cologne (Seidensticker and Kochan, 1992) an initially ho-
mogeneous mixture of various ices (in most cases H2 O and CO2 ) and refractory
minerals developed under insolation a layered structure beneath a mm-thick dust
mantle (regolith) (Grün et al., 1991a,b; Hesselbarth et al., 1991; Seiferlin et al.,
1995).
    In addition to the vertical modification of cometary surface layers, large varia-
tions of the topography over lateral scales of meters to hundreds of meters are to be
expected (e.g. Belton and A’Hearn, 1999). Particles, emitted due to the sublimation
of volatiles, either leave the nucleus completely or are deposited in inactive areas
building up a regolith layer (Möhlmann, 1994). Thus cometary nuclei will prob-
ably show two types of surfaces areas: (i) active, bare and strong or (ii) inactive,
regolith-covered and fluffy. The Stardust spacecraft to comet 81P/Wild 2 found
a surface with steep slopes, even at least one overhang, suggesting a strong and
cohesive surface (A’Hearn, 2004). In contrast to this observation, the Deep Impact
probe transmitted data that demonstrated that comet 9P/Tempel 1 has large areas
covered with smooth and loose regolith (A’Hearn et al., 2005).
    On 2 March 2004 the lander probe Philae as part of the ESA Rosetta mission was
successfully launched to comet 67P/Churyumov-Gerasimenko. Philae will land on
a processed surface and the primordial state, which is hidden in the subsurface,
will not be measurable directly by most of the instruments on-board. Still, the data
of these instruments should improve our understanding of the processes occurring
today and which have led to the present state as well as deliver essential constraints
for deducing the initial composition and structure.
    The Surface Electric Sounding and Acoustic Monitoring Experiment
(SESAME) is part of the Philae instrument suite. SESAME is a complex of three in-
struments: The Comet Acoustic Surface Sounding Experiment (CASSE), the Dust
Impact Monitor (DIM) and the Permittivity Probe (PP). It is the goal of SESAME
to contribute to the understanding of the vertical and lateral structure of a cometary
surface and the acting processes by conducting in-situ measurements of mechanical,
electrical and particle-related properties. The analysis of elastic waves that will be
generated and recorded by CASSE will allow deducing mechanical parameters as
SESAME – AN EXPERIMENT OF THE ROSETTA LANDER PHILAE                 303

well as the vertical (layered) structure of the cometary surface. The DIM instrument
will measure the properties of impacting ice-dust grains. These data should help to
improve our understanding of the lateral variations and how activity can be evoked
or choked. PP will determine the complex permittivity of the surface material be-
neath Philae, which is a measure for the water ice content, thereby constraining the
mass fractions of refractory material and other ices.
   These measurements shall be performed until 67P/Churyumov-Gerasimenko
reaches its perihelion. Combining observations from other instruments, both on
Philae and the Rosetta orbiter, with the SESAME data should improve models of
cometary activity (e.g. Möhlmann, 1995), layering processes and of the heat and
gas transport within cometary surfaces.
   In the following chapter we describe the physical principles behind the three
instruments, their technical realization, special aspects of their operation and the ex-
pected performance. Chapter 3 gives an overview of the common central electronics
and the SESAME software, which support and control the SESAME instruments.
The succeeding chapters outline the operational concept of SESAME and of its
instruments and present the relevant results from the Rosetta commissioning and
cruise phases till March 2006. We will conclude with a discussion of the knowl-
edge preservation aspects and of the impact of switching the target comet from
46P/Wirtanen to 67P/Churyumov-Gerasimenko on SESAME.

                           2. Overview of Instruments

The SESAME experiment complex consists of several sensors distributed over the
Rosetta lander Philae (Figure 1), the instrument control electronics, and a common
electronics, commanded via the SESAME flight software. The instruments CASSE,
DIM and PP were combined during the payload selection process in order to save
mass and financial resources by developing only one common electronics and one
flight software. This goal was achieved to a large extent and it proved to be easier
to solve the few interface problems, e.g. shielding CASSE and PP sensors of each
other in the soles, within the SESAME team. The combination offers the possibility
to use the data from one instrument to modify the operation parameters of another
instrument within the same measurement sequence. Some of the SESAME sensors
were mounted on other units of Philae that offered the advantage of a placement
(“free ride”) on the cometary surface. Hence SESAME did not need any transport
mechanism of its own at the expense of minor interface problems.

2.1. CASSE

The outermost surface layers of cometary nuclei are evolving during every passage
through the inner part of the solar system. Thus they do not show their pristine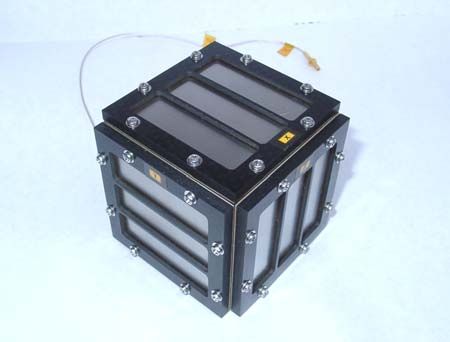
304                                 K. J. SEIDENSTICKER ET AL.

Figure 1. The Rosetta lander Philae shown in landed position with unfolded legs. The SESAME
sensors are encircled and the Philae units carrying them are indicated by their designations. The feet
are marked with their directional designations +Y, −Y and +X.

composition and structure, but they are indicators of the cometary evolution history.
Depending on the level of cometary activity (eroding the surface), the internal
structure and the fraction of non-volatile matter one can expect cometary surfaces
ranging from bare, sintered ice areas to thick layers of fluffy regolith. The latter kind
has probably been observed on comet 9P/Tempel 1 during the crash of the Deep
Impact probe (A’Hearn et al., 2005). Under solar insolation, a composition of ices
of different volatility will result in a stratification of the surface layer. Apart from
preserving the evolution history, the surface layer determines by its parameters for
heat and gas diffusion the future cometary evolution.
    The Comet Acoustic Surface Sounding Experiment (CASSE) on Philae will be
used to investigate the surface layers of comet 67P/Churyumov-Gerasimenko by
applying active and passive methods. As CASSE can generate and register elastic
and inelastic vibrations with frequencies in the range from about one hundred Hz
to a few kHz, this method is called acoustic sounding because the frequencies
are in the audible range. Excited elastic waves that are transmitted through the
cometary matter beneath Philae and recorded by CASSE sensors allow one to
detect wavefronts traveling with longitudinal and shear wave velocity. Depending
on the tensile strength of the surface material and its mechanical contact to the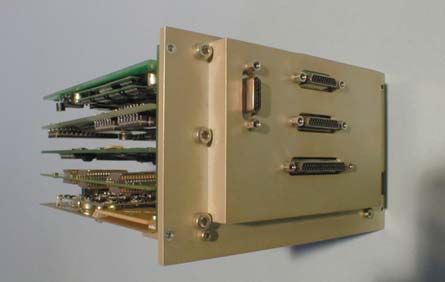
SESAME – AN EXPERIMENT OF THE ROSETTA LANDER PHILAE                           305

lander soles, we expect to study lateral and vertical elastic and structural properties
of the surface layer over the foot-distance of about two meter. The primary goal of
CASSE is to determine elastic parameters like Young’s modulus and the Poisson
ratio as well as their daily and seasonal variations by analyzing the registered signal
profiles of repeated active soundings. Additional goals are:
    r The monitoring of thermally or impact-caused cometary activity and the lo-
      calization of activity spots;
    r The determination of the macro-structure of the comet surface, such as the
      expected layering or embedded inhomogeneities, by using refraction and/or
      reflection seismograms;
    r The study of emitted particles impacting on the soles during the in-orbit vali-
      dation phase as well as during the descent to the cometary surface.

2.1.1. Instrument Concept
The Philae landing gear has three legs and feet, where each foot has two separate
soles (Figure 1) with the CASSE sensors mounted into these six soles. The left sole
of each foot (seen from the outside) contains the transmitter i.e. an actuator made of
stacked piezoceramics that can also be operated as receiver (Figure 2). A tri-axial
piezoelectric accelerometer (Brüel and Kjaer type 4506, Delta-Shear configuration
with built-in pre-amplifier) mounted in the right sole is used as the primary receiver.
Careful shielding with conducting Kapton foil was put in place in order to avoid

Figure 2. Photograph of the transmitter sole (left) and its black cover (right) of Philae foot +Y.
The sole (ring diameter: 101 mm) contains an insulated wire-mesh acting as an electrode for the PP
instrument. Above the mesh and between two glass-fiber bearings, the CASSE piezo-stack transmitter
is mounted. The transmitter is wrapped in a conducting and grounded Kapton foil to provide shielding
for PP.
306 K. J. SEIDENSTICKER ET AL.
any parasitic capacities from CASSE on PP and maintaining a stiff connection of
the CASSE sensors with the soles. The temperature of each accelerometer and
each transmitter will be measured with PT1000 thermal resistors placed below the
shielding foil.
Protection struts mounted in the central part of the inner side of the lids (Figure 2)
should help to avoid a breach of the glass-fiber soles during landing. A special
mechanical suspension system allows the soles to adjust automatically in height
by about 10 cm during landing, in order to guarantee sufficient ground contact
for different surface topographies. Philae will be pulled on the comet by the two
harpoons MUPUS ANC (Spohn et al., this issue) providing a fixation force of at
least 5 N per sole that will improve the contact between sole and cometary surface.
CASSE will measure vibrations of the foot soles in all three axes caused by
elastic waves traveling through the cometary surface. In the active operation mode,
the transmitters will generate pulsed elastic waves. Due to the known distances
between transmitter and receiver soles and the known time of wave generation, it
is possible to derive the wave-velocity. In the passive operation mode CASSE is
listening to elastic waves generated either by other instruments like MUPUS PEN
or by thermally or impact-caused cometary activity.
The sole contacts with the cometary surface can be considered as point-like
sources. For such a point-like source, elastic wavefronts are emitted that propagate
with longitudinal as well as shear wave velocities containing displacement compo-
nents parallel and perpendicular to the wave-vector (e.g. Achenbach, 1973). This
holds also if the wavefronts propagate along a surface. In this case an additional
head wave is generated in order to maintain the boundary conditions at the sur-
face, and as a result the wavefronts are damped. CASSE is designed to measure
the arrival times of the wavefronts in order to derive the longitudinal and shear
wave propagation velocities c p and cs and from these finally the elastic parameters
Young’s modulus E and Poisson ratio ν of the porous surface material:
4cs2 − 3c2p
E = ρ cs2 (1)
cs2 − c2p
and
cs2 − 12 c2p
ν= , (2)
cs2 − c2p
assuming that the surface is quasi-isotropic over the scale of a wavelength
(Kretschmer, 2000). A starting value for the density ρ of the material will be the
global value for 67P/Churyumov-Gerasimenko determined with the orbiter instru-
ments. The KOSI experiments showed that the density of an evolving surface layer
changed by at most 20% (Hesselbarth et al., 1991).
A major challenge in cometary science is to understand the phenomenon of
cometary activity. Outgassing in active areas, thermal stresses between surface andSESAME – AN EXPERIMENT OF THE ROSETTA LANDER PHILAE 307
subsurface layers, and impacts of larger micrometeorites can all cause vibration
signals. CASSE listening data might allow one to determine the frequency of such
events at least close to Philae and to locate the epicenters of activity in cooperation
with orbiter imagery.
Due to the largely unknown characteristics of the cometary surface, it is difficult
to estimate the propagation environment, e.g. wavelength compared to layering
dimensions. In combination with sensitivity and operation limitations of CASSE
(see below) not all of the before mentioned operation modes may be possible. Thus
we will check other suitable measuring modes.
In case the attenuation of the signals on the cometary surface is too large, the
mechanical resonance frequencies of the soles might be exploited as well. These
frequencies will change depending on the fixed force exerted by the Philae anchors,
the temperature dependent stiffness of the sole glass fiber and the elastic properties
of the surface matter. By modeling and calibration measurements, it should be
possible to deduce elastic properties. This measuring technique has been applied
for non-destructive defect detection in multilayer structures (Lange, 1994).
Operation of the CASSE sensor system like a phased array and evaluating the
obtained time-series signals with an appropriate method like the Total Focusing
Method (Holmes et al., 2005) might yield better information than comparing time
series data vs. signal distance (seismogram technique) about the layered structure
or the scatterers beneath Philae. However, it is presently unknown whether this
operation mode is feasible considering the small number of sensors and the limited
data transfer volume available.
Besides the electronics for acoustic measurements the CASSE PCB contains
a radiation sensitive field-effect transistor (RadFET). It delivers a signal of the
cumulated ionizing radiation dose, which can be read when the CASSE analog
circuit is powered. The evaluation of the dose-signal, which is complicated by
the rather complex and time-dependent composition of the radiation field, has
been prepared by theoretical investigations and irradiation tests on ground (Fischer,
2002). In conjunction with the sophisticated SREM radiation monitor on the orbiter
the SESAME RadFET dosimeter can be used to monitor the radiation environment
of the flight electronics in-situ, which might help to improve the shielding design
of future spacecraft.
2.1.2. Performance
Very little is known about the surface of the target comet 67P/Churyumov-
Gerasimenko, neither its topography (smooth or rough) nor its configuration (chem-
ical composition and mechanical structure). Furthermore, the sensors will experi-
ence large temperature variations, both diurnal and seasonal, that will change the
sensitivity of the receivers and the transmitters as well as alter the elasticity of the
foot soles.
The technical realization of CASSE was challenging, as it is the first instru-
ment of its kind in space apart from the Apollo seismometers and the Huygens308 K. J. SEIDENSTICKER ET AL.
atmospheric acoustic sensor. The foot and sole concept of Philae was changed sev-
eral times during development requiring major revisions of sensor placement and
integration procedures. The use of three 3-axes accelerometers as receivers and
three transmitters, which can also operate as single-axis receivers, offers a lot of
redundancy. In addition, the penetrator PEN of the MUPUS experiment (Spohn
et al., this issue) and possibly the drill mechanism SD2 (Finzi et al., this issue)
onboard Philae can be used as strong secondary signal sources. The operation and
performance data of the CASSE sensors are given in Table I.
The attenuation within the cometary surface layer and the contact between
the soles and the cometary surface, i.e. the ability to induce and to receive sig-
nals, is largely unknown. The contact with the cometary surface strongly de-
pends on the pressure caused by the force exerted by the Philae anchors (nom-
inally about 5 N per sole) and the elastic properties of the soles and the surface
matter.
To prove that CASSE like sensors can achieve reasonable results several elastic
wave propagation experiments have been conducted with various materials simu-
lating different cometary conditions. These laboratory studies of regolithic dust and
sand as well as frozen ice/dust mixtures showed that acoustic sounding can be ap-
plied to cometary surfaces as well (Kochan et al., 2000; Kretschmer, 2000). Figure 3
presents sound transfer data measured with an ice-mineral sample. A sound velocity
of 700 ± 60 m/s has been derived from the arrival times of the P-wave. Also visible
is the strong decrease of the signal strength with distance (ca. 32 dB/m) making
measurements over the Philae foot distance of 2.2 m difficult. The panels also show
two other problems related to CASSE operation. Depending on sensor channel
selection and receiving frequency rather large offsets of the zero line occur. If the
amplification is too large, signals are cut off by the 8-bit analog-digital-converter
used (see lower part of the upper profile).
TABLE I
CASSE sensors performance data
Parameter Range Comment
Receiving sampling rate 76.3 Hz to 100 kHz Single channel, 1311 steps
Frequency bandwidth 3 Hz to ca. 3.3 kHz −10 dB points of the analog
electronics
Measuring range 5.4 10−3 to 230 m s−2 Tri-axes accelerometer
Temperature sensitivity of 0.1%/K Y and Z axes
tri-axes accelerometer 0.05%/K X axis
Generated frequency 1.2 Hz to 25 kHz Depending on sampling rate and
channel number
Temperature range −160 to +100 ◦ C Operation range of sensorsSESAME – AN EXPERIMENT OF THE ROSETTA LANDER PHILAE 309
Figure 3. Sound transfer via a frozen Dunite sand bed. Laboratory models of the CASSE receiver
soles were placed at distances of 40 cm (ACC1) and 80 cm (ACC2) from a CASSE transmitter sole
(from Seidensticker et al., 2004).
Schieke (2004) supported the experimental studies and the underlying CASSE
analysis by conducting numerical simulations of elastic wave propagation through
porous media. These simulations suggested ways to determine the attenuation fac-
tor, and how to measure porosity and the mean pore radius of the cometary surface
material from the wave velocities. The knowledge of the porosity is needed for
modeling the gas flow. In addition to the experimental and numerical studies that
will continue we analyze external vibrations observed during the cruise phase (see
chap. 5) to improve the operation and analysis methods.
2.2. DIM
When the ice on a cometary surface is heated by solar radiation, the gas molecules
released by the ice sublimation drag grains composed of refractory (dust) and
volatile (ices) matter from the cometary surface. Due to the combined action of
gas drag and gravitational forces grains are either ejected into space becoming
part of the interplanetary dust (smaller particles) or are drawn back by gravity
onto the cometary surface (larger particles). The goal of the Dust Impact Monitor
(DIM) instrument of SESAME is to improve our knowledge about these particulate
constituents of comets. DIM will obtain quantitative data on:
r Directional statistics of impacting particles;
r Velocity and mass distribution of back-fallen particles.310 K. J. SEIDENSTICKER ET AL.
These data will be collected over an extended time period in order to find possible
correlations with the cometary diurnal and orbital phases. The analysis of these
data should help to:
r Improve our models of the distribution and the flux of near-surface dust and
small particles as a function of their size and velocity;
r Understand cometary activity with its underlying processes;
r Explain the formation of cometary mantles.
2.2.1. Instrument Principle
DIM applies the principle of piezoelectricity to detect and analyze the impacting
cometary particles. An impact evokes a decaying electric signal (burst), which is
a mixture of several frequencies, at the output of the sensor. Nevertheless, at the
beginning of this transient signal a nearly perfect half-sine wave can be observed,
which lasts for the impact duration. The peak voltage is observed when the impact
deformation reaches its maximum (elastic impacts are supposed). During the second
quarter of the sine wave that can be a little bit deformed at the end, the particle
caused deformation decreases until the grain leaves the sensor.
The method for sensing these transients is to compare them with a threshold
level THR (Figure 4). This threshold is the sum of a time-average (approximately:
1 s) of the output signal of the sensor, which is equal to the noise of the electric
circuit plus external noise sources, if no impacts occur, and a margin. The margin
is programmable in order to adjust the sensitivity of detection. As the impact rate
Figure 4. Typical impact signal and its measured parameters (peak amplitude Umax and half contact
duration Tc /2). The parameters of the impacting particle were: mass 4 mg, velocity 0.44 m/s giving
as energy 4 × 10⁻⁷ J. THR is the voltage of a threshold level.SESAME – AN EXPERIMENT OF THE ROSETTA LANDER PHILAE 311
increases, the average will increase autonomously for reducing the sensitivity so
that the system will not be saturated. Events with Umax ≤ THR will not be detected.
During a normal measurement cycle, only two parameters of the individual
impact profiles are determined by the DIM electronics:
r The peak amplitude Umax of the first half-sine of the transient signal;
r The time between the threshold crossing and the maximum amplitude of the
first half-sine Tc /2 (this gives the half contact duration).
DIM has two operation modes. In the Burst Continuous operation mode Umax and Tc
are measured, but at the beginning of a measurement cycle some samples are taken
from the average signal. If the background noise is very high, or the rate and/or the
amplitudes of the burst signals are high, the system automatically switches to the
so-called Average Continuous mode: i.e. only the average signal will be measured.
A model based on Hertz’ theory describing the elastic impact of a spherical
particle (e.g. Johnson, 1987) is used to relate the electric signal of the piezo-ceramic
sensor to particle properties. The relationship between the voltage U of the first peak
of the impact signal, yielded by the piezo-ceramic, and the radius R and the velocity
v of the impacting grain can be written as:
U [V ] = K U (d33 , C, A, ρ) R 2 v 1.2 (3)
with
K U = 3.03(d33 /C)A−0.4 ρ 0.6
where d33 is the piezoelectric constant, C is the capacitance of the sensor segment
and ρ is the specific mass of the impacting material. A is the reduced modulus and
is given by
A = 1 − μ21 /E 1 + 1 − μ22 /E 2
where E1 , E2 are Young’s modules and μ1 , μ2 are the Poisson ratios of the piezo
segment and the grain, respectively. Likewise, the impact duration TC is given by:
TC [s] = K T (A, ρ) R v −0.2 (4)
with
K T = 5.087 A0.4 ρ 0.4
The DIM sensor (Figure 5) has three active sides each made of three piezo-
plates of 50 × 16 × 1 mm3 and facing in orthogonal directions. The other three
sides of the cube are either closed by aluminum plates or are left open (−Z side)
for harness access. The total active area of the sensor that is mounted on Philae’s
balcony (Figure 1) is about 70 cm2 .312 K. J. SEIDENSTICKER ET AL.
TABLE II
DIM performance parameters
Quantity Range
Energy 2·10−11 – 2·10−7 J
Mass 6·10−10 – 8·10−4 kg
Velocity 0.025 – 0.25 m/s
Radiusa 5·10−5 – 6·10−3 m
a Spherical particles with a density of 1000 kg m−3 have
been assumed.
Figure 5. The DIM sensor cube with the three active piezo-plates facing to the +X, +Y and +Z
directions of Philae. Overall dimensions are 71.5 × 71.5 × 69.0 mm3 .
2.2.2. Performance
On 2 January 2004 the NASA Stardust spacecraft crossed the coma of comet
81P/Wild 2 at a distance of 236 km with 6 km s−1 (A’Hearn, 2004). During this
fly-through the counters of the Dust Flux Monitor Instrument (DFMI) on board
Stardust recorded several thousand particles ranging in mass from 10−14 to 10−7 kg
(Tuzzolino et al., 2004). If this comet is representative for 67P/Churyumov-
Gerasimenko, the DIM instrument is qualified to measure at least the higher mass
particles of our target comet (Table II).
Drop tests were carried out, where balls of different materials and size impacted
on the flight sensor. The impact velocity was calculated from the height of dropping.
Figure 6 shows the correlation between calculated and measured signal amplitudes
for steel balls with 1 mm diameter. Although the correlation is very good, the signal
amplitudes Umax calculated using Equation (3) are 3 times greater than the measured
ones because the elastic constants Young’s modulus and Poisson ratio of the piezo
plates with layers of silver and titanium could only be estimated.SESAME – AN EXPERIMENT OF THE ROSETTA LANDER PHILAE 313
Figure 6. The correlation between calculated and measured signal amplitudes for steel balls (diam-
eter: 1 mm) falling on the DIM flight sensor.
2.3. PP
One of the main characteristics of active comets is the ejection of large quantities
of water molecules. Any water ice at the comet’s surface would sublimate close to
the sun due to solar irradiation leaving behind either a refractory matrix or larger
dust particles. Thus the remaining ice can only be stable below the surface of active
comets, where a regolith layer of unknown thickness reduces the heat influx. The
depths of the ice layers and the details of the transport mechanisms of evaporated
gas molecules to the surface are still unknown. As water ice dominates the electrical
properties of its immediate surrounding, measuring and monitoring these properties
will help to improve the understanding of gas transport and surface evolution. The
aim of the Permittivity Probe (PP) instrument as part of the SESAME experiment
is to determine:
r Electrical properties of the cometary surface matter and their diurnal and
orbital variation
r Electron density variations close to the cometary surface as a function of the
comet’s outgassing activities.
The instrument measures the complex permittivity, i.e. the electrical conductivity
and the dielectric polarisability of the cometary surface material. At frequencies
below 10 kHz, the instrument is especially sensitive to the water ice content of the
surface matter and its temperature behavior. Only the material inside the half-sphere
with a radius of half the transmitter electrodes’ distance contributes significantly
to a measurement. As it is possible to select different electrode geometries of PP,
the permittivity at different depths can be determined down to about two meters
below the surface, localizing layers with different electrical properties and their314 K. J. SEIDENSTICKER ET AL.
variation with time. The spatial resolution is in the order of 10% of the electrode
distances.
Electrostatic and electromagnetic waves are generated by the interaction of
the solar wind with the charged dust and ionized outgassing products of the comet
nucleus. The resulting plasma waves can be monitored by PP in its passive operation
mode with two receiver electrodes.
The measured and derived values are input parameters for an improved modeling
of the properties of the cometary nucleus surface layer and the processes occurring in
it. These models are a prerequisite for the interpretation of those lander- and orbiter-
based experiments that aim to determine the abundances of chemical elements in
the volatile primordial cometary material.
2.3.1. Instrument Concept
The PP instrument is based on a quadrupole array technique. Two electrodes are
connected to an AC-current generator and induce a variable potential in the comet’s
surface, which is measured via two additional sensors (Grard, 1990a, b). The shapes
of the electrodes, the configuration of the array and the location of the electrodes
above or below the surface are non-critical. With an additional transmitting elec-
trode, the geometry and thereby the observed material volume can be changed
besides adding redundancy.
By injecting an alternating current of different frequencies into a medium and
monitoring simultaneously the generated potential amplitudes and phase shifts be-
tween potential and current, one can deduce the dielectric properties of the medium.
While for many substances the frequency dependence of the response is most pro-
nounced in the MHz or even GHz range, water ice displays a significant variation
of the permittivity at low frequencies. Below 10 kHz and at temperatures between
−80 ◦ C and −2 ◦ C, the dielectric constant of water ice can vary by an order of
magnitude. The asymptotic permittivity values for low frequencies and the fre-
quency range of the main transition region characterize the water ice content and
the temperature of the subsurface material. As this method is an integrating bulk
measurement dominated by water ice, the influence of mechanical and chemical
properties of other matter with small dielectric constant is below the detection level
of PP.
The PP instrument generates current/voltage/phase-shift data triples correspond-
ing to the selected measurement frequency. These data, combined with detailed
knowledge of the electrodes’ geometry and location, as e.g. available from Phi-
lae’s CIVA stereo camera system (Bibring et al., this issue), can be translated into
frequency dependent complex permittivity values ε.
ε = εr − iσ/(ε0 ω) (5)
Here, εr is the relative permittivity, σ is the electrical conductivity, ε0 is the vac-
uum permittivity and ω = 2π f is the applied angular frequency of the induced
current. The relative permittivity εr and electrical conductivity σ can be expressedSESAME – AN EXPERIMENT OF THE ROSETTA LANDER PHILAE 315
as functions of the measured potential difference amplitudes U0 , the measured am-
plitudes of the injected current I0 , and the phase difference ϕ between current and
potential by using the frequency and geometry dependent impedance Z0 . The factor
G (dimension: 1/ length) takes into account the electrode geometry and thereby the
measurement volume size.
εr = |2Z 0 I0 /U0 cos ϕ| (6)
σ = |2 ω ε0 Z 0 I0 /U0 sin ϕ| (7)
Z 0 = |G/(4π ω ε0 )| (8)
G = 1/D Rx1 T x1 + 1/D Rx2 T x2 − 1/D Rx1 T x2 − 1/D Rx2 T x1 (9)
Variables D Rn T m are the distances between the centers of receiver electrode n and
transmitter electrode m. G becomes zero for a symmetrical configuration of the
four electrodes, as the receiver electrodes are then placed on the same potential
lines where the quadrupole arrangement is insensitive to the induced electrical
field. The expression for the impedance Z0 has been simplified by assuming point
electrodes. For detailed data analysis the impedance of the actual electrodes, cables
and the landing gear structure has to be modeled using a complex network modeling
approach.
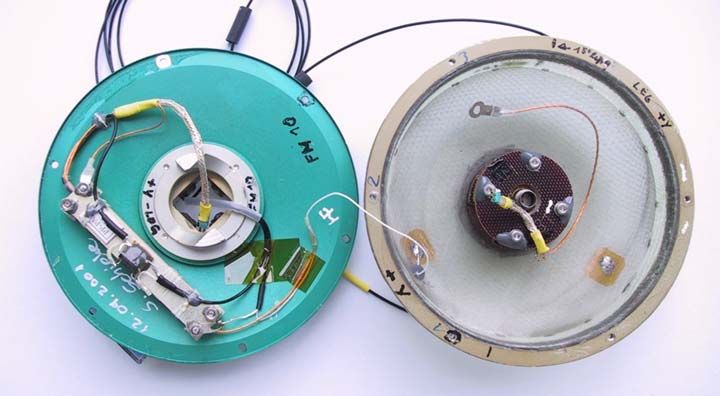
The two PP receiver electrode assemblies for potential difference measurements
are integrated into the soles of the +Y and −Y landing-gear feet. Each foot includes
a high-impedance pre-amplifier (Figure 7) that eliminates the impact of parasitic
capacitances in harness and connectors on the measurement. An electrode in the
+X landing-gear foot soles is used as one of the three current transmitters. All
foot electrodes consist of insulated wire meshes inside the respective soles. The
electrodes and the lids of the two soles of each foot are connected by coax ca-
bles. The second transmitter electrode is integrated into the lid of the APXS de-
tector assembly (Klingelhöfer et al., this issue), the third transmitter electrode is
a flexible mesh mounted at the insertion end of the MUPUS hammering device
PEN (Spohn et al., this issue). All electrodes are electrically insulated from their
surroundings.
Changing the quadrupole array geometry by selecting either different transmitter
electrode combinations or taking data with the APXS electrode placed on different
surface positions after rotating Philae’s body one can also derive a vertical depen-
dence of the measured parameters, as the depth of the studied surface layer volume
depends on the distance between the transmitter electrodes used.
The PP electronics is able to digitally generate any sinusoidal wave with a fre-
quency between 10 Hz and 10 kHz and with variable peak-to-peak amplitudes up
to 20 V between the two transmitter electrodes. The monitor part simultaneously
acquires sample pairs of transmitter current and receiver potential differences. The
current can be monitored in either of the two selected transmitter systems. An elec-
tronic switch allows connecting the two current generator poles to any two of the316 K. J. SEIDENSTICKER ET AL. Figure 7. Accelerometer sole and cover of Philae foot +Y. The sole (right, ring diameter: 101 mm) contains the insulated wire mesh used as an electrode for PP and above it mounted in between two glass-fiber clamps the CASSE three-axis accelerometer. The PP pre-amplifier is mounted on the inner side of the lid (left). three transmitter electrodes. The electrode selection determines the quadrupolar array geometry and allows selecting the subsurface volume involved in the mea- surement. As the exact contact properties between comet surface material and sensor elec- trodes are unknown, only capacitive coupling is used. For the transmitter electrodes the exact capacitances do not matter, as the current is measured directly. For the two receiver electrodes, we measured 30.1 pF and 20.9 pF for the +Y and −Y feet, respectively. All electrically conductive material in the vicinity of the electrodes, including the sensor harness, is surrounded by a guarding system, which is actively kept at a potential very close to that of the electrodes but does not form a part of the measurement circuitry. This minimizes the influence of stray capacitances by 98%, which otherwise would dominate the sensor arrangement. Phase and magnitude of the measured parameters are calibrated by modeling the deployed electrode con- figuration on the comet and comparing the results with calibration data obtained before launch. In the passive operation mode, when no current is injected into the comet surface, the receiver electrodes will follow the natural plasma potential at the landing gear foot positions. This will change in a characteristic way, if outgassing activities occur in Philae’s vicinity. Acquiring the potential difference variations with a sampling frequency of 20 kHz and calculating the power spectrum of the resulting potential time series allows one to detect plasma waves as a consequence of such activities (Laakso et al., 2002).
SESAME – AN EXPERIMENT OF THE ROSETTA LANDER PHILAE                 317

                                        TABLE III
                          PP parameters for Active Mode operation

              Parameter                              Value

              Transmitter frequency                  10 Hz to 20 kHz, sine
              Number of frequencies used             1 to 20
              Maximum peak-to-peak voltage           20 V, adjustable
              Phase angle resolution                 1◦
              Current/Voltage amplitude resolution   5. . .15%, SNR-dependent

   A small wire mounted close to the DIM sensor on top of Philae is operated as
a plasma wave detector. This wire will pick up electrical field variations due to
plasma waves, and charges a capacitor to a predefined voltage level. The faster this
level is reached the larger is the AC-component of the field. The time required for
reaching the detection level is reported as plasma wave detector signal and is nearly
independent of the field’s frequency.

2.3.2. Performance
While PP is not capable to determine absolute permittivity values with high accu-
racy, its strength lies in the possibility to monitor diurnal variations of the nucleus’
behavior while the comet is approaching the Sun. The results could give a bet-
ter understanding of the comet’s activation mechanism. Table III summarizes the
instrument’s performance parameters for permittivity measurements.
    Figure 8 presents a simulated potential distribution on the cometary surface
during active measurements. The location of the MUPUS PEN electrode is only an
example. After deployment it may be located anywhere outside the circle through
the foot electrodes TX, RX1 and RX2. The exact position will be determined by
using CIVA stereo-camera data. The location of the electrode at the APXS sensor
will be inside the dashed line indicating the lander body.
    As the measured permittivity at different frequencies depends on ice concen-
tration, ice type, ice composition and its temperature, the resulting ambiguity can
only be resolved by fitting the measured curves to reference data derived from
laboratory and field measurements. Using measured local temperature and thermal
conductivity data from the MUPUS sensors, the determination of water ice content
can be significantly improved.
    Figure 9 shows measurements of the complex permittivity as a function of fre-
quency and temperature using a PP laboratory model (Virtanen, 2006). A sample
with a sand/water ice mass ratio of 9:1 was used. Depending on the ice concen-
tration, the low frequency values of the relative dielectric constant can vary up to
90.
318 K. J. SEIDENSTICKER ET AL.
400
PEN
350
300
250
RX1 R X2
Y [cm]
200
150
100
foot TX
50
50 100 150 200 250 300 350 400
X [cm]
Figure 8. PP-induced simulated potential distribution on the cometary surface. The electrodes in
MUPUS PEN and foot +X (TX) are active. The dashed line indicates the lander body position.
Simulation parameters: TX voltage 20 Vpp , electrode capacitances 0.85 pF (PEN) and 8.6 pF (foot
TX). The resulting potential at the receiving electrodes (RX1 and RX2) is 213.6 mVpp and 246.8 mVpp ,
respectively.
Figure 9. PP laboratory measurements on 20 February 2006 of the frequency dependence between
0.4 and 10 kHz of the relative dielectric constant (left) and the conductivity (right) of sand with 10%
water ice. This dependence was measured for six temperatures from −60 ◦ C to −10 ◦ C (see legends).
As mentioned before, changing the quadrupole array geometry by selecting
different transmitter electrode combinations or using different APXS positions one
can also derive a depth dependence of the measured parameters. This capability
was verified during prototype field measurements on a frozen lake in NorthernSESAME – AN EXPERIMENT OF THE ROSETTA LANDER PHILAE 319
Finland in 1999 with electronics similar to that used for PP. Varying the transmitter
electrode distances from 80 cm to 170 cm, we deduced an ice layer thickness of
more than 60 cm and less than 75 cm. A borehole showed an actual thickness of
65 cm.
3. General Technical Layout
3.1. C ENTRAL E LECTRONICS
The SESAME electronics comprises the instrument sensors, which are mounted at
various locations of Philae, and the Central Electronics (CE) that is installed in the
Y-EBox of the common electronic boxes inside Philae. The SESAME Central Elec-
tronics (Figure 10) itself is composed of one printed circuit board (PCB) for each of
the instruments CASSE, DIM and PP and components of the common electronics
that is shared by the instruments. A special PCB, the SESAME Experiment Bus,
connects all boards. Power supply and data transfer to and from Philae’s Command
and Data Management System (CDMS) is realized with an interface board that ad-
ditionally carries electronics for power management and housekeeping diagnostics.
Figure 11 shows a SESAME Central Electronics stack ready for integration into
the Philae electrical qualification model.
On hardware top level, each SESAME activity is controlled by a single micro-
computer called Common DPU (C-DPU). It contains a radiation-hard 16-bit micro-
controller (Harris RTX2010RH) with a stack-orientated multiple bus architecture.
Operations on the data stack (256 words) are particularly fast and are optimized by
using the programming language Forth for writing the microcontroller software.
The processor instruction cycle frequency is adjusted to 5 MHz. Communication
with the three instruments is managed via the processor’s ASIC/Gbus, which pro-
vides 3 address and 16 data lines. Memory components of the Common DPU are
a programmable read-only memory (PROM), 64 kByte electrically erasable mem-
ory (EEPROM) and static RAM (SRAM), addressed as one code page and 7 data
pages with 64 kByte each. Thus a maximum of 448 kByte measurement data can be
stored without data transfer to the CDMS. At system reset the boot loader (“C-DPU
Debug Monitor”) will be copied from PROM to SRAM and executed. By default,
the SESAME flight software will be read from the EEPROM one minute later and
executed. This process can be changed via dedicated telecommands to the Debug
Monitor.
The Common DPU board additionally contains a 14-bit analog-digital converter,
which is used to digitize the DIM peak and the average signal voltage as well as all
analog housekeeping values. A Field-Programmable-Gate-Array (FPGA) provides
the memory and power handling, the processor clock generation and watchdog
functions. The FPGA also implements the low-level communication protocol with
the CDMS.320 K. J. SEIDENSTICKER ET AL.
Sensors E-Box
DIM
3D-Sensor DIM Electronics I/F
Housekeeping
(Balcony)
Control
Power
Data
PP
Elec-
SESAME EXPERIMENT BUS
trodes
(Feet,
PP Electronics I/F
MUPUS,
APX,
DIM)
CASSE MUX
Piezo
Sensors, CASSE
Housekeeping
Trans- I/F
mitters, Electronics
PT1000s
(Feet)
Common DPU
MUX/
ADC
Interface Board
SSDAT-M
SSDAT-R
SSCMD-M
SSCLK-M
SSCLK-R
SSCMD-R
+/- 5 V
+/- 12 V
+28 V
CDMS POWER K. Seidensticker, M. Kretschmer
8. July 1999
Figure 10. Block diagram of the SESAME electronics. The three boxes at left represent the SESAME
sensors outside of the Philae Y-EBox. The SESAME Experiment Bus PCB (“mother board”) is
symbolized by the broken rectangle to the right; connection to Philae is via the Interface PCB (bottom).
3.1.1. CASSE
The goal of the CASSE electronics – implemented on a single PCB – was to
realize a triggerable 12-channel transient recorder with a sampling rate of up to
105 samples/s that can be split evenly on an arbitrary number of channels. The
electronics also includes a three-channel selectable signal generator with variable
output frequency for the piezo-actuators. The 12 input channels are connected to
the three tri-axial accelerometers and to the three piezo-actuators, which can also
operate in receiver mode. The received signal coming from the input multiplexer
is amplified with a selectable gain ranging from 1 to 168 (0 to 44.5 dB), con-
verted by an 8-bit analog-to-digital converter (ADC) and continuously recordedSESAME – AN EXPERIMENT OF THE ROSETTA LANDER PHILAE 321
Figure 11. The SESAME electronics stack for the Philae Electrical Qualification Model. The five
printed boards are (from bottom to top): Power/Interface, Common DPU, CASSE, PP and DIM. The
front panel (62×100 mm2 ) has sensor connectors for CASSE, PP and DIM and a diagnostic connector
(left).
in a 128 kByte ring buffer. The transfer function of the ADC is quasi-logarithmic,
using piecewise linear approximation. An FPGA chip controls the data acquisition
hardware, which can operate either in fixed listening mode or in triggered mode
where the signal amplitude is monitored. A trigger event is generated and signaled
to the C-DPU when adjustable lower or upper thresholds are crossed. Because the
CASSE onboard memory is operated continuously in ring buffer mode also pre-
trigger data can be captured. A recorded event is read from the CASSE memory by
the flight software and further processed or handed over to the Philae CDMS for
downlink.
3.1.2. DIM
The low-level electrical output signals of the DIM sensor pass through an analog
multiplexer for selecting the direction (+X, +Y, +Z) of the measurement (i.e. only
one direction can be measured at a time). A wideband logarithmic amplifier is
used to retain the broad dynamic range of amplitudes of the input signals that are
registered by an analog comparator with the help of a threshold circuit. The output
of this comparator controls the peak detector and the measuring circuit for the
contact duration.
All digital circuits of DIM are embedded into an FPGA, except a sim-
ple interface circuit, which is constantly powered by +5 V (even during OFF
state of DIM), for the connection to the SESAME Experiment Bus. The
DIM PCB contains a few additional circuits for testing its functional behav-
ior. These circuits are used for checking the power supply voltages (±5 V),
when all circuits of DIM are in ON state, the transfer characteristic of the log-
amplifier, the duration (contact time) measuring circuit, and finally the sensors by322 K. J. SEIDENSTICKER ET AL.
switching an electric pulse to one sensor direction at a time and measuring its
response.
3.1.3. PP
The PP electronics consists of a sequencer implemented on a radiation hardened
FPGA, a 32 kByte RAM memory and three separate analog electronics groups for
transmitter sine wave generation, receiver and monitor data collection, and the wave
detector, respectively. In stand-by mode, all three groups and the sequencer’s clock
are powered off by independent CMOS switches to conserve power. The transmitter
signal is generated from a data vector stored at a fixed address range inside the RAM.
According to configurable timing constraints, the values are cyclically retrieved,
converted into voltages symmetrical to 0 V and fed into two of the three transmitter
electrodes. This allows the generation of sine waves between 10 Hz and 20 kHz and
amplitudes between 0.3 V and 20 V.
Prior to a measurement, the SESAME flight software transfers all required
parameters to the PP sequencer, which will then perform the data acquisition au-
tonomously. Data are stored in the dedicated memory and the completion of the
activity is reported back to the flight software.
3.2. SESAME S OFTWARE
The SESAME software consists of two different types of programs:
r The flight software is installed on the Common DPU of the SESAME lan-
der unit. It is responsible for the autonomous (event, time tag or command
controlled) sequence of measurements performed during the mission. The
program code is implemented in the programming language FORTH-83 to
take maximum advantage of the command structure and specific architecture
of the Harris RTX2010 RH processor.
r The ground software is part of the Electrical Ground Support Equipment
(EGSE) to facilitate (a) the preparation and correct formation of telecom-
mands, parameter tables and software patches that are sent from the ground
station to the lander, (b) to unpack and format the SESAME science and
housekeeping data arriving at the EGSE, (c) to provide a quick-look soft-
ware for data assessment, and (d) to produce files for instrument related data
analysis and archiving. These tasks are presently covered by various software
programs written in the programming languages TCL/TK, C++ and Delphi
and will in the next few years become part of the SESAME EGSE software
called AliBaba, which already covers main items of the functionality (b) and
(c).SESAME – AN EXPERIMENT OF THE ROSETTA LANDER PHILAE 323
3.2.1. Flight Software
General concept
The main task of the SESAME flight software is to provide overall control of
the scientific experiments of the instruments CASSE, DIM and PP by decoding
incoming telecommands, to control and co-ordinate the various operation modes
of the three instruments, to evaluate and format the SESAME science data and
to organize the data flow between SESAME and the lander CDMS. Additionally,
the flight software is responsible for the collection and delivery of the SESAME
housekeeping data.
SESAME can be considered as a cluster experiment of three instruments with a
broad range of sensors and operation modes being networked by various interde-
pendencies. Accordingly, the SESAME control software must accommodate this
complexity while satisfying a variety of quality assurance goals such as simplic-
ity, robustness and error tolerance. These requirements are best met by a modular
design of the software, which allows flexible adjustments to new operation modes
and facilitates general code maintenance during the long-term mission.
Flight software architecture
The software tasks are divided into sub-tasks, which in turn are assigned to different
layers (levels) or different modules of the software architecture. The SESAME flight
software architecture is organized in both level and module structures (Figure 12).
Four levels may be distinguished:
r Low-level access to hardware interfaces and science experiment control;
r Communication layer, controlling telecommand and data transfer;
r Execution of telecommands and processing of science data;
r Processing of global data like Philae and SESAME status parameters as well
as time and timers.
Telecommands dedicated to SESAME are generally laid down in the Stored
Telecommand Buffer (STCB) of the Philae Command and Data Management Sys-
tem (CDMS) and will enter SESAME via the C-DPU BIOS (Basic Input Output
System) and the software CDMS interface. Commands may be received without re-
quest (e.g. time-tagged) and are then passed over to the Stored Telecommand Buffer
Input or may be requested by SESAME and are then directly decoded and distributed
upon receipt. The telecommand decoding and distribution module checks the in-
tegrity of incoming telecommands and prepares and initiates their execution, thus
acting upon the CASSE, DIM or PP measuring modules and their respective in-
strument hardware front ends. The Global Data and SD Output modules handle the
output of global data and science data, respectively. The Housekeeping Module or-
ganizes the housekeeping data collection. The Backup RAM Buffer allows various324 K. J. SEIDENSTICKER ET AL. Figure 12. Architecture of SESAME flight software with main functional groups. The upper and lower dotted lines indicate the interfaces to the CDMS and SESAME hardware. There are essentially four functional groups: (1) Handling of telecommands (upper central blocks), (2) instrument control and data evaluation (lower left blocks), (3) output modules including housekeeping (upper left and right blocks), and (4) modules for memory administration and error handling (lower right). interactions with other lander experiments. Specific routines are dedicated to error handling and dynamic access to the SESAME memory. Implementation status The flight software release FM 1.0, presently flying onboard of Philae provides all procedures for the autonomous control of a basic SESAME functionality. Due
SESAME – AN EXPERIMENT OF THE ROSETTA LANDER PHILAE                 325

to several circumstances, e.g. several changes of the Philae landing gear foot and
sole design during development required a shift in man-power, we were not able
to define and implement all operation modes, especially for CASSE and PP. Thus,
it is planned to upgrade the flight software in future releases during the ongoing
mission.
    Features that will be implemented in the next release:
    r New CASSE Triggered Mode for event-controlled signal registration
    r Correction of CASSE FPGA program fault (missing reset) by flight software
     work-around
    r Addition of DIM main module and minor improvements to allow autonomous
     DIM operation
    r Revised PP algorithms for instrument settings
   Features planned for flight software release FM 3 include:
    r Increased autonomy of CASSE operation modes, e.g. automatic gain setting
    r CASSE averaging mode for increasing the signal-to-noise ratio of weak sig-
     nals
    r General optimization of measuring modes based on laboratory experiments

3.2.2. EGSE Software
Early development of SESAME hardware and software as well as integration into
Lander models was sufficiently supported by DOS routines that processed the
SESAME raw data (Rosetta telemetry format) to parse them in tabular format. The
transition from the development to the operational phase required a more versatile
tool for a quick and intuitive check of the instrument data. Thus at the end of the year
2001 we started the development of the SESAME EGSE software, appropriately
called “AliBaba”. The goals of this software program are:
    r Create one tool for quick-look and validity check of SESAME science and
      housekeeping data generated by the lander models (FM and GRM) as well as
      by the SESAME EGSE.
    r Provide a simple tool (graphical interface) to be used by all SESAME team
      members as well as other interested parties (e.g. SONC).
    r Allow easy browsing on telemetry data level.
    r Export data in a still to be defined format (e.g. PDS).
Since then AliBaba evolved to an indispensable tool that has been used for integra-
tion checking, development of operation procedures, and analysis of commissioning
and cruise phase data.
   The SESAME telemetry data packets are usually merged into one file in Rosetta
Lander Binary (ROLBIN) format. This file comprises science telemetry packets,
which contain measurement data of the instruments accompanied by appropriate
meta-information, and housekeeping telemetry packets, which essentially provide
326 K. J. SEIDENSTICKER ET AL.
information on the instrument status. The first task of AliBaba is to extract all pack-
ets and rebuild the included science and housekeeping data. The meta-information
(operation modes) is displayed (Figure 13) to allow the user to select data of
interest.
AliBaba has been developed in Delphi (an extension of the programming lan-
guage PASCAL) and runs under MS Windows 2000 and XP. All science and house-
keeping data can be displayed using calibrations supporting the different hardware
used in space and on the ground. A hex editor with context highlighting was imple-
mented to dump the raw telemetry and science data for debugging purposes. The
development of AliBaba continues with the main goal to support the development
of our next flight software version and the checkout of the data generated with it. In
addition, it is intended to enlarge the analysis methods and implement data export
functions.
Figure 13. Main window of AliBaba depicting the SESAME science operation modes (column
“Type”) conducted during the Philae passive checkout of 7 March 2006. The “Length” column
indicates the data volume in bytes of each mode.You can also read