An analysis of new functionalities enabled by the second generation of smart meters in Sweden
←
→
Page content transcription
If your browser does not render page correctly, please read the page content below
Härnösand Energi & Miljö AB, HEMAB

An analysis of new
functionalities enabled by the
second generation of smart
meters in Sweden
Master’s thesis project REPS

                           Author: Jose Drummond
                           Supervisor: Magnus Perninge
                           Examiner: Sven-Erik Sandström
                           Supervisor at company: Lisa Jodensvi
                           Växjö, Sweden 2021

                           Course code: 5ED36E, 30 credits
                           Department of Physics and Electrical
                           Engineering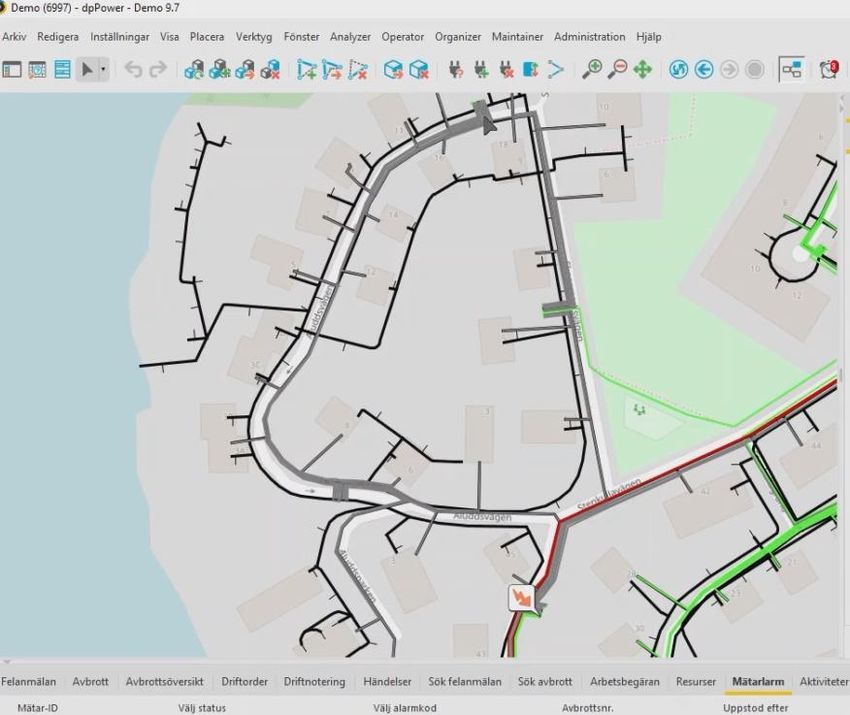
II
Abstract
It is commonly agreed among energy experts that smart meters (SMs) are the
key component that will facilitate the transition towards the smart grid. Fast-peace
innovations in the smart metering infrastructure (AMI) are exposing countless
benefits that network operators can obtain when they integrate SMs applications
into their daily operations.
Following the amendment in 2017, where the Swedish government dictated
that all SMs should now include new features such as remote control, higher time
resolution for the energy readings and a friendly interface for customers to access
their own data; network operators in Sweden are currently replacing their SMs for
a new model, also called the second generation of SMs. While the replacement of
meters is in progress, many utilities like Hemab are trying to reveal which
technical and financial benefits the new generation of SMs will bring to their
operations.
As a first step, this thesis presents the results of a series of interviews carried
out with different network operators in Sweden. It is studied which functionalities
have the potential to succeed in the near future, as well as those functionalities
that are already being tested or fully implemeneted by some utilities in Sweden.
Furthermore, this thesis analyses those obstacles and barriers that utilities
encounter when trying to implement new applications using the new SMs.
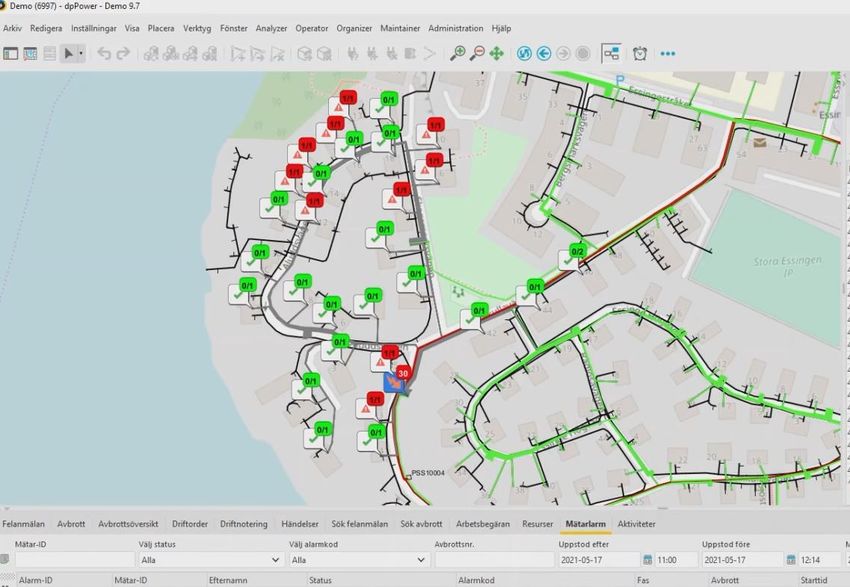
In a second stage, an alarm system for power interruptions and voltage-quality
events (e.g., overvoltage and undervoltage) using VisionAir software and
OMNIPOWER 3-phase meters is evaluated. The results from the evaluation are
divided into three sections: a description of the settings and functionalities of the
alarm, the outcomes from the test, and a final discussion of potential applications.
This study has revealed that alarm functions, data analytics (including several
methods such as load forecasting, customer segmentation and non-technical losses
analysis), power quality monitoring, dynamic pricing, and load shedding have the
biggest potential to succeed in Sweden in the coming years. Furthermore, it can
be stated that the lack of time, prioritization of other projects in the grid and the
integration of those new applications into the current system seem to be the main
barrier for Swedish utilities nowadays. Regarding the alarm system, it was found
that the real benefits for network operators arrive when the information coming
from an alarm system is combined with a topology interface of the network and a
customer notifications server. Both applications could improve customer
satisfaction by significantly reducing outage time and providing customers with
real-time and precise information about the problems in the grid.
III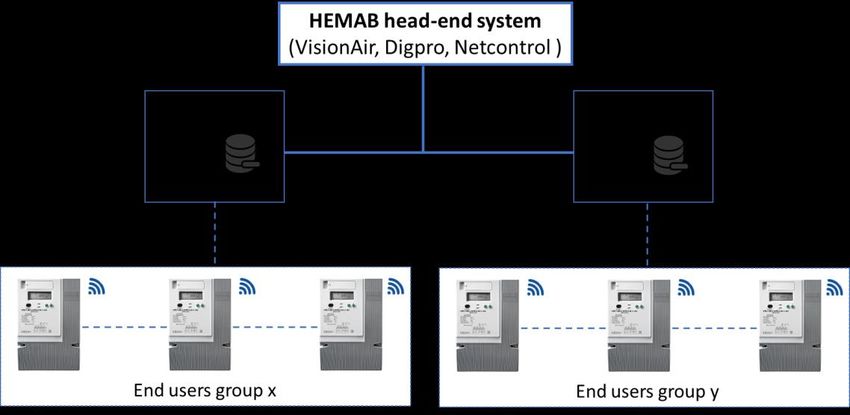
Acknowledgements

   I would like to express my sincere gratitude to my supervisors, Lisa Jodensvi
and Magnus Perninge for their support throughout the project. Your knowledge
and insights have been invaluable and I learned a lot from our discussions.
Without your encouragement and guidance, this thesis would have never taken
shape.

    I would like to thank the employees at Hemab who helped me during this
process. Despite not being able to visit the offices due to the current situation, I
take with me substantial experience and good memories. My special thanks to
Erik Gradin and Robin Eliasson, who took the time to answer all my questions,
discuss my ideas and give me always great feedback.

   I wish to thank all participants in the interviews for the time they took for me
and all those insightful comments you gave me.

    My profound gratitude to the Swedish Institute who supported me financially
during the entire master program.

   Many thanks to my lovely friends Albert and Annika, for your moral support
and company during the past five months. Every lunch at the library with both of
you kept my motivation going. Tusen tack for all those good moments.

    I want to express my deepest gratitude to my uncle Selvin, who believed in
me from the beginning and opened the door to this beautiful journey. Thank you
for all your support and your crucial mentorship all these years. To my brother
Eduardo for all his guidance during my education. Thank you for always pushing
me to be better and being there every time I needed help.

    Lastly and most importantly, I would like to thank my parents to whom this
dissertation is dedicated. Thank you for your infinite love and sacrifice, without
which nothing would have been possible. You are the main reason I stand here
today. My love and gratitude to you cannot be expressed in words. Los amo!

   This project is funded by Härnösand Energi&Miljö AB, Hemab.

                                        IV
List of abbreviations
AMI advanced metering infrastructure
CIS customer information system
DA distribution automation
DCU data protection unit
DG distribution generation
DR demand response
DSL digital subscriber line
DSO distribution system operator
Ei Swedish Energy Markets Inspectorate
FACTS flexible alternating current transmission system
HAN home area network
HEMS home energy management system
HVDC high voltage direct current
IED intelligent electronic devices
IoT internet of things
LV low voltage
MDMS meter data management system
NIS network information system
OMS outage management system
PLC power line communication
PSA power system automation
SA substation automation
SG smart grid
SM smart meter
SMI smart metering infrastructure
TDHi total harmonic distortion current
TOU time of use
TSO transmission system operator
WI-MAX world-wide interoperability for microwave access

                                         V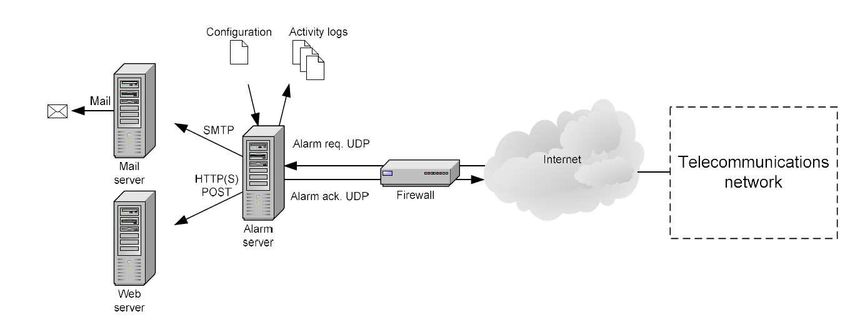
Table of Contents
Abstract ____________________________________________________ III

Acknowledgements ___________________________________________ IV

List of abbreviations ___________________________________________ V

Table of Contents _____________________________________________ VI

1. Introduction ________________________________________________ 2
   1.1 Background .............................................................................................. 2
      1.1.1 Smart Meters ____________________________________________ 2
      1.1.2 Smart Meters in Sweden ___________________________________ 2
      1.1.4 HEMAB _______________________________________________ 3
   1.2 Problem statement.................................................................................... 3
   1.3 Limitations and Assumptions .................................................................. 4

2. Literature Review ___________________________________________ 6
   2.1 Smart Metering System ........................................................................... 6
      2.1.1 Smart Grid Overview _____________________________________ 6
      2.1.2 Communication in the smart metering system __________________ 9
      2.1.3 The role of smart meters in the modern grid __________________ 12
   2.2 Potential applications of smart meters ................................................... 14
      2.2.1 Dynamic pricing ________________________________________ 14
      2.2.2 Data analytics __________________________________________ 15
      2.2.3 Power quality monitoring _________________________________ 18
      2.2.4 Load shedding __________________________________________ 18
      2.2.5 Alarm systems__________________________________________ 19
   2.3 Smart meters: The case of Sweden ........................................................ 20
      2.3.1 Power grid in Sweden ____________________________________ 20
      2.3.2 Smart meters rollout in Sweden ____________________________ 23

3. Field Research _____________________________________________ 27
   3.1 Results from the Interviews ................................................................... 28
      3.1.1 Participants in the study __________________________________ 28
      3.1.2 Smart meters provider ____________________________________ 29
      3.1.3 Functionalities __________________________________________ 29
      3.1.4 Plug-in modules ________________________________________ 35
   3.2 Summary and conclusions of the interviews ......................................... 36

4. Test and evaluation of the Alarm Functionality at Hemab ___________ 38
   4.1 Smart Metering System at Hemab ......................................................... 38
   4.2 VisionAir ............................................................................................... 40
   4.3 Communication infrastructure for the alarms ........................................ 43
   4.4 Voltage Quality Regulation in Sweden ................................................. 43
      4.4.1 Voltage sags ___________________________________________ 44

                                                       VI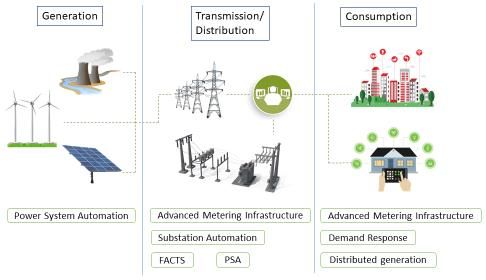
4.4.2 Voltage swells __________________________________________ 45
     4.4.3 Interruptions ___________________________________________ 46
  4.5 Evaluation .............................................................................................. 47
     4.5.1 Setting the alarms _______________________________________ 47
     4.5.2 Outcomes _____________________________________________ 50
     4.5.3 Potential applications and integration ________________________ 53
     4.5.4 Cost and benefits ________________________________________ 56

6. Conclusions _______________________________________________ 61

References __________________________________________________ 63

Appendices__________________________________________________ 68

                                                      VII
1
1. Introduction
1.1 Background
1.1.1 Smart Meters
    Traditionally, an electricity meter has only measured the energy consumed by
customers. With the arrival of new smart maters in the grid there are many
opportunities for the DSO to make their operations more reliable and efficient. A
smart meter is a device that can be used to measure electricity, water or even gas
consumption for different type of users. There are four main differences between
a smart meter and an ordinary one [1]. A smart meter provides:

   ▪   Two-way communication between the distributor and the customer
   ▪   Remote control
   ▪   Higher time resolution
   ▪   Data analytics

    Smart meters offer now a two-way communication, providing feedback to the
consumers and, at the same time, enable the system operators to control the power
load when the system is being overloaded. The energy readings can be taken
remotely, removing the need of personal from the utility company to go and read
the measures each month. Furthermore, there is a higher time resolution using
smart meters where utilities are now able to register energy consumption more
often than 1 hour and, in this way, improve the accuracy of their energy
measurements. Finally, smart meters come with analytics platforms designed to
facilitate the process of analyzing, understanding and interpreting data from the
grid, allowing the utility to spot trends and make accurate predictions (load
forecast) [2].

1.1.2 Smart Meters in Sweden
     Sweden is perhaps one of the leader countries when it comes to smart meters
implementation in the power grid. They began the roll-out of smart meters in 2003
when the Swedish government decided that all costumers should have monthly
billing [3], [4]. Before this time, almost all electricity meters in Sweden measured
on a yearly basis. The customers received their bills based on the previous year’s
consumption, and then received a reconciliation bill for the difference between the
previous year’s consumption and the actual consumption.

    The Swedish Parliament decided that by 2010 all electricity customers should
have monthly billing based on actual consumption instead of yearly. Thus, began
the first wave of roll-out of smart meters in Sweden. The main task at this stage
was to increase consumer awareness and reduce energy consumption, besides the
saving for not having to send someone to read over the electricity meters at every
location. The utilities started to do this remotely [1].

                                         2
In 2017, a new amendment was made to the legislation and the second wave
of smart meters began. The government dictated that smart meters should now
include new features such as a connection/disconnection switch with remote
control, a better time resolution for the energy readings, and a friendly interface
for customers to get access to their own data. The decision was made that all
customers should have these meters installed by 2025. This is called the second
wave of smart meters in Sweden and many utilities are currently in the process of
installing them in replaced of the first generation [1].
1.1.4 HEMAB
Härnösand Energi & Miljö AB (HEMAB) is owned by the municipality of
Härnösand in the north of Sweden. The activities within HEMAB include: district
heating, cleaning and recycling, water and sewage, electricity networks, wind
power, biogas production, vehicle gas station, broadband, charging infrastructure
and involvement in the local community. The operations must be run
commercially but not profit-maximizing, this means that low prices are prioritized
before revenues. The business is ruled by a set of articles and directives issued by
the Kommunfullmäktige (city council) and the Kommunstyrelsen (municipal
board), who may also make decisions in order to secure the profitability of the
company. HEMAB is 100% owned by the municipality and has around 140
employees nowadays [5].
The electricity grid in Sweden is made up of different operators. The main
grid, which is owned by the state-owned company Svenska Kraftnät, is the core of
the power grid where all power plants and consumers are connected. The regional
networks, which are owned by larger companies such as E.ON and Ellevio, which
distribute the power to specific regions and large cities in Sweden. And the local
electricity networks that deliver the electricity to households and companies.
Härnösand Elnät AB, which is completely owned by HEMAB, is the local
distribution company that supplies energy to the customers within the municipality
of Härnösand. They have around 13,700 customers connected to the electricity
network and transfers approximately 270 million kWh of electricity in the 155 km
long network [6].
Following the new amendment made by the Swedish Parliament, HEMAB is
gradually replacing the electricity meters of their customers with a new type of
smart meter. HEMAB is installing the OMNIPOWER 3-Phase smart meter
developed by the Danish company Kamstrup. The replacement is still taking place
and, to date, they have installed around 6,000 out of 20,000 meters in the low
voltage network.
1.2 Problem statement
In a report published by the Swedish Energy Markets Inspectorate (Ei) in 2015,
some functional requirements were specified regarding the second generation of
3smart meters in Sweden. The intend of this was to facilitate a transition towards
the smart grid and, at the same time, ensure equal opportunities within electricity
suppliers and network operators. However, some Swedish utilities like Hemab,
face a new challenge today, attempting to reveal which technical and financial
benefits the new smart meters will bring to their operations. Following this, the
first objective of this project is to study and evaluate new functionalities of the
second generation of smart meters at Hemab. In particular, try to answer the
following questions:
• What new functionalities can be implemented with the OMNIPOWER
3-phase smart meters chosen by HEMAB?
• How can the company take advantage of it?
• How can the customers take advantage of it?
• What are other network operators in Sweden doing and which
functionalities have the most potential in the region?
To help answer these questions, a series of interviews were carried out with
several DSOs in Sweden. The interview consisted of six questions divided into
two sections. The first section deals with general information about the company
and information about the smart meters they are using to replace the first
generation. The second section focused more on the functionalities they are
implementing (or plan to implement) with the new meters. The field research
includes answers from 14 network operators in Sweden as well as analysis,
interpretation and discussion of the results.
The second objective of the project is to evaluate one of these new
functionalities and provide valuable and practical feedback to Hemab’s staff. The
functionality evaluated is an alarm system to receive real-time notifications when
events such as power failures, overvoltage, undervoltage and missing phase occur
in the grid. The reason to test an alarm system was based on both, internal interest
from the metering department at Hemab, and the results from the field research
carried out in this thesis.
1.3 Limitations and Assumptions
Since the rollout of the second generation of smart meters in Sweden is still
taking place, most of the questions in the interviews focused on what plans utilities
have for the future, and those functionalities that are still being tested by the
operation departments nowadays. Furthermore, due to the different backgrounds,
roles and technical experience of the respondents, interpretation is considered to
be a key factor on the results from this research.
4Given that Kamstup is the only provider of the smart meters for HEMAB, the
new functionalities to evaluate will be centered on the OMNIPOWER 3-phase
model, which is the product chosen by HEMAB to replace the old meters. Features
and functions that cannot be implemented through OMNIPOWER 3-phase were
not taken into consideration in this study.
The evaluation and analysis of the alarm system will be particularly relevant
and appropriate to Hemab’s operations and the local electricity network in
Härnösand, which might differ in other regions and utilities in Sweden.
Due to the current situation with COVID-19, the visit to the central office in
Härnösand was canceled. Thus, all communication with the staff at Hemab during
the semester was done through online meetings or phone calls. For the same
reason, it was no possible to get access to operation programs such as Digpro,
which given the limited timespan of the project, limited the scope of the evaluation
of the alarm system functionality.
52. Literature Review
2.1 Smart Metering System
2.1.1 Smart Grid Overview
The term smart grid (SG) encompasses numberless aspects of the power grid
including both, electrical and communication technologies, making it difficult to
agree on a general definition. For Bush [2], the smart grid can be defined as an
electric power grid that uses intelligent devices in both, the supply and demand
side, to deliver electricity in an efficient, reliable, economical and sustainable way.
Fang et al. [7] describe the smart grid as the system that uses two-way
communication technologies and computational intelligence to build an automated
and distributed electricity network. According to Fang, constant attempts from the
governments and electric utilities to make the power grid more secure, resilient
and sustainable gave birth to the term SG in the energy field. Similarly, the IEEE
Smart Grid organization [8] defines the SG on their website as a combination of
several disciplines, including computational and communication control systems,
which will revolutionize the daily operations in the generation, transmission and
distribution parts of the grid.
The details of these definitions will vary from one region to another throughout
the world. The scope of the SG will depend on the infrastructure, the needs, and
even the regulatory framework of the electric system in the region [2]. However,
it is possible to recognize a series of applications and technologies that seem to be
predominant in most of the SG research publications nowadays:
▪ Advanced metering infrastructure (AMI)
▪ Demand respond (DR)
▪ Distribution automation (DA)
▪ Distributed generation (DG)
▪ Power system automation (PSA)
▪ Flexible alternating current transmission system (FACTS)
AMI refers to the whole infrastructure necessary to allow two-way
communication between consumers and suppliers. The main component of an
AMI is the Smart Meter (SM), which records the information of the grid on the
consumers side such as energy consumption, voltage levels, power factor, etc., and
sends it back to the supplier. The role of SM in the SG and some of the main
functionalities will be discussed more in detail in chapter 3.1.3. DR uses
automation controls installed at the customers’ facilities to alleviate the electricity
demand in the grid during peak hours. DA allows the utilities to have intelligent
control over the network, while DG is mainly linked to microgrids and the use of
renewable sources at a local level, bringing down the centralization of the power
6grid. PSA refers to any application that controls the electric system via
instrumentation and control devices, such as Supervisory Control and Data
Acquisition (SCADA). Substation automation (SA) is one of the most used
applications in this area. Finally, FACTS is a power electronics-based system
designed to improve the power transfer capability of the grid.
Figure 1 shows the infrastructure of a common SG and its applications. The
state-of-the-art technologies mentioned above are placed on each sector of the
electric system where they are implemented. The stakeholders include power
plants, transmission system operators (TSO), distribution system operators (DSO),
electricity providers and consumers. All of them play an important role in the
deployment of SG applications and, in some cases, two or more parties must
cooperate to make the application work. For example, the AMI is built in different
blocks that cover the transmission lines, the distribution network and all
consumers connected to the grid, allowing a two-way communication between
DSOs and consumers.
The focal device of an AMI is the SM. A developed AMI would allow more
functionalities from the SM, therefore, more technical and financial benefits for
the grid operators. The AMI encompasses all metering operations, from data
acquisition to information delivery to the end-users (e.g., energy consumption and
load profiles). Through the AMI is also possible to introduce IT applications such
as DR, outage management system (OMS) and dynamic pricing strategies [9].
The electric power grid has evolved considerably since the introduction of
AMI. New communication technologies gave birth to what is, perhaps, one of the
greatest benefits for grid operators up to now, remote readings and remote-control
functions. AMI provides several functionalities that previously had to be
performed manually, such as the ability to measure the electricity consumption of
each customer remotely, connect and disconnect the service from the control
room, detect tampering and monitor electrical parameters without the need of a
power quality analyzer [10].
As seen in Figure 1, customer’s participation will play a bigger role in the new
SG. Smart home applications are becoming more and more popular nowadays, and
the combination with SM offers a variety of applications that are valuable for the
customers and the DSOs.
Within a smart home, the SM is connected to smart appliances, alarm systems,
thermostats, and other devices via home area network (HAN). This
communication between different devices allows a scenario where the customers
can have better control over their energy demand and make smarter decisions
during the day. For example, the HAN could use an algorithm to balance the
electricity consumption within the household and prioritize which devices to run
at a certain time of the day in order to flat the demand curve and reduce cost. These
applications must run together with DR programs or a time-of-use (TOU) pricing
system from the local DSO [11].
7Figure 1. Applications in the Smart Grid
From the early years of the power grid, a great deal of effort has been made
trying to predict potential problems within a substation and collect more
information about the health of the system. SA and any other innovation in this
field will play a key role in the deployment of the SG all over the grid [11]. With
the introduction of automation technologies, control devices at the substation level
became more intelligent and easier to operate. New intelligent, electronic devices
(IEDs) are opening the door for the substations to operate without the need for
constant human intervention or supervision, which considerably reduces the cost
for grid operators. Moreover, the more intelligent the network becomes, the more
responsibilities are transferred from the personal to the devices in the system. This
allows the operators to focus more on high-level aspects of the program
architecture and make the daily operations more efficient [12].
New standards and protocols for the substation’s operation have been
developed in the last years. These standards make sure that devices from different
companies will function following certain requirements and operate in a
predefined way. Consequently, the operators have more flexibility to choose the
technologies that suit them best without having to worry too much about the brand
or the manufacturer [12].
Finally, the pre-smart-grid power generation is clearly dominated by
centralized, large power plants. The reason for this was to gain an economy of
scale in the energy sector. However, the SG will open the doors to a more
distributed generation system, where more renewable sources, such as solar
photovoltaic and wind power, will be the predominant fuel of the power grid. DG,
microgrids (operating in synchrony with the traditional macrogrid), and even
wireless transmission of electricity are some of the topics that, today, generate
massive attention between network operators.
82.1.2 Communication in the smart metering system
The introduction of communication technologies into the power grid is
considered the cornerstone of the transition towards more sustainable electrical
systems. Communication has existed in the power grid since its inception and,
within this field, should not be seen as an end itself, but as a technology supporting
the traditional electrical infrastructure [2]. Essentially, communication enables
remote control and warning systems that can be extremely supportive for grid
operators. However, networking and communication are broad concepts that
cannot be thoroughly covered in a single chapter. Instead, this chapter focuses on
the communication technologies used for SM applications and the pros and cons
of each of them.
The smart meter infrastructure (SMI) comprises electronic devices (including
smart home appliances), a communication network and a meter data management
system (MDMS) [13]. Many of the functionalities that DSOs and electricity
providers can implement with smart meters depend largely on the quality of the
communication network and their ability to integrate data collection systems to
the standard operation of the grid.
Technologies used
Primarily, the communication technologies in a SMI can be categorized
according to the transmission medium applied, wired and wireless systems.
Wired technologies are governed by power line communication (PLC), which
utilizes the existing AC power lines to send and receive information in form of
bits and operating at different frequencies than the 50/60 hertz (AC frequency in
the power grid). Implementing this type of communication is wholly
straightforward and, despite some disadvantages regarding the noise interference
caused by electrical loads, the technology is one of the most used among the SMI.
However, many electricity networks nowadays combine a PLC system with radio
frequency mesh technology, which will be explored later in this chapter [14].
Digital subscriber lines (DSL) are becoming more popular in the SG field. A
DSL uses traditional telephone lines to transmit high-bandwidth data. This
technology provides dedicated, point-to-point network access, which is beneficial
for the utilities. Nonetheless, similar to other communication technologies, the
distance between the utility and the consumer can be a problem. The longer the
distance, the lower the transmission performance [14] [15]. Finally, fiber optic
communication is also being considered as a potential technology for SMI
communication in the near future. There are projects in the United States and
Europe that are building fiber optic cables for SM communication, but the high
cost is one of the reasons this technology is still not competing against PLC or
DSL [16].
On the other side, wireless technologies in SMI started to evolve as
complementing technologies for wired communication systems. Wireless
technologies are the core function of automatic meter reading (AMR), which is
9the SM functionality that most utilities have implemented nowadays. Two
technologies that are leading the incorporation of wireless communication in the
power grid: radio frequency mesh (RFM) and cellular connectivity [14].
A RFM network builds communication links between neighboring devices to
transmit data. This technology is especially suitable for use in SMI due to its ability
to form micro-networks and overcome mutable propagation conditions [17]. In a
RFM, the SMs use each other to re-route the data automatically in case of the radio
signal being affected by environmental conditions. The data is sent by local
metering devices (also called slaves) to a concentrator (also called master) which
collects and stores the information before sending it forward to the head-end
system in the network (the utility). This technology is mostly used in urban areas
where SMs are close enough to each other to create a micro-network [18].
Cellular connectivity is becoming essential in the deployment of SM due to all
those benefits they can add to the communication infrastructure. Cellular
technologies are being used all over the world for many different applications,
including sensors, trackers, environmental monitoring, commercial devices, smart
appliances and meters [14] [19]. In the SMI, cellular connectivity is commonly
used to communicate the master concentrator to the head-end system via cellular
2G/3G/4G. The technology used will depend mainly on the existing infrastructure
owned by the mobile operators, but also on performance requirements and the
coverage desired. Costs to implement cellular communication for SMI are
relatively low since utilities can use mobile companies’ existing, and reliable,
networks in the region. Moreover, the wide coverage offered by this technology is
also considered a significant benefit for DSOs [20].
The increased demand for Internet of Things (IoT) in our daily life will push
forward more and more progresses in cellular connectivity. The 5G technology
and its greater bandwidth capability are set to play a huge role in the future SG. In
Sweden, Telia mobile company partnered with Ericsson to start offering SM
vendors a 5G connectivity in Sweden’s utility infrastructure that would enable
better communication technologies for smart metering [21]. SG adoption of
cellular connectivity is progressing quickly and it is expected to take the entire
communication network, forming a point-to-point solution, where all SMs are in
direct connection with the head-end system via cellular networks [22].
Architecture of the SMI
Figure 2 shows the general architecture for SMI communication. The SMI can
be divided into three communication networks; home area networks (HAN),
neighborhood area networks (NAN) and wide area networks (WAN); that added
together enable two-way communication between utilities and end-users [13].
HAN is deployed at the consumer facilities and it comprises several devices,
namely, smart appliances, smart plugs, electric vehicles, in-home display and
smart meters. HAN provides the opportunity to monitor and control energy usage,
which is the foundation of demand management or DR programs for grid
10Figure 2. Smart metering architecture.
operators [23]. HAN involves a variety of technologies and standards such as
WLAN, G.hn, IEEE 1901, HomePlug and Prime PLC [13].
NAN transfers information from the HAN to the WAN and vice versa. The
main component in this network is the concentrator unit, which collects the data
from the smart meters and sends it to the head-end system [24]. The concentrator
unit has the capability of store data for short periods of time, this enables the utility
to control when exactly they want to receive the data sets from the customers.
Moreover, if a transmission error occurs, the data can be stored in a database, data
protection unit (DCU), until the communication is reestablished [13]. Information
can also be transmitted from the grid operators to the end-users using the same
principle. NAN is typically seen as the control unit that utilities use to handle all
the data in the network.
WAN is the collection of NANs and all devices that communicate with one
another in the power grid. The concentrator units in the NAN communicate with
the head end system through this network, but also power substations,
transformers and power generation stations. WAN is basically the network of
networks and supports the two-way communication between DA and power
quality management [13] [25]. Just as in NAN, WAN can be built using wired
technologies such as PLC and fiber optics or using wireless technologies, where
cellular communication (LTE) is becoming the most popular among DSOs, WI-
MAX and WLAN are also a typical option in this category. WI-MAX is defined
in IEEE 802.16 and operates the internet protocol mandatory for smart metering
applications.
Finally, the MDMS works as the brain of the SMI. It is the host system of the
network and it receives stores and analyzes the data collected by the concentrator
units. MDMS is used by different departments within the utility organization. The
administrative department utilizes the energy consumption data measured by each
SM for billing purposes. The operations department might use the MDMS to
remotely connect/disconnect meters, for power quality verifications and even
demand control through DR programs. Additionally, the metering department
could use the imported data for analyzing consumer behavior and demand
forecasting.
11It is important to notice that the architecture shown in Figure 2 represents a
common SMI, but variations in the infrastructure may occur in different grids. In
Europe, wireless M-bus technology is sometimes implemented to recollect data
from the SM using a drive-by mobile meter [26]. Personnel from the company
drive around the metering points while the mobile meter collects and stores the
data, making the process faster, reliable and more efficient. This technology is
particularly useful in the middle of expanding projects, where the SMI is built, or
renovated, in different phases. The DSOs can then collect meter’s data through a
drive-by M-bus until the project is completed and the solution can be developed
to a fully automated communication network [27].
Point-to-point solutions using cellular connectivity are also expected to grow
in the near future, and in the United States and Europe there are already pilot
projects working with this technology [7] [18] [28]. Building a direct connection
between metering devices and the head-end system seems to make communication
more reliable and reduces the problems of interference in the transmission process.
This solution will be highly dependent on the development of the 5G network in
the coming years.
2.1.3 The role of smart meters in the modern grid
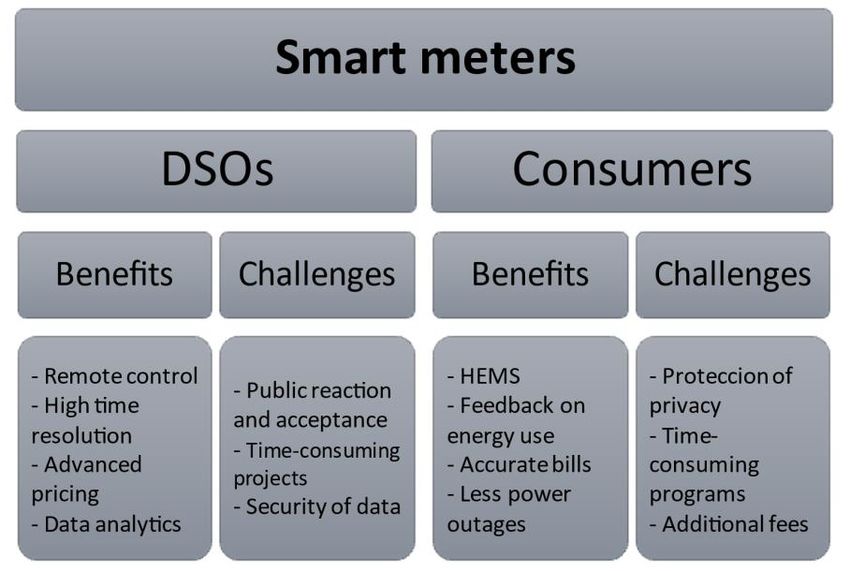
SMs offer a range of possibilities for both, the DSOs and the consumers, to
make smarter decisions concerning energy management. For DSO’s, the two-
communication system, remote control operations, higher time resolution in
measuring and data analytics are the most significant gains. While consumers
benefit from real-time and complete information about their energy consumption
and additional functions that they can add to smart home applications.
Figure 3. Benefits and barriers of SM implementation.
12According to [28], smart meter operations will become the most important
function for electric utilities, and the data collected from these devices will be their
most valuable asset. Fast-pace innovations in the SMI and communications
networks are drawing a clear picture of the countless benefits that distribution
control rooms can obtain with SM applications.
The opportunities come mainly from the integration of SM with the
distribution management system (DMS). However, this could be either, an enabler
or a barrier, for utilities to start implementing SM functionalities. The coordination
between different departments and computer systems is a unique challenge that
most utilities face in the first stages of the project and must be tackled with a good
project management program.
Moreover, the process of executing SM functionalities differs from most utility
projects. The operation of SM technologies does not start at the end of the project
but upon the installation of the first SM in the network [28]. This allows the
metering department to set the internal procedures, roles and software
requirements to implement the new functionalities while the installation of the
SMs is completed in the field (normally within a couple of years). As stated before,
communication and coordination between stakeholders is the key component for
the rollout of SMs to be successful and seize all those benefits that the new
technology brings into the organization.
The possibility to improve network analysis and forecasting methods using
SM data has been considered by several DSOs over the last years. For example,
[29] described the three main SM projects that Vattenfall Eldistribution AB-
Sweden presented in the 22nd International Conference on Electricity Distribution
(2013). Improvement of load profiles, by using hourly metering values instead of
monthly values to enhance the network planning calculations; use the power
quality events collected by the SMs as an indication of close-to-failure conditions
in the low voltage (LV) grid; and, use meter values from the customer size and
secondary substations to calculate (or verify) network losses in the grid. All these
pilot projects proved to be successful in giving the utility a better understanding
of the local grid behavior and customer load pattern.
Similarly, [30] presents the benefits that utilities can obtain by making use of
high-time resolution meter data in regard to monthly report generation. The
authors show that a higher resolution in the SMs can improve the accuracy of
consumption models by 5.5% in a network of around 1,000 customers. Other
functionalities will be discussed more in detail in the next chapter (Potential
applications of SMs).
Getting real-time information and remote control over a load of each customer
provides clear advantages for the DSOs. However, the implementation of these
functionalities usually encounters barriers such as public acceptance towards the
use of consumer data, privacy issues and the significant effort (and time) spend to
initiate these programs, which prevent the rapid growth of SM functionalities in
the power grid.
13As the debate over the pros and cons of SMs implementation in the power grid
keeps growing over the years, many utilities are trying to exhibit the technical and
financial benefits of this technology. Interestingly, most of the challenges seem to
be related to customers’ acceptance towards the use of personal data and the need
for behavioral changes, which is something that utilities can barely control or
influence. The implementation of programs such as DR and real-time pricing in
the coming years will rely on better ways to gain customers’ trust and motivate
them to get more involved in energy efficiency programs.
Despite the general barriers mentioned above, the SM rollout seems to be the
first step taken by electric utilities to build the new SG. SMI is emerging in several
parts of the world and in regions like Europe, the adoption of new smart metering
technologies is accelerating over the years.
According to [31] [32], 80 million SMs had been installed in the EU countries
by the end of 2017. Compared to 70 million in the United States over the same
time frame. Moreover, according to [33], around 35 million units are expected to
be installed in the EU this year (2021). While the rollout of SMs in the EU keeps
increasing, the outlook looks different from one country to another. For example,
Italy and Sweden completed the roll-out of the first generation of SMs around ten
years ago, whereas other countries like Spain are still in the process of replacement
of ordinary meters [31], in countries like Sweden, Finland and Italy, the first
generation of SMs is already being replaced by a second generation with more
functionalities and, especially, a higher time-resolution capacity, which promises
to make daily operations more efficient for the electric utilities.
2.2 Potential applications of smart meters
It is commonly agreed among energy experts that smart meters (SMs) are the
key element and the great facilitator for new functionalities in the power grid. This
became clear during the International Conference on Electricity Distribution held
in Stockholm in 2013, where many distribution system operators (DSOs) from all
over the world discussed the future of the electrical grid and presented pilot
projects implementing SM functionalities [29] [30] [34]. In this chapter, the focus
is on which functionalities have the potential to succeed in the near future.
Additionally, those functionalities that are already implemented by DSO’s in
Sweden are prioritized. These functionalities were decided after a series of
interviews with several DSO’s in Sweden, discussed more in detail in chapter 4.
2.2.1 Dynamic pricing
Dynamic pricing is a method of demand response (DR) applied by electric
utilities to reduce electricity consumption during peak hours and maintain stability
in the grid. These programs are usually voluntary and are based on the customer's
motivation to consume less energy if electricity prices are low. There are two types
for pricing customers in this program: time-of-use pricing (TOU) and real-time
pricing (RTP). In TOU, customers are charged by the utility depending on the time
of the day (day, night and peak hours), being the peak hours the most expensive
14for them. In RTP, customers are charged on an hourly basis using real-time data
of energy prices in the market [35].
One of the main challenges for this type of program resides in information
[35]. Few people know how the electricity market operates, what a kWh is or how
exactly they are being charged for the energy they consume. This gap of
knowledge creates a scenario where customers have no interest in changing the
way things work now, because they have been working well for several years and,
to some extent, there could be a blind trust in the system. Furthermore, for those
customers who actually engage themselves in a price-based program, confusion
about the price system and which actions should be taken arise, making the system
complicated to understand.
Another barrier to the rollout of DR pricing programs is called response fatigue
[36]. Giving the dynamic functionality of a price-based system, customers must
actively respond to changes in the market, therefore, creating a sort of fatigue or
tiredness for having to dedicate time to these tasks on a daily basis.
A pilot project took place in Washington, USA in 2016 [35]; where customers of
an electricity network were given the chance to change to a price-based program
offered by the utility. The results showed a considerable reduction in the electric
bill of these customers. However, and unexpectedly, after three months of test,
more than 90% of customers decided to return to a fixed-price billing system, even
when they knew it was more expensive than the pricing-program rate. They
concluded that the main reason is due to customer’s tiredness and the high time
invested on tasks related to the program.
2.2.2 Data analytics
Electric utilities are not immune to the concept behind Clive Humby’s famous
phrase “data is the new oil”. With the fast development of communication
technologies, IoT and cloud computing over the last years, more and more
businesses are getting on board the data science trend. Data analytics offers
abundant opportunities for DSOs to make their operations more reliable and
efficient without the need to deal with high investment costs or complicated
renovation projects. DSOs can implement data analytic techniques in the
following areas:
▪ Load forecasting
▪ Customer segmentation
▪ Non-technical losses
▪ Predictive maintenance
15Load forecasting
Accurate electricity demand prediction is difficult to achieve. Recent concerns
on how to increase the reliability of the power grid are leading the DSO’s to invest
more in load forecasting and fault prediction scenarios. Forecast of electricity
demand helps the operation room to anticipate voltage and frequency variations
and avoid close-to-failure situations in the grid. Network losses and load capacity
constraints can also be obtained through load forecasting methods [37].
Machine learning techniques are becoming more popular for load forecasting
in recent years. Applying seasonal autoregressive integrated moving average
(SARIMA) models to time series data proved to be effective and delivers high
accuracy [38]. Since electricity demand is greatly affected by weather conditions,
it is necessary to gather weather information to build up a good model together
with other parameters such as time of the year, type of customer, location, etc.
A case study of an electric utility in the UK is a good example of implementing
load forecasting to network operations. The authors in [39] present a method that
uses aggregated load forecast models at the low-voltage substation level. The
utility is using smart meters to estimate low-voltage losses. The model makes use
of 1 and 10-minute readings instead of hourly readings, to increase the time
resolution of the energy measures and, consequently, improve the accuracy of the
results. It was found that 60-minute resolution data underestimated the losses by
between 9% and 24% compared to 10-minute readings.
Customer segmentation
The DR and dynamic pricing programs discussed earlier cannot be
implemented without the customer’s consent. This creates a barrier for all DSOs
trying to execute these functionalities. Using clustering techniques, utilities can
get a clearer picture of consumption processes behind the SM, i.e., which
appliances and electrical equipment are installed inside each home. This tells the
utility which customers would produce a greater outcome if energy efficiency
programs are introduced. Moreover, given that DR acceptance depends, to a large
extent, on how flexible the customer can be towards consumption changes,
obtaining this information is essential and of great gain for the DSO.
A research that involved hourly smart meter data from a local grid in
Sweden and data clustering methods is presented in [40]. They clustered 5,000
Swedish residential customers based on load characteristics such as average daily
load profiles using just the data provided by the SMs. The cluster results were
validated with a survey carried out to 95 of the customers and showed that the
model was able to successfully distinguish between houses with electric and non-
electric heating systems (which contributes to most of their load curve). This
16information can then be used to design different tariffs for customers or create
categorical energy-saving campaigns.
Another research [41], uses voltage correlation analysis to group together
customers that show similar voltage levels and be able to validate the network
topology used at the operation unit. Results from this functionality can also be
applied to improve the accuracy of the geographic information system (GIS).
Non-technical losses
Electric utilities have to deal with losses in the power grid on a daily basis.
Some of them are due to physical phenomena such as dissipated energy (in form
of heat) in the conductors, magnetic losses in the transformers and inefficiencies
of the electrical equipment used in substations and distribution lines. These are
called technical losses, and most DSOs use straightforward methods to calculate
them. There is, however, another type of losses commonly known as non-technical
losses (NTL), which have been a major concern for electric utilities and methods
to calculate them are still not completely accurate. NTL are mainly caused by
electrical theft, errors in unmetered supplies, or accounting mistakes. According
to [42], 96 billion dollars are lost every year due to NTL worldwide.
A research carried out by IEEE members presented a decision tree and
supported vector machine model to detect electricity theft in a local grid [43]. The
proposed model is capable of precisely detecting and locating anomalies
happening anywhere in the electricity network and do it in real-time. Results of
this research proved that it is possible to identify fraudulent consumers in the grid
with an accuracy of 92.5%, and a false positive rate as low as 5.12%.
A different NTL technique is applied in [44], where they proposed a new
methodology to calculate technical losses, leading to a more accurate estimation
of the NTL. The method analyzes voltage drop differences sent by SMs and
compares them with voltage drop calculations due to technical losses after the
transformer to locate possible theft in the network.
Predictive maintenance
Reliability of the distribution network is a priority in the power grid.
Interruptions in power supply can cost the utilities a great amount of money and,
in the worst-case scenario, can lead to catastrophic incidents damaging electric
equipment or personnel. Power system operators can now use traditional statistical
models that input weather information, GIS data and even log data of relay
protection devices for state monitoring of the network and be able to predict fault
scenarios along the lines [38].
A good example of this technique is a company in the United States that is
helping utilities using predictive data science to improve their vegetation
management operations in order to avoid faults caused by trees or flora close to
17the power lines [45]. Utilities then use a risk score to identify areas to focus on
and improve maintenance approaches.
2.2.3 Power quality monitoring
The term power quality is used to describe the health of a specific electric
installation, i.e., how close are electrical parameters (such as voltage, frequency
and harmonics) operating from established norms and specifications. Power
quality is one of the crucial issues for DSOs and implementing analysis methods
can significantly reduce losses in the grid. Inadequate wiring, improper grounding,
unbalanced loads, or equipment without proper protection can compromise the
power quality of the system. A common power quality study comprises a deep
analysis of the following parameters:
▪ Harmonics
▪ Analysis of overvoltage and transients
▪ Sags and swells
▪ Power factor and reactive energy analysis
▪ Power flow
The new generation of SMs are designed to support extended analysis of the
main grid, allowing utilities to perform power quality analysis remotely (normally
done physically with measurement equipment).
Several plug-in applications for SMs have been developed to help DSOs keep
track of electrical distortions, which can notify the power operators about bad
quality in the grid. In [46], a metering application based on advanced RISC
machines is designed in order to monitor total harmonic distortion current (THDI)
in the network. The application is able to detect consumers that generate
harmonics beyond permissible limits and send a real-time warning to the control
room. The DSOs can then apply a new tariff system that penalizes customers that
surpass harmonic limits. According to the authors of this research, this action will
inspire consumers to purchase more energy-efficient appliances which in turn will
motivate the manufacturers to come with improved designs that minimize
harmonic generation.
2.2.4 Load shedding
Load shedding is used to relieve stress on the power grid when electricity
demand is greater than the energy supply. This is done by disconnecting some
substations for a short period of time until the balance in the grid is reached again.
Critical power shortage could require today compulsory load shedding as a last
resort if the power reserve becomes insufficient. The compulsory load shedding in
Sweden is typically done from medium voltage substation level, and in that case,
all customers including emergency service providers located under the affected
substation would lose power. By using a remote on/off switch in smart meters and
better load forecasting, it is possible to exclude the vulnerable groups of customers
18such as elderly homes and also socially critical customers such as clinics,
pharmacies, and fire stations.
The results from a simulation carried out by researchers at Chalmers
University in Sweden, show that compared to load estimation from average load
values, aggregated load forecasting models could help to save around 25% of
customers from unnecessary load shedding [31]. Another more complex (but
efficient) technique related to load-shedding is called dynamic demand. The idea
is to implement a remote system on the demand-side that would be able to monitor
the frequency of the power grid and turn off equipment or appliances at optimal
moments, until the balance of the grid is reached again. The switching on and off
would delay the working cycle of appliances by a small amount of time (normally
just a few seconds), therefore, it would be imperceptible for the customer and the
grid would benefit from it [47].
2.2.5 Alarm systems
Alarm applications can be implemented in combination with all functionalities
mentioned above. SMs can send real-time notifications to the control room when
power outages occur and before customers call to inform about the event. Missing
phase, loss of neutral line, sags and swells are some examples of other alarm
functionalities that can be implemented through SMs. DSOs obtain the most from
these alarm applications when they are paired with automatic controls in the
operation room, this way the utility is able to disconnect the power to minimize
damages and protect customer’s appliances. New applications are also being
developed in the field, that will enable customers to receive alarms about fault
events and estimated repair duration directly to their phones or other devices.
192.3 Smart meters: The case of Sweden
2.3.1 Power grid in Sweden
As it is the case in many other countries, the electrical grid in Sweden is
governed by four different operators that work in cooperation to make sure
electricity is delivered in a safe, efficient and reliable manner:
▪ Producers
▪ Transmission system operators (TSOs)
▪ Distribution system operators (DSOs)
▪ Electricity suppliers
In Sweden, electricity generation and trade is deregulated. This means, any
private entity is allowed to produce energy and sell it to electricity suppliers (or
directly to large consumers), usually done through long and short-term energy
contracts. Similarly, any customer in Sweden can decide from which electricity
supplier they want to buy the electricity. This creates a competitive market
between suppliers and it is intended to bring prices down for the consumers. The
electricity market in Sweden has been deregulated since 1996, and there are now
around 120 electricity suppliers which include Vattenfall, Fortum and E.ON [48]
[49].
On the other hand, the transmission and distribution of electricity is regulated
by the Swedish Energy Markets Inspectorate (Ei) and it is conducted in a
monopoly. The government agency Svenska Kraftnät is the TSO of electricity in
Sweden, they monitor and control the power grid continuously and make sure that
there is always a balance between consumption and production of electricity [50].
Whereas for the distribution sector, different companies (usually owned by the
municipalities) are in charge of the network operation of their region. There are
170 DSOs in Sweden and 129 of them are municipal owned [49]. Ei is the
government entity in charge of overseeing and make sure that DSOs do not
overcharge customers. The amount of revenue allowed for DSOs is determined by
the cost of operating, maintaining and developing the grid in each area.
In Sweden, customers are not allowed to choose their network operator, or
DSO, and they receive one bill from the electricity supplier selected (for the
electricity they consume) and one from the DSO of the region where they live (for
control and maintenance of the grid). Network operators Vattenfall Eldistribution,
Ellevio and E.ON Elnät cover more than half of electricity users in Sweden.
Sweden’s electricity network is divided into three electrical grids: the national
grid, region grids and local grids. The national grid is where the transmission of
electricity occurs and, as mentioned before, it is managed by Svenska Kraftnät,
the only TSO in Sweden. The national grid consists of 15,000 kilometers of power
lines operating at 220/400 kV, 160 power substations and 5 international
20You can also read