Exhibit_(EIOP-3) T&D Grid Innovation - Exhibit_(EIOP-3) Page 1 of 71 - Search / Commission ...
←
→
Page content transcription
If your browser does not render page correctly, please read the page content below
Exhibit__(EIOP-3)
                           Page 1 of 71

 Exhibit__(EIOP-3)
T&D Grid Innovation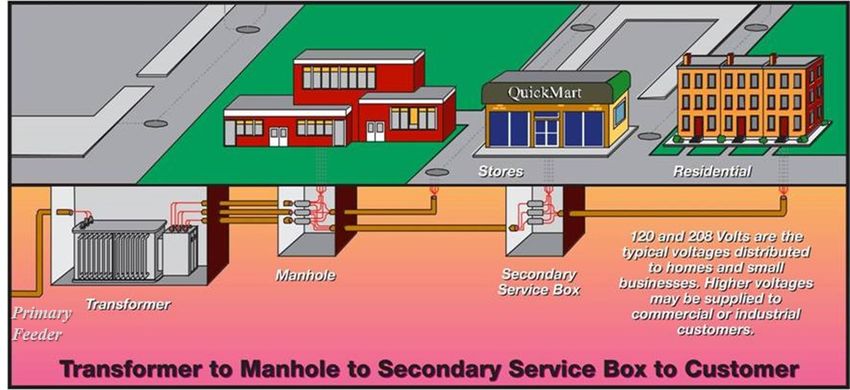
Exhibit__(EIOP-3)
                                                                                                                            Schedule 1
                                                                                                                          Page 2 of 71

                   Schedule 1: T&D Grid Innovation Capital Program and Project Summary

Electric T&D                                                                                                  Year Total
Grid Innovation                                                                                          Current Budget
                                                                                                        Total Dollars ($000)
                                                                                               RY1      RY2            RY3         3 Yr. Total
SYSTEM EXPANSION
Organization                       White Paper
Distribution                       Advanced Employee Safety Tools                               1,000    1,000             1,000         3,000
Distribution                       Communications Infrastructure*                              15,000   15,000         20,000           50,000
Distribution                       Cybersecurity Test Environment                               2,000    2,000             2,000         6,000
Distribution                       Data Analytics Use Cases                                     2,000    2,000             2,000         6,000
Distribution                       GIS                                                         30,000   30,000         30,000           90,000
Distribution                       Non-Network Resiliency with FLISR                            2,100    2,100             2,100         6,300
Distribution                       Smart Sensors                                                6,300    6,300             6,300        18,900
Distribution                       Underground Network Resiliency                               4,000    4,000             4,000        12,000
                  TOTAL ELECTRIC
                                                                       Total Grid Innovation   62,400   62,400         67,400         192,200
*Communications Infrastructure O&M expense is covered under Risk Reduction O&M in Engineering and Other Services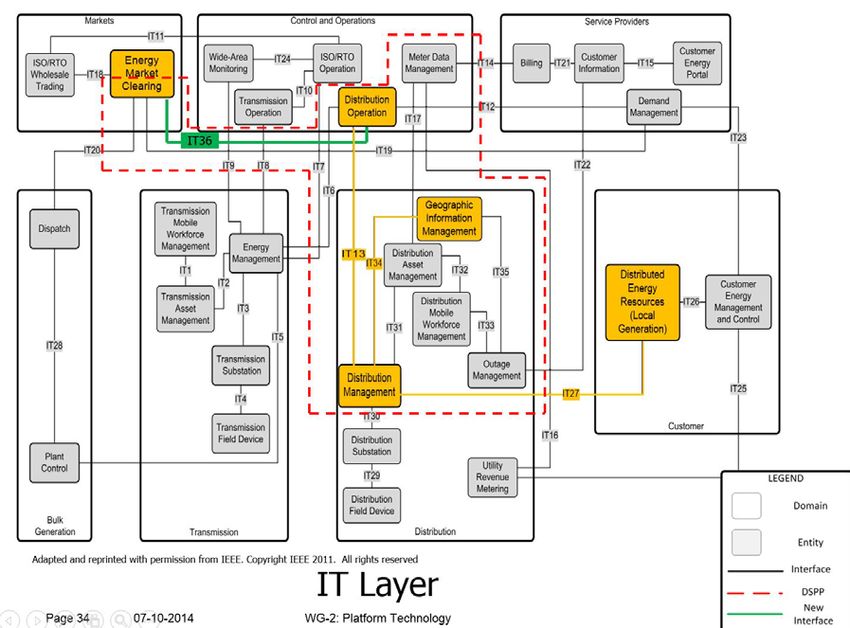
Exhibit__(EIOP-3)
                                                    Schedule 2
                                                  Page 3 of 71

               Schedule 2:
T&D Capital White Papers and Business Plan
             Grid Innovation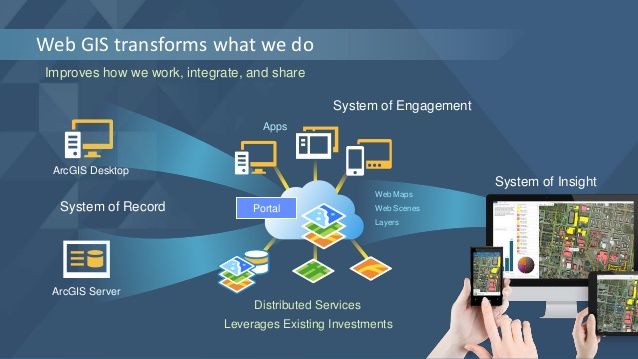
Exhibit__(EIOP-3)
Schedule 2
Page 4 of 71
Capital
X O&M
2020 – Distribution Engineering/Engineering and Planning
Project/Program Title Advanced Employee Safety Tools
Project Manager Joe Lenge, Stan Lewis
Hyperion Project Number PR.23317512
Status of Project Initiation
Estimated Start Date January 1, 2020
Estimated End Date December 31, 2023
Work Plan Category Strategic
Work Description:
The same technology advances that are driving the proliferation of sensing and robotics technologies
are also enabling the development tools to reduce the risk of the dangerous work Con Edison performs
daily. The objective of this project is to deploy advanced employee safety tools to reduce safety
incidence rates with a deliberate focus on reducing high-hazard injuries. Between 2020-2022, Con
Edison will explore technology, such as primary voltage testing equipment with logging functionality
and wireless connectivity, advanced splicing machine tools and other smart tools designed to reduce
risks associated with high risk activities. These tools will be deployed on an annual basis, at an initial
cost of $1 million per year, potentially increasing as field results are proven effective through field
trials.
Primary voltage testing equipment with logging will be explored for use on equipment involved in the
testing of electrical conductors or devices to confirm they are not energized. Real time status of
equipment use will be available across the network to evaluate the progress of work... This device will
generate a timestamp to compare against the testing logs to confirm testing is taking place during the
appropriate steps in the process. This data will be subject to random checks and on demand by crew
supervisors. Test dead logging devices cost approximately $2,000, and this program will deploy
approximately 500 devices.
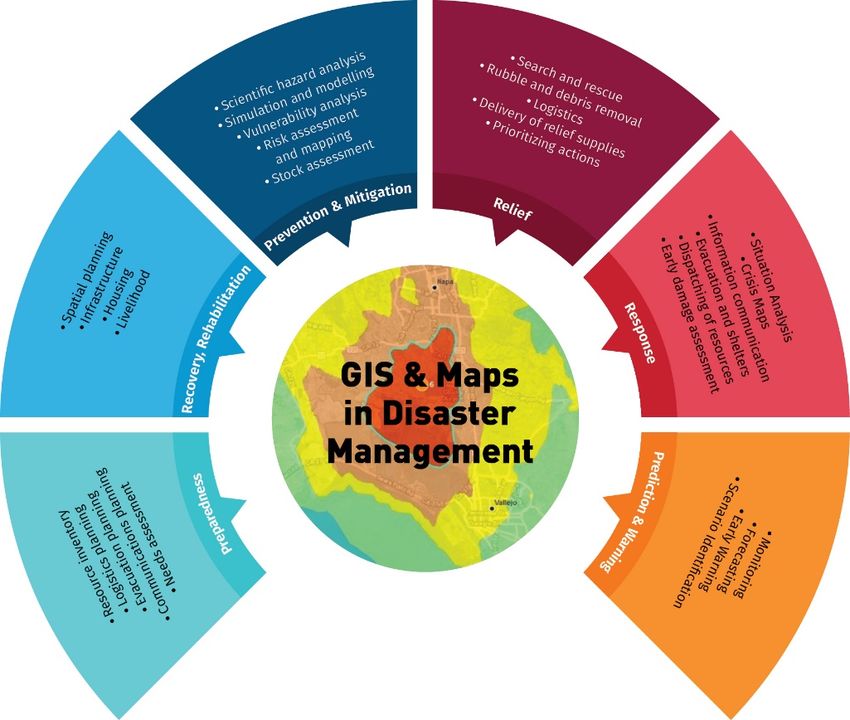
One underground splicing machine per year, at an approximate cost of $400,000, will be deployed and
used to make 13 and 27 kV live-end caps (“LEC”) on primary feeders. These feeders are installed in
conduits to transport electricity from the supply substation to several network distribution
transformers. Unlike overhead open-wire feeders, where larger clearances are available to allow safe
live-line work, all underground cable feeders must be de-energized in order to perform work.
Currently, processing and restoring feeders that open automatically consists of many steps, including
positive identification, and placement and removal of additional protective grounds around the
worksite required for workers. A LEC splice is a common splice that makes the immediate work area
safe for work, while allowing as much of the feeder as possible to remain energized. A LEC is
commonly used during adverse system conditions to expedite feeder restoration because it is quicker
than a complete repair, thus resulting in an expedited means of electrical reinstatement. This project
has been piloted through R&D and will be used more widely in the field on a borough-by-borough
basis. The successful employment of the tools described in this whitepaper on a phased basis should
inform an even wider employment beyond the rate case period in order to equip all operations and
construction crews.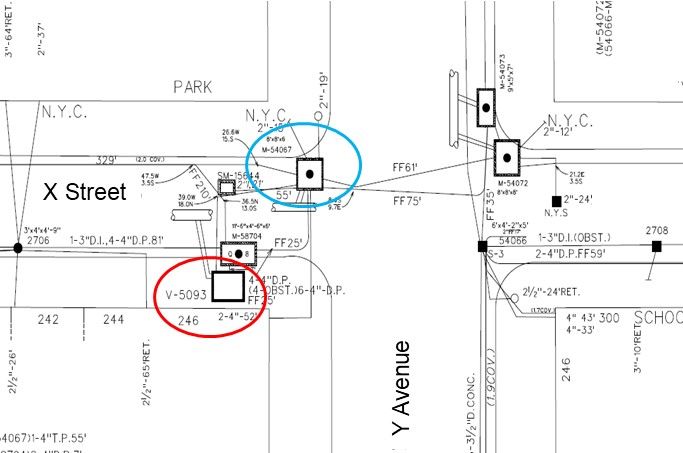
Exhibit__(EIOP-3)
                                                                                               Schedule 2
                                                                                             Page 5 of 71

Other smart tools will be explored for use with employees performing critical work. These smart tools
would be used by employees performing the tasks that have historically resulted in the greatest
incidence rate of high-hazard injuries (e.g., lead mechanics). Data collected during the execution of
this work will be subject to random checks and used to proactively correct any deviations from
procedures. This will allow corrective actions preventing future hazards and will provide useful
insights for developing enhanced training. Other smart tools are estimated to cost approximately
$1,000 per unit and will be targeted for specific job functions at greatest risk for a high-hazard injury.

Justification Summary:
This program is being implemented as part of Con Edison’s Grid Innovation plan. Through the Grid
Innovation program, Con Edison will leverage new technologies to improve employee high-hazard
safety, which is a strategic corporate priority for the Company. The Company’s Grid Innovation goals
include a focus on improving safety, both for the public and for employees. To do so, the Company
will leverage technology for tools and analytics to improve its operations. For employee safety, the
Company has made strong progress in recent years in reducing both the overall OSHA incidence rate
and the high-hazard injuries; however, the incidence rate is not a direct indicator of severe injury
potential and avoidable high-hazard injuries persist (see figure below).

Given the nature of delivering high energy, the risk for high-hazard injuries is not completely
avoidable; however, the Company believes it can be lowered further through technology and safety
tools that address precursors to high-hazard workplace injuries, increase awareness during high-hazard
tasks, or use robotics for dangerous tasks.
Primary Voltage Testing Equipment
there are many precursors to workplace injury and fatality, including productivity safety stressors,
vulnerability to high energy, and outside safety influences. Advanced safety tools, such as test dead
logging devices, allow severe injury and fatality precursors to be identified and eliminated. Device
data can be used to take corrective action and improve safety training procedures.
A common precursor is an inability to recognize high energy. Crews working in environments where
there is possible exposure should perform dead testing. Timestamping test dead equipment use
increases the likelihood high energy is identified. Other smart tools will also ensure workers
performing tasks involving high energy are following procedures. Single individuals have fewer
human performance tools available; multiple employees should be involved to prevent errors. Other
smart tools would ensure employees are engaged while performing work tasks and there are no visible
distraction sources.
Underground Splicing Machines
the splicing machines deployed through this program will reduce the risk to Company employees
during the high-hazard task of making primary cable safe for splicing. Furthermore, the splicing
Exhibit__(EIOP-3)
                                                                                             Schedule 2
                                                                                           Page 6 of 71

machine could potentially streamline feeder processing during outages by enabling field crews to
quickly and safely restore service through live end capping. The successful pilot of both this machine
and a new cold shrink pre-mold LEC has been tested in R&D and requires less preparatory work and
installation time to implement a feeder repair.
Other Smart Tools
To maintain and improve its safety rate, the Company must utilize available safety tools to control and
eliminate present and future hazards. Smart tools that collect additional data on the nature of Con
Edison’s field operations would improve work quality and enhance tracking capabilities. Based on the
success of vehicle cameras in reducing the motor vehicle incidents, reviewing smart tool data both at
random and defined intervals can provide leading data on employee behavior, facilitate individual and
organization-wide risk reduction through coaching, and reduce at-risk behavior occurring among
participating organizations.

Supplemental Information:

    •   Alternatives: Other options considered by the cross-functional task force that was investigating
        high-hazard injuries include modifying disciplinary processes, performing random spot checks,
        and recertification of lead mechanics. Ultimately, these options were not selected because they
        introduce significant administrative overhead or are not as effective for improving employee
        safety.

    •   Risk of No Action: Currently, the Company holds an OSHA rate of 1.12. To achieve this, the
        company focuses on building strong relationships with the union on safety, formalizing job
        planning with emphasis on high-energy tasks, and strengthening barriers against high-energy
        events. High hazard events still occur, and thus, significant risk of high-hazard injury remains.
        Without action through this program, the Company could plateau and not achieve further
        reduction in significant high-hazard injuries.

    •   Non-financial Benefits: The deployment of advanced employee safety tools offers the following
        non-financial benefits:
        o Reduced incidence rate and number of high-hazard injuries and associated lost time for
           injured employees
        o Increased protection against injury and fatality precursors

    •   Summary of Financial Benefits (if applicable) and Costs: N/A

    •   Technical Evaluation/Analysis:

        In 2018, Con Edison management established a cross-functional task force to evaluate high-
        hazard injuries, their causes, and potential means of lowering the high-hazard injury rate. The
        recommendations from that team’s efforts informed this program. R&D is currently exploring
        the development of a prototype for the primary voltage testing equipment, and the results of that
        will also inform this program.

    •   Project Relationships (if applicable):

    •   Basis for Estimate:
        Costs for this effort were determined by using current equipment costs and costs associated with
        the current R&D efforts.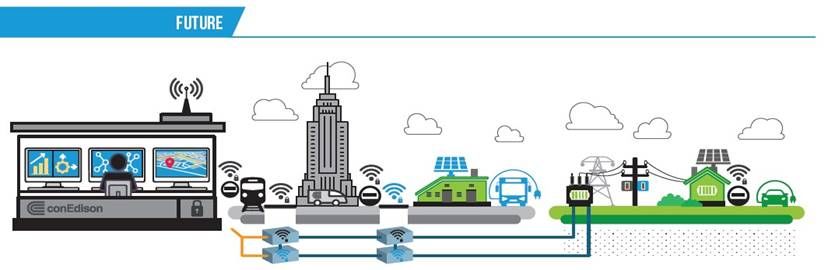
Exhibit__(EIOP-3)
                                                                                            Schedule 2
                                                                                          Page 7 of 71

Annual Funding Levels ($000):

Historical Elements of Expense:
    EOE        Actual 2014   Actual 2015     Actual         Actual      Historic          Forecast
                                              2016           2017        Year              2018
                                                                        (O&M only)
 Labor              -             -            -              -                               -
 M&S                -             -            -              -                               -
 A/P                -             -            -              -                               -
 Other              -             -            -              -                               -
 Overheads          -             -            -              -                               -
 Total              -             -            -              -                               -

Future Elements of Expense
     EOE       Budget 2019    Request 2020   Request 2021     Request 2022   Request 2023
 Labor             -               18             24               17            198
 M&S               -              761            760              760           6,080
 A/P               -                -              -                -             -
 Other             -               68             67               67            540
 Overheads         -              154            149              156           1,182
 Total             -             1,000          1,000            1,000          8,000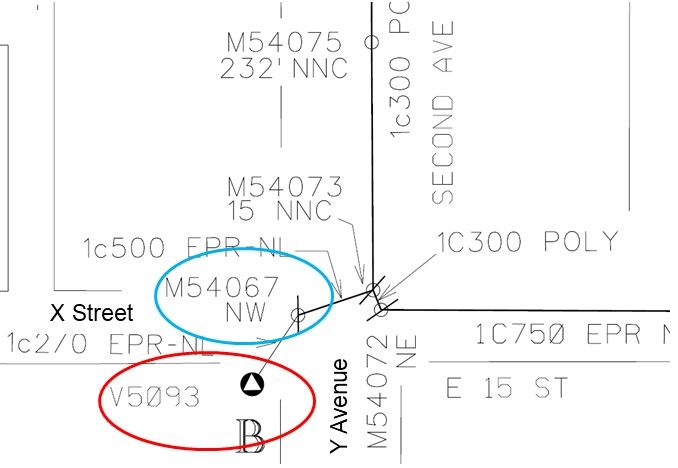
Exhibit__(EIOP-3)
                                                                                        Schedule 2
                                                                                      Page 8 of 71
                                             REVISED
                                                                                        X    Capital
                                                                                        X    O&M

                           2020 – Shared Services / Information Technology

Project/Program Title               Communications Infrastructure
Project Manager                     Wendell Little
Hyperion Project Number             PR.23317516
Status of Project                   Engineering /Planning
Estimated Start Date                January 1, 2020
Estimated Completion Date           December 31, 2023
Work Plan Category                  Operationally Required

Work Description:
As Con Edison deploys Grid Innovation systems, applications and devices, many will require
supporting communications infrastructure to maximize the value of the investment. The
Company will develop communications infrastructure to manage the transport of the data
generated by these systems. The Company’s communications strategy must deliver sufficient
capacity and diversity of communications channels to accommodate the necessary systems and
devices with the required levels of service. This infrastructure generally must be installed or
upgraded in advance of planned device deployment. Further, this strategy must address
cybersecurity and other operational requirements.

To accommodate future systems, applications, and devices, the Company will expand or
enhance existing communications infrastructure to meet the needs of each application. This
infrastructure expansion will span a twenty-year horizon in alignment with Con Edison’s Grid
Innovation plan. Optimal communications solutions were identified through system,
application, and device requirements gathering and may include:
    • Expanding the Corporate Communications Transmission Network (“CCTN”), e.g., new
        fiber
    • Expanding Itron Advanced Metering Infrastructure network (“AMI network”) on a
        limited basis if necessary based on communications traffic analysis
    • Expanding commercial carrier wireless or wireline communications

Expanding CCTN:
Con Edison owns and operates a private communications network called the CCTN. This
network enables secure communications circuits for SCADANet, voice, video, feeder
protection, and the computing and storage environment. CCTN enables computing resource
consolidation, disaster recovery, as well as the reduction of public carrier costs. There are over
200 Company locations which host the fiber optic and ancillary equipment used by CCTN. The
CCTN equipment is installed in communications rooms, communications huts, and enclosures
at the various facilities. These facilities are typically at Con Edison owned properties, including
substations and owned or leased utility poles and transmission towers. Since the late 1980s,
over 600 miles of fiber optic cable has been installed to provide CCTN communications
services. In most cases, these fiber runs were combined with electric distribution cable
installations. The need to expand capacity to address Grid Innovation requirements drives this
Exhibit__(EIOP-3)
                                                                                      Schedule 2
                                                                                    Page 9 of 71
                                            REVISED
expansion project. Enhancement options include adding AMI access points to existing CCTN
facilities, extending CCTN reach or services over microwave, and building new CCTN
facilities, depending on local topography and SCADA or capacity needs.

During the years of 2020 through 2022, Con Edison will build fiber routes in each borough,
extending the reach of the CCTN facilities. The location of the CCTN facilities build out is
dependent on the locations of the planned installation of SCADA assets.

Recently, the Company has explored innovation to include fiber optic cable and/or microducts
alongside primary distribution cable to enhance communications on our distribution
network. Fiber imbedded in the cable or blown through the included microducts will provide
a communications pathway for data gathering. Available fiber optic cable will enable data
transfer from numerous underground cable structures to a common communication point. Use
of this technology for Grid Innovation infrastructure will be done on a limited basis to
selectively extend the reach of communications networks. As this technology is proven
effective through field trials, it may be used on a more widespread basis.

Expanding AMI network and/or modifying for SCADA readiness:
Capacity planning will need to be performed prior to the introduction of any new device on the
AMI network to provide reliable service and communications. Based on this analysis network
reinforcement work may be required, consisting of adding access points in areas where
additional equipment is required.

During the years of 2020 through 2023, the Company will expand the AMI network to improve
performance, at a rate of approximately thirty additional access points per year. The traffic
model analysis uses empirical data and expected deployment of additional equipment to project
utilization per access point. Using that information, the Company can optimize utilization while
maintaining acceptable performance for all applications based on design parameters. This
process will highlight where additional access points are needed to maintain acceptable
performance in localized areas.

The radio frequency (“RF”) mesh is not static and will be regularly expanding to accommodate
new business, new applications and will be affected by the RF profile impacts of new
construction and other efforts. The Company envisions a reliability effort similar to its summer
load relief, the details of which will be determined as our network expands and conditions
change.

Expanding commercial carrier wireless or wireline communications:
Carrier services present another communication channel for Con Edison assets for both wireless
and wireline uses. A wireless option that has proven effective in the Company’s dense urban
environment, and can be made suitably secure and responsive for SCADA control devices, is
to use wireless modems and networks through carriers like Verizon or AT&T. Wireline
solutions the Company is evaluating include Multiprotocol Label Switching (“MPLS”) services
over fiber optic cable. The deployment of high-speed wireline services over fiber presents
another option for backhauling AMI access points. This offers more takeout points, a lower
hop count, and higher performance for SCADA applications.
Exhibit__(EIOP-3)
Schedule 2
Page 10 of 71
REVISED
These options are suitable when performance requirements for certain applications exceed the
design capability of the AMI network. Though effective, the downside to this approach is that
it is relatively expensive to scale as each modem requires a carrier account, and it does not
provide the network control or resiliency that is needed during extreme events.
During the years of 2020 through 2023, the Company expects it will deploy additional wireless
modems and wireline communications where appropriate.
In practice, the communication path to bring field asset data back to upstream management
systems will leverage a combination of these options. For instance, the Company could
leverage the AMI network to transmit data from field assets and other edge devices to AMI
access points. The backhaul network would then transmit the data through the established
CCTN and/or carrier networks to decision management systems and other applications.
O&M
Any significant expansion of communications infrastructure sustained over several successive
years as is required to support the expected expansion in the number and complexity of
applications that define Grid Innovation will inevitably result in an increase in O&M activity.
The O&M increases will occur in three areas, namely, cost for new carrier services, cost for
new staff, and cost for more maintenance activity.
Justification Summary:
Communications infrastructure is foundational to Grid Innovation. Deploying additional
communicating devices without the requisite performance, (e.g. bandwidth, latency, etc.) and
supporting infrastructure would lead to stranded costs of the assets or even disruption of existing
assets that use the communication networks. This infrastructure is a requirement of Grid
Innovation and Distributed System Platform (“DSP”) projects, including Volt-Var
Optimization (“VVO”), Overhead and Underground Resiliency, and Distributed Energy
Resource Management System (“DERMS”). Each of these investments relies on field assets,
like smart sensors and controllable network protectors, to inform Company applications and
systems for planning and/or operational purposes. These Grid Innovation systems, applications,
and devices will provide real-time visibility and control of grid assets and distributed energy
resources (“DER”) on the system.
The holistic design of the communications infrastructure for Grid Innovation addresses several
departmental and corporate risks, including:
• Failure of Distribution Automation and Smart Grid applications
• Failure of critical business applications
• Infrastructure constraints
• Safety
• Failure of public carrier wireless services
Each of the proposed communication solutions has distinct benefits and applications, described
below.Exhibit__(EIOP-3)
Schedule 2
Page 11 of 71
REVISED
Expanding CCTN:
CCTN continues to provide the Company with a high-speed, reliable, and cost-effective
communication alternative to public carriers. Through experience, CCTN regularly
outperforms the carriers on reliability, bandwidth, priority, and restoration. Typically, CCTN
is designed to be more disaster resilient, with greater backup power or onsite generation.
As such, CCTN provides diversity and redundancy to public carrier circuits for critical
applications that may require it. The communications diversity provided by CCTN enables the
Company to maintain operations independent of the public carriers, which is critical for ‘black-
sky days’, such as major storms or other unforeseen events that substantially impact
communications systems including public carrier services. Communication requirements for
data, voice, feeder protection, SCADA and video circuits will result in the installation and
deployment of modern communication technologies to many Company facilities. CCTN
provides the network for SCADA protection and data services to critical substations,
necessitating capital to expand the presence of the network to meet expanding SCADA and
automation needs. It serves as the corporate backbone for communication services for the
foreseeable future.
The additional communication pathway created through the development of fiber-embedded
primary cable is an important development in a dense urban environment because wireless
communications to and from field devices can be challenging. Field device information will
be communicated through the fiber to strategically located wireless communication devices for
further backhaul. This may also offer cost savings by reducing the number of wireless
communication devices necessary to monitor the system.
Expanding AMI network and/or modifying for SCADA readiness:
Leveraging the AMI network in most cases will be the lowest cost option for backhaul sensing
and data from non-control equipment, which often reports small payloads infrequently by
exception. The use of AMI for SCADA devices is being pursued. Additional communications
devices may be needed to preserve network performance in a SCADA-rich environment and
extend the reach of the AMI network to the sensing devices deployed as part of Grid Innovation.
Devices that may use the AMI network include network protector relays, smart sensors,
capacitor bank monitors; power quality, overhead reclosers; demand response assets, and other
future edge devices that could utilize the AMI network.
Expanding commercial carrier wireless or wireline communications:
The commercial carrier wireless or wireline communications offer SCADA-ready latency and
can be designed to meet cybersecurity requirements for SCADA applications. Wireless
commercial services are typically more scalable for deployment when devices require a short
lead time. Though wireline services require more lead time, there are certain locations where
extending commercial carrier wireline solutions is a more cost-effective solution than extending
CCTN. Where commercial carrier wireline solutions are extended, and ultimately connect to
CCTN, it extends the CCTN point of presence. The use of wireline commercial carriers toExhibit__(EIOP-3)
Schedule 2
Page 12 of 71
REVISED
extend CCTN point of presence becomes more important as an AMI mesh network expands the
number of sites that are viable for commercial carrier extension, greatly expanding the
usefulness of network.
Upgrades to commercial carrier wireline services are also critical for area and unit substations
without existing CCTN facilities to increase the capacity in order to handle the increased
demand of SCADA-enabled grid assets. Commercial carrier and broadband services provide
redundancy and additional diversity among carriers in the event of network outages of
company-owned networks like CCTN (and vice versa). Furthermore, these may be the only
options available where the Company’s networks do not provide coverage or network build out
is not cost-effective.
Devices that may use commercial wireless or wireline communications include targeted
network protector relays and smart sensors; distribution automation reclosers and switches on
overhead circuits; underground interrupters; capacitor bank monitors; and some power quality
meters to enable VVO.
O&M
Usage charges will apply for incremental wireless and wireline services needed to backhaul
additional access points in the private meshed wireless access network that provides last mile
connectivity to the various endpoint assets described above and for assets that communicate
directly over carrier wireless networks.
The expansion of fiber optic outside plan and telecommunications facilities housing multi-point
and point to point microwave terminal and MPLS and DWDM network gear will require
additional technical staff to design, deploy, configure, troubleshoot, maintain, and upgrade this
plant over the lifecycle of these complex systems. There will be increases in common plant like
rectifiers, uninterruptible power supply units, and batteries that will also need to be maintained.
Any increase in outside plant incurs exposure to risk to damage from normal field activity and
weather events. There will also be repairs associated with normal failure for equipment that is
in service. Some examples of these maintenance activities include replacement and repair of
fiber optic cables damaged by construction interference, electric system burnouts, rodents and
crews working in manholes with fiber cable; storm damage to overhead fiber optic cables;
ongoing proactive inspections and remediation including tree trimming; replacement of
electronic components like optical cards, power supply units, transmitters, lightning and
grounding protection and radio frequency antennas and waveguides.
Supplemental Information:
• Alternatives: For each field device, multiple communication channels were considered. The
communication channel was ultimately selected based on the following:Exhibit__(EIOP-3)
Schedule 2
Page 13 of 71
REVISED
o Risk of loss of communication – where the redundancy and communication
channel requirements are more stringent as the risk increases when that
communication channel is lost
o Company vs. third party ownership – where company ownership provides
greater control, particularly during extreme events
o Backup power requirements – where locations with available backup power
generation or batteries can meet more stringent backup requirements
o Cybersecurity requirements – where cybersecurity requirements vary for
monitoring devices vs. those that will be controlled by operators
• Risk of No Action: Risks of no action include limited communication with field assets and
edge devices, limiting data acquisition and control of applications, and eroding the value of
the investments. Failure to consider holistic solutions to communications needs could result
in unreliable communications for critical grid control assets or the inefficient buildout of
network capacity. Interruptions to control devices reduce an operator’s visibility and
control, which limits their responsiveness to manage a dynamic grid and presents a risk to
maintaining system reliability. Inefficient capacity on these networks would result in
bespoke communications solutions deployed on a device basis, rather than leveraging the
scale of the networks to appropriately build capacity. In addition, without a comprehensive
communication strategy and funding to preserve it, the Company will not be in a position
to support Reforming the Energy Vision (“REV”), DER integration, and other customer
focused initiatives.
• Non-financial Benefits: In addition to enabling many of the Grid Innovation and DSP
investments that deploy communicating devices, like structure observation systems and
controllable network protectors, the proposed communication enhancements maintain
cybersecurity and provide resiliency through diverse communications.
• Summary of Financial Benefits (if applicable) and Costs: While this project does not offer
immediate financial benefits, as additional company-owned infrastructure is built to support
the additional communicating devices, the Company will have a clearer path to retiring
some legacy communications like leased Distribution Automation System (“DAS”) radio
sites. The annual O&M cost for DAS sites is about $850,000; i.e. nominally $40K/month
for vendor support and $340K/year in site lease costs.
• Technical Evaluation/Analysis: Information Technology (“IT”) performs planning and
analysis on all technologies introduced. Solutions are investigated in conjunction with the
IT strategy and vision planning process. Interaction with IT advisors, carriers, vendors and
Company employees ensure the selection of the optimal solutions. Traffic model analysis,
measures the current performance of the AMI network and projects performance for areas
where deployment is not yet complete. This analysis measures both the average utilization
of the network and the 95th percentile performance to give a measure of both the overall
capacity and the peak-traffic performance.
The Company conducted workshops to determine the communication requirements of each
field device to be deployed through Grid Innovation. Workshop participants included
subject matter experts on CCTN, AMI, SCADA, and field assets. Requirements such as
bandwidth, latency, and control were documented in a communications matrix.Exhibit__(EIOP-3)
Schedule 2
Page 14 of 71
REVISED
• Project Relationships (if applicable): The Grid Innovation and DSP projects requiring
communications infrastructure include:
o VVO
o Overhead Resiliency
o Underground Resiliency
o DERMS
o Smart Sensors
o Network Protector Relay Upgrades
• Basis for Estimate: The estimates are based on the nominal costs of trenching for new
cable (where necessary), facilities, equipment (e.g., fiber cable, routers, and modems),
labor and overheads, and building additional equipment and facilities for the different
types of communications infrastructure. Nominal cost estimates are based on historical
spending for each type of communication. In practice, the costs will vary depending on
the specific deployment of the expected endpoints (e.g., incremental footage, facilities).
Annual Funding Levels ($000):
Capital
Future Elements of Expense
EOE Budget 2019 Request 2020 Request 2021 Request 2022 Request 2023
Labor - 680 671 917 713
M&S - - - - -
A/P - 11,021 11,113 14,667 11,865
Other - 979 987 1,302 1,054
Overheads - 2,322 2,231 3,121 2,370
Total - 15,001 15,002 20,000 16,001
O&M
Engineering and Other Services
Incremental Change due to this project to the Engineering and Other Service program
Future Elements of Expense
EOE Request 2020 Request 2021 Request 2022
Labor - - -
M&S - - -
A/P 600 200 500
Other - - -
Overheads - - -
Total 600 200 500Exhibit__(EIOP-3)
Schedule 2
Page 15 of 71
REVISED
Historical Elements of Expense total Engineering and Other Services program
EOE Actual 2014 Actual 2015 Actual 2016 Actual 2017 Historic Actual 2018
Year
(O&M only)
Labor 6,139 6,328 6,468 6,347 5,851 5,417
M&S 191 213 147 76 36 32
A/P 987 1,525 603 1,929 882 319
Other 17,427 18,779 18,918 20,469 21,512 21,911
Total 24,744 26,845 26,136 28,821 28,281 27,679
Future Elements of Expense total Engineering and Other Services program
EOE Budget 2019 Request 2020 Request 2021 Request 2022 Request 2023
Labor 5,531 6,815 6,815 6,815 6,815
M&S 33 33 33 33 33
A/P 326 3,648 3,848 4,329 4,329
Other 22,372 22,386 22,386 22,385 22,385
Total 28,261 32,882 33,082 33,562 33,562Exhibit__(EIOP-3)
Schedule 2
Page 16 of 71
X Capital
O&M
2020 – Information Technology / Information Security
Project/Program Title Cybersecurity Test Environment
Project Manager Richard Schnauthiel
Hyperion Project Number PR.23317522
Status of Project Planning
Estimated Start Date 2/1/2020
Estimated Completion Date 12/31/2023
Work Plan Category Operationally Required
Work Description:
Con Edison will establish an advanced testing environment for information security solutions to
maintain a strong, proactive security posture as additional communicating devices are used to increase
grid visibility and awareness. This will facilitate comprehensive, quick, and accurate vulnerability
discovery and remediation. This test environment will be used to confirm or validate third party vendors
and partners with whom the Company shares business, customer, or other sensitive information.
Today, periodic penetration testing and scanning is often limited to individual systems or solutions.
Vendor vulnerabilities are currently remediated through a question-answer process, which are often
difficult to validate. Based on the more rapid proliferation of communication devices, both Company-
owned and those owned by third parties, current practices must be adapted to quickly, thoroughly, and
holistically assess new devices at the expected rate of deployment.
The project includes capital investments in testing tools, the lab environment and training to enable the
analysis of Information Technology (“IT”) equipment, Operational Technology (“OT”) equipment,
workbenches, tools, facilities equipment, etc. This lab environment will include the replication of
production networks, to the extent possible, including current security tools, networking equipment, and
other devices/tools. It will provide testing capabilities for new and existing solutions.
Justification Summary:
This program is being implemented as part of Con Edison’s Grid Innovation plan. As Con Edison
deploys additional communicating equipment for sensing and control, it must maintain its high standards
for cybersecurity. The rapid penetration of additional field sensors and communication points introduces
additional vulnerabilities and cybersecurity risks to Con Edison’s electric system, with an expectation
of continued growth in the rate of complexity, size, external coupling, etc. While deployment of sensors
and grid edge technologies creates opportunity for the company, it also carries inherent risks. As part
of the Grid Innovation effort, the Company strives to thoroughly, quickly, and frequently test, discover,
and remediate vulnerabilities to minimize information security risk.
A dedicated test environment for the Grid Innovation related technology, with dedicated tools and a
sophisticated testbed, will allow the Company to quickly and thoroughly assess these items and
seamlessly validate cybersecurity risk mitigation/remediation.Exhibit__(EIOP-3)
Schedule 2
Page 17 of 71
Supplemental Information:
• Alternatives: The alternative to a Company-operated test environment is to rely on third-party
cybersecurity testing solutions. The risk with this approach is third parties may not perform
their cybersecurity testing to the Company’s standards. Furthermore, third party testing is
limited in scope to the interactions and dependencies with individual production tools, which
does not reveal a complete, holistic view of the production environment. Additionally, a test
lab would likely allow quicker setup and execution of common use cases, leading to more
efficient identification of risks, problematic interactions/dependencies, and requirements which
may not be apparent without a replication of the production environment. Without such an
environment, testing would require more overhead time/effort to stand up, generate necessary
traffic/communications, and mimic production needs and findings.
• Risk of No Action: As new systems, vendor solutions, and communication devices proliferate,
not establishing a dedicated cybersecurity testing environment may increase
cybersecurity/operational risk. These additional devices may be tightly coupled with critical
production systems, which magnifies the potential attack vectors and stresses the current testing
systems and processes.
• Non-financial Benefits: The non-financial benefits of this test environment include increasing
customer and employee information protection(s), reducing the possibility of intrusion into
Company systems, using resources more efficiently to perform cybersecurity assessments, and
reducing the gaps in the current question-answer process.
• Summary of Financial Benefits (if applicable) and Costs: The financial benefits from this
investment are difficult to quantify, but are related to quicker detection of product
vulnerabilities, a lower risk of compromise, and a reduced chance of operational impact, data
loss, and activating cyber insurance. Also, by making a test environment with reusable
advanced tools, the process can be made more repeatable, thus reducing costs.
• Technical Evaluation/Analysis: The Department of Homeland Security, National Cyber
Security Division funds the maintenance of the well-known and respected Common
Vulnerabilities and Exposures (“CVE”) system which lists publicly known information-security
vulnerabilities across devices, industries, etc. The following is the number of CVE’s listed in
the last few years:
Year 2015 2016 2017 2018 Estimate
Number of CVE’s 6,480 6,447 14,713 16,666 (6,782 YTD through May)
A graph of the vulnerabilities since 1999 shows an average increase, with a sudden spike in
2017. The number of CVEs YTD through May 2018 has nearly approached the pre-2017 peak.Exhibit__(EIOP-3)
Schedule 2
Page 18 of 71
CVE'S BY YEAR
16666
14713
# OF VULNERABILITIES DISCLOSED
7946
6610
6520
6480
6447
5736
5632
5297
5191
4935
4652
4155
2451
2156
1677
1527
1020
894
1999
2000
2001
2002
2003
2004
2005
2006
2007
2008
2009
2010
2011
2012
2013
2014
2015
2016
2017
2018
YEAR
• Project Relationships (if applicable): Most of the Grid Innovation system and equipment
deployments leverage communicating devices, such as the Distributed Energy Resources
Management System (“DERMS”), network protector relay upgrades, and automated switches
to support overhead fault location, isolation, and service restoration (“FLISR”).
• Basis for Estimate: High level estimates include hardware, software, initial licensing,
networking equipment, and necessary integrations to other systems. Where possible, estimates
were benchmarked against comparable projects.
Annual Funding Levels ($000):
Historical Elements of Expense:
EOE Actual 2014 Actual 2015 Actual Actual Historic Forecast
2016 2017 Year 2018
(O&M only)
Labor - - - - -
M&S - - - - -
A/P - - - - -
Other - - - - -
Overheads - - - - -
Total - - - - -
Future Elements of Expense:
EOE Budget 2019 Request 2020 Request 2021 Request 2022 Request 2023
Labor - 68 80 66 163
M&S - - - - -
A/P - 1,490 1,490 1,490 2,980
Other - 132 132 132 $265
Overheads - 309 297 312 592
Total - 2,000 2,001 2,000 4,000Exhibit__(EIOP-3)
Schedule 2
Page 19 of 71
X Capital
O&M
2020 –Information Technology/Business Intelligence and Middleware
Project/Program Title Data Analytics Use Cases
Project Manager Peter Maselli
Hyperion Project Number PR.23317468
Status of Project Engineering/Planning
Estimated Start Date January 1, 2020
Estimated Completion Date December 31, 2024
Work Plan Category Strategic
Work Description:
The objective of this program is to develop and deploy a series of Grid Innovation data analytics use
cases, leveraging the Enterprise Data Analytics Platform (“EDAP”), to fully utilize the existing and
emergent stores of utility and customer data. EDAP is a big data platform designed for utilities, first
implemented for Advanced Meter Infrastructure (“AMI”) related use cases. The EDAP design uses
conceptual models of all the attributes and processes related to specific data entities or domains, which
enables data to be leveraged across multiple use cases. EDAP is at the core of the Company’s expanding
Analytics Center of Excellence (“COE”), which will oversee the prioritization and data governance
standards needed for successful implementation of Grid Innovation use cases.
For any use case, there are common elements of work necessary to generate business value. These
include:
• Integrating data sources – Determining the system(s) of record and identifying the periodicity
with which the data is updated. Many of the initial use cases leverage common sources of data,
such as:
o Work Management System (“WMS”) – for asset information, data regarding the status
of work in progress, and inspection cycle history
o Network Remote Monitoring System (“Net RMS”) – for streaming data from the
network transformers (e.g., voltage, pressure)
o Meter Data Management System (“MDMS”) – for customer and usage data to correlate
customer usage to equipment health
• Modeling the data – Transforming the data as needed for consistency and modeling the data into
the type model of the platform
• Performing the analysis – Developing or licensing the applications needed to extract valuable
insights from the data. This may include using the native machine learning algorithms of the
platform or business rules developed by Distribution Engineering
For each use case, the Company will procure the additional storage or compute capacity necessary to
store the additional data that is integrated and run the algorithms to perform the analysis.
Initial candidate use cases for this program (see below) are largely oriented toward asset health
applications; however, as the program and its capabilities mature the businesses will develop use cases
to address different challenges or evolve capabilities within existing use cases.
Asset Health
Currently, Con Edison maintains equipment and inspects structures on a programmatic time-basis.
Asset data is used to react to problems, rather than analyzed for condition-based or predictiveExhibit__(EIOP-3)
Schedule 2
Page 20 of 71
maintenance. For the approximately 27,000 network transformers, the Company has developed proof of
concept internal applications Remote Monitoring System (“RMS”) Analyzer for Network Equipment
(“RANE”) and Smart User-Interface for Network Equipment (“SUNE”). These applications provide
greater visibility to the equipment health and augment the engineering analysis to identify defective
NWPs, transformers in jeopardy of failure, and other equipment defects with low priority remote
inspections. However, these are limited in scope to a single type of equipment, require point to point
system connections, and are limited by the capabilities of the visual basic programming and hardware
currently used. Furthermore, based on the underlying technology, these applications can only be
business-rule based and cannot leverage the latest machine learning technology.
The Company will develop or license an Asset Health analytics application similar to RANE and SUNE
on EDAP for equipment (e.g., network transformers, non-network switches, unit-substation assets). Data
will be integrated from systems, such as Poly-Voltage Loadflow (“PVL”), WMS, NetRMS, Feeder
Outages, power quality and load flow applications, to the enterprise platform for Asset Health analytics
usage. The tool will then utilize the sensor data, environmental data, loading, and historical failure data
to assess equipment and sensor health, failure probability and to identify impact severity in the event of
equipment failure, such as critical customers, high energy location, and large outages.
For structure monitoring, the Company is deploying the Smart Observation System to monitor and
respond to combustible gasses, stray voltage, thermal anomalies, and visual deficiencies. This data is
currently collected and transmitted back to a secure cloud storage solution. As the sensors are deployed
in the Company’s 250,000 structures, Con Edison will use a data analytics application to identify
anomalies and respond to emergent conditions. Similar types of analysis (trend recognition, anomaly
detection, predictive failures) would be applied to structures and equipment, and the Company will
evaluate whether a single application license could be used for both structures and equipment.
Work Prioritization
Con Edison engineers have developed an application that prioritizes system deficiencies (such as open
mains or overloads) for the underground secondary network. This application uses a weighted variable
decision matrix and presents a priority score on a graphical overlay. Currently, the decision matrix is
determined based on engineering knowledge and principles; however, the Company will apply the
machine learning capabilities of the platform to gauge the effectiveness of those rules and determine the
correlation of the system deficiencies to the metrics most impactful to customers (outages and power
quality disruptions). The existing application leverages data from the load flow model, critical customer
inventory (Emergency Operations System (“EMOPSYS”)), asset data (WMS), and customer data
(Customer Information System (“CIS”)/Cufflink). Additional data sources (e.g., street salting,
paving/protected street, and weather data) will be integrated to the EDAP to further refine optimize the
prioritization of work.
The Company will use a prioritization framework to evaluate use cases and determine how to apply the
program budget. The prioritization framework accounts for key attributes of the use case, such as the
ability to leverage data already integrated, the maturity of the use case in the industry, and the suitability
for the enterprise platform, among others. The Data Analytics COE and Data Analytics Steering
Committee make the prioritization decisions. Once a use case is fully developed and prioritized, the
Company estimates the data can be modeled and an application developed within one year. The
Company anticipates that it will develop the platform capability and integrate data sets in phases,
implementing capabilities as the data sources (e.g., sensors and communicating control equipment)
proliferate.Exhibit__(EIOP-3)
Schedule 2
Page 21 of 71
Justification Summary:
Advanced data analytics is an essential tool to provide the systems intelligence to make use of the
additional sensors and communications technology delivered through other Grid Innovation and
Distributed System Platform (“DSP”) investments. Machine learning and artificial intelligence offer
the ability to sift through and process the increasing volume of data being produced at the grid edge.
These advanced capabilities are existing functionalities of the EDAP that Con Edison has already
implemented as part of the AMI rollout. EDAP, as a scalable cloud-based big data platform, is well
suited to scale and add data as required for various use cases.
As additional data sources are modeled and integrated on the EDAP platform, the Company realizes
economies of scale and network effects, through reduced incremental costs for each future use case that
can leverage the same data sources. Network effects refers to the benefit where additional sources of
data integrated for one use case makes the platform more valuable to other applications that can leverage
that data. For instance, many of the use cases defined here leverage customer or usage data that is
already modeled on EDAP at no additional cost. The same will be true of future use cases that leverage
the WMS or Net RMS data that will be modeled as part of these use cases.
Each of the initial use cases described above also provides specific benefits.
Asset Health
Current practices for both equipment maintenance and structure inspections rely on time-based
programmatic inspection and replacement of equipment. Through additional sensing and advanced
analytics, the Company can begin to transition to condition-based equipment maintenance and
inspections. This change in approach will lead to fewer catastrophic equipment failures, reducing the
public safety risk and Alive on Backfeed events and expense of replacing equipment while it is still
serviceable. The benefits of using the enterprise data analytics platform for equipment asset health
analytics include the reduction of equipment failures, greater visibility of asset health (vs. targeted
sampling), reduced expenditures on inspection programs through remote monitoring, and increased
efficiency for engineering analysis.
Work Prioritization
The recently developed application for secondary network analysis assigns a priority score based on
business rules to prioritize work to provide the greatest customer benefit. This provides benefits to spend
capital more efficiently and reduce unintentional radial feeds to customers, which reduce outages.
However, the business rules and prioritization parameters can be further optimized by using machine
learning to establish correlations between system conditions and outages. This analytics tool will also
provide benefits by linking secondary deficiencies across time to understand the cumulative impact of
open mains, and where they should be restored most expeditiously. Even marginal improvements to the
Company’s allocation of capital for the secondary system, provides significant benefits given the size
of the program.
Supplemental Information:
• Alternatives: An alternative to leveraging the enterprise analytics platform to model data and
analyze business problems is to develop analytic applications in individual business areas.
Failure to use an enterprise analytics platform could result in non-IT supported application
development by individual departments that provide very limited scope and may not utilize the
appropriate resources, data, and technology. These departmental projects consume capital
funds, create new “silos” of data, may have redundant data and functionality, and ultimately
require additional support personnel for administrative and maintenance activities.
Furthermore, if the data is not integrated to the enterprise analytics platform, it can’t enable
future unspecified use cases for that data, forgoing the network benefits of the platform.Exhibit__(EIOP-3)
Schedule 2
Page 22 of 71
• Risk of No Action: Not building advanced analytics capabilities would risk forgoing a powerful
tool to optimize rules to run the business more efficiently and expand the visibility of engineers
and operators. This would restrict the Company to using the existing toolset which will not
keep pace with the rapid expansion of grid edge data. The Company would continue to manage
by business rules and programmatic replacements and would not fully utilize the other advanced
sensing and communications assets it is deploying.
• Non-financial Benefits: In addition to the financial benefits described below, the application of
Grid Modernization use cases on EDAP offer additional non-financial benefits, including:
o Risk reduction - By making use of additional grid edge data, the Company anticipates that
it will be able to reduce public safety events and better maintain its equipment resulting in
enhanced reliability for its customers
o Customer satisfaction – The reduction of public safety events will lead to enhanced customer
satisfaction
o Compliance – The work management and asset maintenance enhancements will provide
efficiencies in maintaining regulatory PSC compliance.
• Summary of Financial Benefits (if applicable) and Costs:
Specific benefits associated with each use case include:
Asset Health
- Remote inspection offsetting manual inspection
- Reduced transformer failures: Assuming ten less transformer failures per year, those
attributed to corrosion or leaking which would be detectable through analytics of pressure,
temperature, and oil (“PTO”) data.
- Improved engineering efficiency: Assuming the manual analysis required to perform PTO
switch checks and low priority remote inspections is avoided
Work Prioritization
- Improved capital allocation through optimizing the System Engineering Analysis &
Program Optimization Tool (“SEAPOT”) parameters
• Technical Evaluation/Analysis: Past experience with EDAP and Microsoft Azure big data and
analytics platforms informs 1-2 use cases of the scale outlined above can be developed per year.
• Project Relationships (if applicable): The Grid Innovation data analytics use cases are dependent
on several other investments to source, transfer, store, model, and analyze data. Smart Sensors
and Transformers with PTO sensors collect additional field data to analyze. Communications
infrastructure is required to transmit the data back to receiving systems for processing. The
Analytics Center of Excellence supports EDAP and provides analytics resources for the
implementation of use cases.
• Basis for Estimate: The estimated costs are based on number, size, and periodicity of data
sources utilized by the analytics tool, the scope of analysis performed, the reports and
dashboards utilizing the analysis, and the integration of the application to existing enterprise
systems to apply the analytics to improve field work.Exhibit__(EIOP-3)
Schedule 2
Page 23 of 71
Annual Funding Levels ($000):
Historical Elements of Expense:
EOE Actual 2014 Actual 2015 Actual Actual Historic Forecast
2016 2017 Year 2018
(O&M only)
Labor - - - - -
M&S - - - - -
A/P - - - - -
Other - - - - -
Overheads - - - - -
Total - - - - -
Future Elements of Expense
EOE Budget 2019 Request 2020 Request 2021 Request 2022 Request 2023
Labor - 70 82 67 83
M&S - - - - -
A/P - 1,490 1,490 1,490 1,490
Other - 132 132 132 132
Overheads - 310 298 312 296
Total - 2,002 2,002 2,001 2,002Exhibit__(EIOP-3)
Schedule 2
Page 24 of 71
X Capital
O&M
2020 – Common
Project/Program Title Enterprise GIS Implementation
Project Manager Baeth Fanek
Hyperion Project Number PR.23317459
Status of Project Engineering/Planning
Estimated Start Date January 1, 2019
Estimated Completion Date December 31, 2024
Work Plan Category StrategicExhibit__(EIOP-3)
Schedule 2
Page 25 of 71
CON EDISON
GEOGRAPHIC
INFORMATION SYSTEM
(GIS)
IMPLEMENTATION
BUSINESS PLANExhibit__(EIOP-3)
Schedule 2
Page 26 of 71
Table Of Contents
Table Of Contents .....................................................................................................................26
Executive Summary ..................................................................................................................26
Introduction ...............................................................................................................................29
Importance of GIS .............................................................................................................................. 29
Scope of Con Edison Systems............................................................................................................ 29
Electric System .................................................................................................................................. 29
Gas System......................................................................................................................................... 30
Steam System ..................................................................................................................................... 31
Current Mapping Systems .................................................................................................................. 32
Business Drivers for Enterprise Wide GIS ...............................................................................33
Department-Specific GIS Related Applications ................................................................................ 34
Enterprise Wide GIS In Action .................................................................................................35
Project Benefits .........................................................................................................................40
Grid Innovation .................................................................................................................................. 40
Reforming the Energy Vision (REV) Goals ...................................................................................... 41
Emergency Planning & Response ...................................................................................................... 42
Employee & Public Safety ................................................................................................................. 44
Grid Resilience ................................................................................................................................... 44
Enterprise GIS for Gas ....................................................................................................................... 45
Customer Experience ......................................................................................................................... 45
Single Source of Information ............................................................................................................. 46
Cost Reduction ................................................................................................................................... 46
Cost Benefit Analysis......................................................................................................................... 47
Advanced Future Capabilities ............................................................................................................ 48
Scope of the Program ................................................................................................................49
Phase 0
Phase 1
Phase 2
Phase 3
GIS Product Overview ..............................................................................................................52
Risk Mitigation .........................................................................................................................54
Data Conversion ........................................................................................................................56
Cost Breakdown ........................................................................................................................58
Appendix A – GIS Grid Enablers .............................................................................................59You can also read