Phasing out plastics The electrical and electronic equipment sector Sam Pickard and Samuel Sharp - Overseas Development Institute
←
→
Page content transcription
If your browser does not render page correctly, please read the page content below

Report

Phasing out
plastics
The electrical and electronic
equipment sector
Sam Pickard and Samuel Sharp
                               September 2020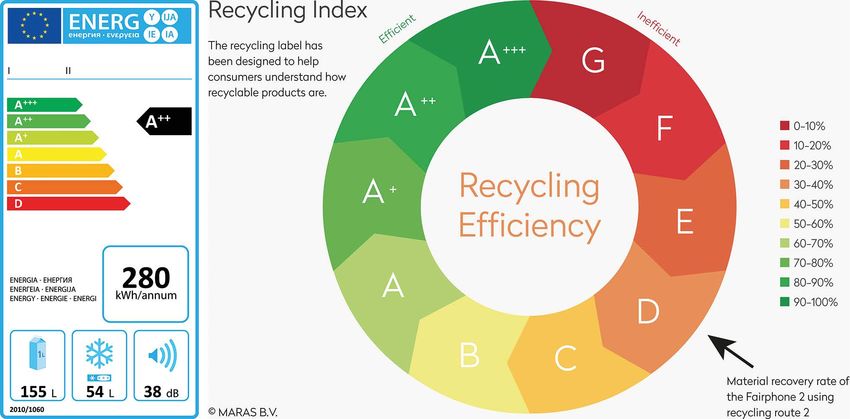
Readers are encouraged to reproduce material for their own publications, as long as they are not being sold commercially. ODI requests due
acknowledgement and a copy of the publication. For online use, we ask readers to link to the original resource on the ODI website. The views
presented in this paper are those of the author(s) and do not necessarily represent the views of ODI or our partners.

This work is licensed under CC BY-NC-ND 4.0.

Cover photo: Desktop computer and keyboard. © Egor Oxford/Unsplash
Acknowledgements

The authors are grateful to Karl Edsjö, Chris Pinches, Helen Picot, Dan Plechaty, Kingsmill Bond and
Andrew Scott for their comments on drafts of this paper. They also gratefully acknowledge guidance
and data from Arnulf Grübler. The support and assistance of Natalie Brighty, Elizabeth Tribone, Emma
Carter, Jessica Rennoldson, Poilin Breathnach and Garth Stewart with its editing and production are
gratefully acknowledged.
  The paper was prepared with support from ClimateWorks Foundation and the 11th Hour Project.
The views expressed in this document are entirely those of the authors and do not necessarily
represent the views or policies of ODI, ClimateWorks Foundation or the 11th Hour Project.

                                                 3
Contents
Acknowledgements3
List of boxes, tables and figures 5
Acronyms and abbreviations 6
Executive summary 7
1 Introduction 11
1.1 Background 11
1.2 Context 11
1.3 Methodology 12
1.4 Structure of the report 13
2 Plastics in the electrical and electronic equipment sector 14
2.1 Main plastic types, uses and trends 14
2.2 Geographies and markets 15
2.3 Data limitations 16
2.4 The lifespan of EEE plastics 17
2.5 End-of-life treatment 18
3 Plastic uses in electrical and electronic equipment 20
3.1 By plastic type 20
4 Plastics in the electrical and electronic equipment sector in 2050 22
4.1 Vision 2050 22
4.2 Alternative ways of meeting plastics demand in 2050 25
5 Pathways to 2050 27
5.1 Technical possibilities for change 27
5.2 Directions and trends 28
5.3 High-level political economy analysis of the EEE sector 33
6 Outcomes in 2050 35
6.1 Materials forecasts 35
6.2 Greenhouse gas emissions and sustainability considerations 36
6.3 Waste 36
7 Conclusions 37
References38
4List of boxes, tables and figures
Boxes
Box 1 Waste electrical and electronic equipment classification in the EU 17
Tables
Table 1 Approximate lifespans of selected common electrical and electronic equipment 17
Table 2 Common uses of plastics used in electrical and electronic equipment 20
Table 3 Examples of dematerialisation and substitution of plastics in current electrical and electronic equipment 26
Table 4 Indicated timescales for technical advances to achieve the low-plastic-demand scenario 27
Table 5 Sample rates paid to recycling firms under China’s waste electrical and electronic equipment fund 31
Table 6 Estimated change in fossil-fuel plastic demand 35
Figures
Figure 1 Summary of potential for reducing plastics demand in the electrical and electronic equipment
sector in 2050 9
Figure 2 How to cut demand for fossil-fuel plastics in 2050 12
Figure 3 Electrical and electronic sector consumption of polymer resins globally in 2015 15
Figure 4 Import–export balance of electrical machinery, equipment and parts, 2018 16
Figure 5 Mass and proportion of plastics in common waste electrical and electronic equipment 21
Figure 6 Average proportions of plastic types in common waste electrical and electronic equipment 21
Figure 7 Demand for electrical and electronic equipment under different scenarios 23
Figure 8 Examples of energy and recycling efficiency labelling 24
Figure 9 Projected growth in cloud and traditional data storage 29
Figure 10 Global shipments of digital cameras, 2003–2017 29
Figure 11 Proportion of American adults owning various information and communication technology devices 30
Figure 12 Increasing targets for waste electrical and electronic equipment recycling rates in the EU 32
5Acronyms and abbreviations
ABS acrylonitrile butadiene styrene
BAU business as usual
BFR brominated flame retardant
CPU central processing unit
CRT cathode-ray tube
DaaS device-as-a-service
EEE electrical and electronic equipment
EPR extended producer responsibility
GESP Global E-waste Statistics Partnership
GHG greenhouse gas
GPS Global Positioning System
HDPE high-density polyethylene
HVAC heating, ventilation and air conditioning
ICT information and communications technology
ISWA International Solid Waste Association
IT information technology
ITU International Telecommunication Union
LCI Life Cycle Inventory
LDPE low-density polyethylene
LED low energy demand
LLDPE linear low-density polyethylene
MFA material flow analysis
NGO non-governmental organisation
PET polyethylene terephthalate
PMMA polymethyl methacrylate
PP polypropylene
ppm parts per million
PS polystyrene
PUR polyurethane
PVC polyvinyl chloride
RoHS restriction of hazardous substances
StEP Solving the E-waste Problem
UNU United Nations University
WEEE waste electronic and electrical equipment
6Executive summary
Background produced from fossil fuels by 2050. Unlike
most top-down and circular-economy analyses,
Today, almost all plastics are made from fossil- we take a bottom-up approach to assess the
fuel raw materials (oil, gas and coal) and use use of six main (‘bulk’) plastics1 in four sectors
fossil-fuel energy in their manufacture. Globally, – packaging, construction, automotive and
they were the source of about 4% of greenhouse electrical and electronic appliances. These sectors
gas (GHG) emissions in 2015 (Zheng and Suh, together accounted for around 60% of plastics
2019) – more than the whole continent of Africa. consumption in 2015, while the six bulk plastics
By 2050, on current trends, emissions from accounted for 80% of all plastics production
plastics will be three times present levels. Simply (Geyer et al., 2017).
put, current trends for plastic production and These sector studies illustrate both the
use are incompatible with averting catastrophic technical and high-level political feasibility of
climate change. phasing out fossil plastics production and use in
Analyses and campaigns on the negative side these sectors. They do not assess the likelihood
of plastics have focused predominantly on plastic of it being achieved, nor explore in detail the
waste, ocean pollution and threats to human economic, political and behavioural dimensions
health. The climate impacts of plastics must be of these changes.
filtered into this discourse to inform solutions to
the various challenges posed by current plastic Method
consumption. Tackling these challenges separately
will not suffice. Better materials handling and Our analysis uses current trends to forecast
waste management may help with pollution business-as-usual (BAU) demand for plastics
and waste, but will not address plastic’s climate in the sector in 2050. We then investigate the
footprint. Similarly, the substitution of plastics different uses of each bulk plastic type in the
derived from fossil fuels with ones from carbon- sector today to provide a basis for reducing future
neutral sources will still cause waste and pollution. consumption in a low-plastics-consumption
To have any chance of managing these challenges, scenario. We estimate the technical potential to
we must downscale the problem. It is imperative reduce the use of new plastic materials compared
from a climate and broader environmental with BAU in 2050 by considering the potential
perspective that we curtail the consumption of for dematerialisation and reuse (avoiding the need
new plastic materials. for new plastic demand) and substitution (shifting
the demand for new plastics to demand for other
Context materials). The implications of this reduction
and the opportunities to manage residual plastic
This technical analysis is part of a broader production (for example, by using recycled
research project investigating the technical plastics) are covered holistically in the companion
potential for phasing out virgin plastic materials synthesis report.
1 Polyvinyl chloride (PVC), polyethylene (PE), polyurethane (PUR), polystyrene (PS), polypropylene (PP) and polyethylene
terephthalate (PET).
7Plastics in electrical and electronic than virgin plastic) and in part by regulation.
equipment today The degree to which plastic is recycled back to a
The electrical and electronic equipment (EEE) similar use rather than downcycled to uses with
sector consumes the least amount of virgin less stringent specifications is unknown. In some
plastic materials of the four sectors analysed cases recycling is constrained, because additives
in this wider study, but was still responsible to plastics in previous uses are now known to
for 18 million tonnes (Mt) of plastic demand be toxic and their levels in recycled plastic are
in 2015, having grown 3.8% a year over the legally controlled.
two previous decades (Geyer et al., 2017). The It is unlikely that facilities for plastics
concomitant development of the plastics and production will be specially designed or designated
EEE sectors has inevitably seen them intertwine; for the EEE sector alone. Rather, generic,
many products in the EEE sector only became unconverted plastic materials (resins) can be
widespread once certain plastics were available. transformed into EEE components by myriad
Plastics have often been the first-choice material companies at various points along the supply
for EEE components, as they can meet product chain. Larger and heavier electrical appliances
specifications at a lower production cost than are likely to be produced domestically, or at least
other materials. This has helped drive their within the same regional markets as the final
growth and probably made these products products, while smaller and lighter electronic
available to lower-income consumers. Despite devices are more commonly produced in a few
their near ubiquity in the EEE sector, few plastics Asian countries, then transported internationally.
play an intrinsic role in the operation of EEE
and are, instead, often used for functions that Opportunities to reduce demand in 2050
are essential, but not plastics-specific, such as
structural support and protective casings. Our low-plastics-consumption scenario illustrates
Two notable aspects of the distribution of how the consumption of plastic materials could
plastics used in the EEE sector are that (1) the be drastically reduced in 2050 compared with
sector has the lowest proportion of total plastic a BAU scenario. It builds on projections set out
consumption of the six bulk plastics analysed in Grubler et al.’s (2018) low energy demand
in this series (54%) (Geyer et al., 2017); and (LED) scenario, which makes substantial progress
(2) none of the many EEE subsectors dominates towards the Sustainable Development Goals
the sector’s plastic use. Plastic components and – especially those related to poverty (SDG 1),
subcomponents are found in a very wide array hunger (SDG 2), health (SDG 3), clean energy
of electrical appliances – from vacuum cleaners (SDG 7), responsible consumption and production
to air conditioning units and washing machines (SDG 12) and climate change (SDG 13).
– and electronic devices (or electronics) – such Our 2050 low-plastics-consumption vision
as mobile phones, computers and televisions. projects an increase in demand for EEE services,
The divide between electrical appliances and stemming from the faster growth in prosperity
electronic devices is also often blurred, with of the Global South assumed in the LED
many companies producing both. scenario. At the same time, however, we see this
Estimated average lifespans for plastics in the demand being met with fewer, more durable,
EEE sector vary from 2 to 17 years depending multifunctional EEE products. Together, these
on the application. The disposal of waste factors yield a 12% decrease in demand for
EEE (WEEE) products has been a focus of plastic materials compared with BAU.
environmental campaigners and legislators for The remainder of the reduction in plastics
decades. A limited quantity of plastics is recycled consumption considered in this report arises from
as part of broader WEEE recycling efforts, a reduction in the intensity of plastic use in the
but plastics are not the primary target of these EEE sector. This can be achieved by less material-
actions. Many EEE producers already employ intensive service delivery, especially by reducing
recycled plastic in their products, driven in part overdesign and redundancy, and by substituting
by economics (recycled plastic may be cheaper plastic materials with non-plastic alternatives. For
8the bulk plastics considered in this analysis, most consumers, the relatively low costs associated
have structural and aesthetic roles that are already with producing plastic components suggests that
being filled by other materials in EEE products plastics are likely to remain a key material for
available today, plainly demonstrating that it is EEE producers unless there is a substantial shift
technically possible to significantly reduce the use in consumer preferences or regulation. Demand
of plastic materials by 2050. We project plastics for low-cost EEE seems set to grow, especially
consumption to be 56% lower than BAU in 2050 in poorer countries. This is likely to be at the
and 25% higher than in 2015. expense of more durable or reparable EEE, which
The synthesis report to accompany this may have higher upfront costs.
study considers the potential for satisfying this In many countries, the reuse, reconditioning
residual demand with plastics from recycled and and repair of EEE are already common and
non-fossil feedstock. markets are well-established. Trade-ins and
The combined reduction in plastic producer take-back schemes help to create
consumption could lead to a significant drop in reuse cycles, with some EEE products typically
GHG emissions from plastics production and owned by a number of consumers over their
use (45 Mt CO2e in 2050, compared with 88 lifetimes. A reduction in new demand would
Mt CO2e in 2015). However, the net effect on be complemented by the increasing design and
emissions will depend on the carbon intensity of manufacture of modular products that are easier
any materials used to substitute plastics in 2050. to repair.
Similarly, understanding the impact on broader The pervasiveness of the sharing economy and
environmental aspects would require more the ready availability of products as a service
detailed case-by-case analysis. (PaaS) – those that are rented rather than owned –
would support the drive towards more durability.
Prevailing trends At the same time, there is some evidence to suggest
that consumers will increasingly be able to do
Plastic consumption by the EEE sector is more with fewer, multifunctional devices. The
rising, mainly driven by growth in the sector impact of these trends is likely to be compounded
itself. Even though material prices are only a by the continued shift towards cloud-based
small determinant of the overall price paid by storage systems and some of the broader trends
Figure 1 Summary of potential for reducing plastics demand in the electrical and electronic equipment sector
in 2050
60
51
50
–6
40
Plastic demand (Mt)
30
23
20 18 –23
10
0
2015 BAU Dematerialisation Substitution Vision
2050 and reuse 2050
Sources: Authors; Geyer et al. (2017)
9envisaged by the LED scenario (such as urban devices. This will require EEE products to be
densification), which we discuss in the other designed to be reparable, along with a massive
sector reports. rebalancing of markets towards those that
Recycling of WEEE is already a major priority prioritise direct reselling and reconditioning of
for many nations. This will continue, as EEE EEE. A reduction in the number of EEE devices
products typically have easily identifiable also requires amplification of PaaS business
producers, contain valuable materials, which models in some sectors.
are also sought by recyclers, and are themselves The visibility of EEE products, the emergence
valuable, making them less likely to be simply of a wider sustainability agenda led by
discarded. Producers around the world are also environmentalists and key actors within the
moving to phase out toxic additives that have industry, and the growing number of rental
hampered the recycling of WEEE plastics in and service business models suggest the
the past. Many have already begun to set goals potential to realise this reduction in plastic
to reduce the amount of virgin plastics used in demand. However, the key to achieving our
their products. 2050 scenario is designing markets that favour
durable, reparable and resaleable EEE products,
Pathways to reducing demand as opposed to low-cost, single-user products.
Voluntary and mandatory standards that
Our vision for 2050 involves broad global access promote durability, reparability and recycling,
to the beneficial services that EEE provides. directly comparable lifecycle data and an
Instead of constraining service demand, we focus increased focus on plastics specifically could help
on how these services may be provided with a shape markets in a more sustainable way and
much lower material (and, in particular, plastic) reduce plastic demand. Although there is already
footprint. Fundamentally, this involves shifting action on some of these issues, the challenge will
away from inappropriate, short-lived, single- be scaling up these efforts, especially in parts of
user EEE towards an EEE sector comprising the world where EEE demand is forecast to grow
appropriate, durable, shared and multifunctional most rapidly.
101 Introduction
1.1 Background forecasting and circular-economy analysis, but
our method is different. We take a bottom-up
Today, almost all plastics are made from fossil-fuel approach to assessing the use of plastics in four
raw materials (oil, gas and coal) and use fossil-fuel sectors (packaging, construction, automotive
energy in their manufacture. They account for 9% and electrical and electronic appliances), which
of total demand for oil and 3% of total demand together account for around 60% of total
for gas and, by 2050, they could account for as plastics consumption (Geyer et al., 2017).
much as 20% of oil demand (World Economic Our analysis focuses on the six main types
Forum et al., 2016). Plastics are also problematic of plastic (polyethylene (PE), polypropylene
for the global climate emergency. They were the (PP), polystyrene (PS), polyvinyl chloride
source of about 4% of global GHG emissions in (PVC), polyethylene terephthalate (PET) and
2015 (Zheng and Suh, 2019) – more than all of polyurethane (PUR)). These ‘bulk plastics’
Africa. By 2050, on current trends, emissions from accounted for about 80% of total plastics
plastics will be three times greater than present production in 2015 (Geyer et al., 2017).
levels. However, global GHG emissions need to We consider the upstream and downstream
reach net zero by 2050 if the world is to have a aspects of the plastic value chain to operate
chance of averting catastrophic climate change outside the individual sectors. In other words, the
(IPCC, 2018). production of plastic pellets and the collection
Recently, plastic waste and pollution have of waste plastic materials is largely separate
been the dominant narrative on the negative side to – and cuts across – the sectors in which
of plastics. In addition to the effects of plastic plastic products are used. We therefore discuss
pollution on sea life, concerns have arisen about opportunities to reduce the environmental
toxicity and health problems related to plastic impacts of plastics demand through changes to
microfibres found in the air, water and food. the production, recycling and disposal processes
Better materials handling and waste management in the accompanying synthesis report. The
will not be enough to address these challenges. technical reports in this study series focus
Nor will they be resolved by substituting plastics on minimising the demand for plastic
derived from fossil fuels with those made from materials, because any reductions in aggregate
biomass – these will also lead to waste and demand facilitate easier management of these
pollution. It is imperative from a climate and associated processes.
broader environmental perspective that the The purpose of these detailed sector studies
demand for new plastic materials be curtailed. is to illustrate both the technical and high-level
political feasibility of phasing out fossil plastics
1.2 Context production and use in these sectors. The target
audience for the synthesis report is broad,
This technical analysis serves as part of a including policy-makers, advocacy groups,
broader research project investigating the the private sector and other researchers. The
technical potential for the phase-out of virgin audience for the technical reports is narrower,
plastic materials produced from fossil fuels primarily researchers and those working directly
by 2050. Our focus complements existing in the sector.
111.3 Methodology This report focuses on the first two steps,
namely, how to reduce demand. Steps 3 and 4
Our analysis begins by identifying the amount of (how to accommodate residual demand) are
plastic used in the EEE sector currently, and uses addressed holistically for all sectors in
recent trends to project BAU demand for plastics the companion synthesis report. Figure 2
in the sector in 2050. We investigate the different illustrates the process across the technical and
uses of each bulk plastic type in the EEE sector synthesis reports.
today to establish a basis for reducing future We round out our focus on the technological
demand. We then calculate the technical potential feasibility of making changes by 2050
to reduce the demand for new plastic materials with some high-level insights into the political
compared with BAU in 2050 by considering the economy of bringing about such a transition
following opportunities in cascading fashion: – the interests, incentives and policies that
influence key sector stakeholders and how
1. dematerialisation and reuse (avoiding the these would need to change. However, the
need for new plastic demand) study does not assess the likelihood of the
2. substitution (shifting demand for new plastics vision being achieved, nor explore in detail
to demand for other materials) the economic, political or behavioural
3. plastics recycling (optimising waste dimensions of these changes. Rather, we aim
management schemes associated with plastics) to present one possible outcome and illustrate
4. non-fossil feedstocks (for residual demand that how it might come about, rather than predict
cannot be reduced by the above approaches). the future.
Figure 2 How to cut demand for fossil-fuel plastics in 2050
Technical report Synthesis report
Mass of plastic
5
AU 0
d r ati by
tio y
20 nd
ng
toc ive
itu b
01
r B 05
in ma
cli
eu on
n
50
ks
ds nat
an ialis ion
bs ion
n2
de 2
cy
se
e
un d in
r ct
su uct
fee lter
ld
Re
di
ate u
m Red
d
A
ua
an
an
Re
sid
m
m
De
De
Re
de
121.4 Structure of the report • Chapter 5 provides a high-level analysis of
steps to achieve this vision.
The remainder of the report is structured as follows: • Chapter 6 illustrates the potential
outcomes in 2050, illustrating total demand
• Chapter 2 provides an overview of plastic for plastics in the sector under the low-
consumption by the sector. plastics-demand scenario, the associated
• Chapter 3 details the uses of plastics in impact on CO2 emissions and the amount
the sector. of waste generated.
• Chapter 4 illustrates our 2050 vision for • Chapter 7 provides an overall conclusion to
reducing the demand for virgin fossil plastics. our analysis of the sector.
132 Plastics in the
electrical and electronic
equipment sector
2.1 Main plastic types, uses The concomitant development of the plastics
and trends and EEE sectors has led them to intertwine,
perhaps more than any other sector analysed
Plastic components are ubiquitous in the EEE in this report series. While the automotive and
sector, which was responsible for approximately construction sectors were well-established before
18 Mt (5% of total) plastics consumption in 2015 plastics were a dominant material (the growth
(Geyer et al., 2017). The use of plastics by the sector of plastics in these industries largely being due to
grew by 3.8% per year over the preceding two plastics replacing other materials), many products
decades – the lowest rate of the sectors analysed in the EEE sector only became widespread when
(Geyer et al., 2017). Both industry associations plastics were available. Plastics have often been the
(such as Plastics Europe, n.d.) and academics first-choice material for EEE components. This is
(for example, Gu et al., 2016) note that plastics in part because the relative ease with which plastics
are important elements in the EEE sector, which can be handled means manufacturers can reduce
plays an incredibly useful role in daily life. Plastic production costs compared with other materials,
components and subcomponents are found in a even when raw material costs are similar.
wide array of electrical appliances – from vacuum It is largely plastics’ ‘ability to effect weight
cleaners to air conditioning units and washing and cost savings without compromising on
machines – and electronic devices (or electronics) – aesthetics and functionality’ that has led to
such as cell phones, computers and televisions. their broad take up by the industry (Frost and
The EEE sector is not consistently defined, Sullivan, 2019), rather than a direct consumer
hampering attempts to comprehensively preference for plastics. These cheaper and lighter
establish which companies dominate the market products have been key to the growth of the
and how large it is,2 especially as the divide EEE market, with lower costs probably having
between electrical appliances and electronic expanded the availability of these products to
devices is often blurred, with many companies lower-income consumers. For electronic devices
producing both (LG, for instance, makes both in particular, this needs to be set against the fact
washing machines and cell phones). Even so, that the cost of plastics is usually a minor part
Wath et al. (2010) labelled the electronics of overall production costs and just a fraction
sector as the world’s largest and fastest-growing of the price at which products are sold (see, for
manufacturing industry. example, Reisinger, 2016; Lembart, 2018).
2 For example, the Fortune Global 500 list of the highest revenue-generating companies lists Apple as part of the computer
and office equipment industry, but Hon Hai Precision Industry (aka FoxConn, which makes all of Apple’s products) and
Samsung Electronics as part of the (separate) electronics industry.
14Plastics’ versatility and lower cost have styrene (ABS), appear to mainly be employed
enabled the development of the modern EEE for structural and protective uses (for example,
sector. But this co-evolution of plastics and EEE see OKW Enclosures, n.d.). This suggests that
is only part of the story. At a functional level, less than one-fifth of the plastics consumed by
plastics’ use in the sector can be broadly divided the electronics sector are high-end engineering
into technologically advanced engineering plastics with intrinsic applications (printed circuit
plastics that play an intrinsic role in operation of boards, for example, are usually made from FR4
EEE and bulk plastics that are used for functions – a fibreglass and epoxy resin composite, rather
that are not plastics-specific, such as structural than one of the bulk plastics). Rather, the EEE
support and protective casings. industry tends to use plastics to provide structural
Figure 3 shows that bulk plastics (the focus support, protection for other components,
of this report) accounted for 54% of plastics aesthetic coverings or some combination thereof.
used in the sector in 2015. Additives, most of None of the many subsectors in the EEE sector
which are likely to be found with bulk rather dominates plastic use; it is split over a large range
than engineering plastics, are responsible for of applications. This is exemplified by the fact
another 28% of plastics consumed by the sector. that none of the 35 examples of bulk-plastic use
Most consumer electronics also use other plastics cited by the European plastics industry trade body
that are not included in this analysis, some in relates to the EEE sector (Plastics Europe, 2018).
relatively large quantities.3 Many of these other
plastics, such as polycarbonate, polymethyl 2.2 Geographies and markets
methacrylate (PMMA) and acrylonitrile butadiene
The relatively small proportion of total plastic
production attributed to the EEE sector makes it
Figure 3 Electrical and electronic sector
unlikely that plastic production facilities will be
consumption of polymer resins globally in 2015
specially designed for or designated to the sector
PVC alone. Rather, the raw plastic materials (such
1.3 HDPE as polymer resins) used by the sector are likely
0.6 co-produced with larger volumes for other sectors.
Additives
PUR The manufacturing process that transforms
5.1
1.3
resins into components used in EEE devices can
be carried out by the company making the final
product, or parts can be made by intermediate
Mass of PS companies and then assembled. How companies
plastic 1.9 lay out their supply chain can vary by size,
(Mt)
product and component. For example, Samsung
Electronics tends to buy in smaller components,
but manufacture its own plastic parts for larger
components using plastic resin purchased from a
Other PP sister plastic-producing company, Samsung Total
plastics 2.9 Petrochemicals Co., Ltd (Government of Canada,
3.2 2012). Smaller and lighter electronic devices
LDPE, LLDPE
1.6 may be transported internationally, while larger
Note: LDPE, low-density polyethylene; HDPE, high-density and heavier electrical appliances are likely to be
polyethylene; LLDPE, linear low-density polyethylene. produced domestically, or at least within the same
Source: Geyer et al. (2017) region as the final product.
3 Market research into the consumer electronics market for plastics also details demand for polycarbonate, ABS, styrene-
acrylonitrile resin (SAN), acrylonitrile styrene acrylester (ASA), PMMA and others (including styrene ethylene butadiene
styrene (SEBS), polyphenylene ether (PPE), polyphenylene oxide (PPO), polyamide (PA) and plastic blends) (Transparency
Market Research, n.d.).
15Production of electronic devices is often plastics used (around 40% of the total), but does
considered to be dominated by a few Asian not specify what the 15 plastics included in this
countries, most notably, China, South Korea, total are used for. Similarly, Fairphone – arguably
Taiwan, Japan and Viet Nam (Greenpeace, the most sustainably minded electronics company
2017). However, because many countries both in the world – has redacted the inventory lists
directly re-export imported electronics and for its components from its published lifecycle
integrate imported components into other devices assessment, which only looks at the end-of-life
that are then exported, it is difficult to trace fate of the battery and metals (Proske et al., 2016).
this in international trade statistics (Figure 4). Other issues include the crossover between plastics
In dollar terms, China, Hong Kong, the United used for EEE in the consumer and institutional
States and Germany dominate the import and products, automotive and construction sectors.
export of EEE. Most of the data on sectoral plastics use
presented here is, therefore, taken from discussions
2.3 Data limitations of WEEE. This introduces a considerable time lag
to the data. According to Geyer et al. (2017), 18
The range of applications, appliances and Mt of plastics were used by the electronics sector
markets and the paucity of data available in 2015, yet the sector only produced two-thirds
from manufacturers frustrate attempts to of this amount (13 Mt) in waste that year. The lag
comprehensively describe the amount of and is compounded by the various in-use lifetimes of
reasons for plastics use in the sector. The reasons different plastic-containing products and the pace
for the limited data availability on plastics use of change in some parts of the sector.
are (1) their relatively small value or impact A final complication stems from the different
compared with other materials/components; product groupings adopted in different regions,
and (2) commercial confidentiality. A review which have also changed over time. In China and
of the lifecycle impacts of changes in the Japan, five electronics products have tended to be
design of refrigerators by the Japan Electrical taken as representative of the broader industry
Manufacturers’ Association (2014), for example, (see, for example, Gu et al., 2016; Li et al., 2019;
provides an aggregate value for the mass of Yagai, n.d.): televisions (TVs), computers (PCs),
Figure 4 Import–export balance of electrical machinery, equipment and parts, 2018
Imports Exports
China
Hong Kong
South Korea
United States
Germany
Taiwan
Singapore
Viet Nam
Japan
Malaysia
Mexico
Other
–1.25 –1 –0.75 –0.5 –0.25 0 0.25 0.5 0.75 1 1.25
Import–export balance (trillion US$)
Source: Intracen (2019)
16Box 1 Waste electrical and electronic equipment classification in the EU
Temperature-exchange equipment. More commonly referred to as cooling and freezing equipment.
Typical equipment includes refrigerators, freezers, air conditioners and heat pumps.
Screens. Typical equipment includes televisions, monitors, laptops, notebooks and tablets.
Lamps. Typical equipment includes fluorescent lamps, high-intensity discharge lamps and light-
emitting diode lamps.
Large equipment. Typical equipment includes washing machines, tumble dryers, dishwashers,
electric stoves, large printing machines, copying equipment and photovoltaic panels.
Small equipment. Typical equipment includes vacuum cleaners, microwaves, ventilation equipment,
toasters, electric kettles, electric shavers, scales, calculators, radios, video cameras, electrical and
electronic toys, small electrical and electronic tools, small medical devices and small monitoring
and control instruments.
Small IT. Typical equipment includes mobile phones, Global Positioning System (GPS) trackers,
pocket calculators, routers, personal computers, printers and telephones.
Source: Adapted from Baldé et al. (2017)
Table 1 Approximate lifespans of selected common electrical and electronic equipment
EEE Song and Li, 2015 Proske et al., 2016 Baldé et al., 2017 Fiore et al., 2019
(years) (years) (years) (years)
Mobile phones – 3 1.5–2 2–5
Personal computers and laptops 4–5 – 4 2–5
Televisions 8 – 9 5–7
Washing machines and dishwashers 10 – 12 10
Air conditioning units 10 – 17 10
Refrigerators 9 – – –
washing machines, air-conditioning units (AC) just four product types (computers, monitors,
and refrigerators. Some 760 million of these TVs and cell phones) (Duan et al., 2013).
items were produced in China in 2013 (Gu et al.,
2016). The European Union (EU) originally 2.4 The lifespan of EEE plastics
classified WEEE into 10 groups (Martinho et al.,
2012), but recently narrowed that down to six, Table 1 shows that the lifetimes of EEE plastics
as suggested by the Global E-Waste Monitor vary considerably across EEE subsectors. In
(a United Nations University (UNU) initiative) general, there has been a decrease in average
and set out in Box 1 (Baldé et al., 2017). In the in-use time for EEE in recent decades, as
United States, regulation of WEEE is mainly at technological development and marketing have
state level, so the definitions of WEEE vary. A combined to accelerate consumer desire for
2013 report by the Massachusetts Institute of the latest versions of appliances and devices
Technology considered ‘electronics’ to include (Gu et al., 2016).
172.5 End-of-life treatment Where WEEE is treated, it is most likely to
undergo mechanical recycling (Awasthi et al.,
WEEE typically includes the plastic components 2018). This tends to involve manual dismantling
originally integrated into EEE products, and (which is more efficient for separating
plastics are subject to most of the trends components, especially metals) combined with
affecting WEEE more broadly. WEEE a mechanical process (typically shredding and
has received considerable attention from sorting based on material characteristics, such
environmental campaigners, policy-makers and the as density) (Ueberschaar et al., 2017). More
waste industry in recent decades, mainly due to: complex devices (such as mobile phones) may
just be chemically treated to recover the metals,
• worries about environmental damage with other materials (notably plastics) discarded
(such as refrigerant gases and persistent or burned in incineration plants (see, for
organic pollutants) example, Proske et al., 2016).
• the potential for harm to human health (from Several countries and regions have implemented
heavy metals or brominated flame retardants recycling targets. For example, EU Directive
(BFRs), for instance) 2012/19/EU (EU, 2012) required 85% of the
• the economic potential for recycling materials mass of WEEE generated to be recycled by 2019.
in WEEE (metals and glass, for example) As plastics typically constitute more than 15%
(Fiore et al., 2019; Wang and Xu, 2014; of WEEE, this implied that at least some plastics
Stenvall et al., 2013). must also be recycled (Stenvall et al., 2013).
However, official data show this target is far
Until very recently, it was common practice for from being realised, either in the EU (where an
richer countries to export WEEE rather than estimated 35% of WEEE is recycled) or globally,
recycle it domestically. This was driven by lower where the fate of the vast majority of WEEE
labour costs and less stringent environmental (around 80%) is not documented (Baldé et al.,
regulations in developing countries (Man et al., 2017; Forti et al., 2020). It is possible that some of
2013). In the EEE sector, this gave producing this waste plastic is recycled but not captured by
countries a ready supply of recyclable material, official data, but the estimated value of materials
often required in products manufactured for lost from the formal economy via WEEE in 2016
those wealthy markets. was €55 billion (Baldé et al., 2017). Closing
In theory, WEEE is subject to the 2002 Basel production loops in line with circular-economy
Convention, effectively outlawing the export principles would allow much of this value to be
of polluting toxic materials (Ibanescu et al., recovered. Although plastics usually account for a
2018). However, environmental NGOs have small part of the value of EEE products (especially
shown how WEEE exports can end up being electronics) in material terms, the loss of plastic
handled by the informal sector in developing resources may be more acute for countries
countries, increasing the likelihood of unsafe without fossil-fuel production and processing
recycling practices (Puckett et al., 2016; 2018; Gu infrastructure (Martinho et al., 2012).
et al., 2017) – ‘e-waste dumping’ (Vidal, 2013). The main reason that recycling rates are
More recent policy changes in response to this falling short of their targets is that there are often
by WEEE-importing countries (most notably insufficient monetary incentives to recycle WEEE.
China’s National Sword Policy) have impacted In some jurisdictions, recycled plastics are cheaper
the international movement of waste – both than virgin materials, so are used in new EEE, but
decreasing the aggregate amount of WEEE and this plastic is often sourced from waste from other
diverting it to countries with less stringently sectors rather than from WEEE. Fiore et al. (2019)
enforced import policies. However, insufficient draw together research by others that shows how
accounting mechanisms for internationally traded these economic barriers are bolstered by several
WEEE can make these flows difficult to track structural or systemic hurdles to a truly circular
(Duan et al., 2013). economy in the WEEE sector, including:
18• WEEE management being dominated by the mainly functions to limit the quantity of hazardous
informal sector in many low- and middle- additives that are often present in components
income countries, meaning compliance may constructed from bulk plastics. Plastics containing
be low even if specific regulations exist any BFRs and heavy-metal concentrations over
• the dominance of the informal sector, 1,000 parts per million (ppm) (100 ppm for
combined with poor infrastructure for the cadmium) cannot be recycled. More recently,
collection and separation of WEEE, which can regulations have been considered for pro-oxidant
lead to insufficient facilities and capacity for additives (which may facilitate the degradation
correct – and safe – WEEE processing of recycled plastic materials) and phthalates
• a lack of involvement and awareness of (particularly those in PVC, which are known to
consumers and local authorities. be toxic) (Shawaphun et al., 2010; Pecht, 2018).
Many plastics containing these additives can only
Another barrier limiting the recycling of plastics be disposed of by incineration in cement kilns (in
from WEEE stems from the EU Directive on other words, not only can they not be recycled, but
the Restriction of the use of certain Hazardous the products of their combustion are too toxic for
Substances (RoHS) in EEE (Directive 2011/65/ them to be disposed of in standard incineration
EU) (EU, 2011; Stenvall et al., 2013). The RoHS plants) (Martinho et al., 2012).
193 Plastic uses in
electrical and electronic
equipment
3.1 By plastic type in vacuum cleaners (Gallego-Schmid et al.,
2016) and just 7% in dishwashers and washing
Table 2 provides an overview of some of the uses machines (Fiore et al., 2019).
of various plastics in the EEE sector. This variation is probably the result of
No data were available to comprehensively attempts to characterise such a broad range of
quantify plastic consumption by end use, and products into relatively few categories. Plastic
averaged values should be treated with caution content can vary considerably from company
given the variety of EEE products, markets, sectors to company and category to category: small
and uses of plastic materials. Nonetheless, some
studies have attempted to quantify some aspects Table 2 Common uses of plastics used in electrical
of plastics use in EEE. In their analysis of the and electronic equipment
plastic profiles of more than 3,000 WEEE items,
for example, Martinho et al. (2012) note that Plastic type Example uses
previous analyses suggest plastics accounted for PE Cable and wire insulation,
10–30% of all WEEE by mass. While others have appliance housing
reported findings within this range – for example, PP Housings and handles for higher-
Wang et al. (2018) suggest from a review of temperature environments
available data that an average flat-panel television (such as kettles)
contains 5.7 kg of plastic (21% of its total mass), PS Refrigerator trays/linings,
concurring with findings by Fiore et al. (2019) – it TV cabinets
seems like an over-generalisation. For example, PUR Insulation in fridges and freezers
breaking their analysis down by category, (thermosetting), appliance housing
Martinho et al. (2012) show that the mass of (thermoplastic)
plastic ranges from 3.5% of the total for central PVC Cable and wire insulation,
processing units (CPUs) to 49.1% for small WEEE cable trunking
items, and that the total amount of plastic varies
Other Structural/ Housings for telephones, music
from less than 1 kg on average in small WEEE to aesthetic: systems, computers, keyboards,
16 kg per photocopier (see Figure 5). for example, monitors, toasters, coffee machines
Similar outliers are readily available in sector- polycarbonate,
specific studies. For example, Li et al. (2019) PMMA, ABS
report plastics to account for 30–44% of the Technical: for Circuit breakers, switchgear, light
total mass of a refrigerator, which chimes with example, alkyd, fittings, components, circuit boards
the approximate 40% reported by the Japan amino or epoxy
Electrical Manufacturers’ Association (2014). resins
Some 50–60% plastic content has been observed Source: British Plastics Foundation (n.d.)
20IT items produced by Apple, for example, vary other plastic (within the focus of this analysis) that
from 4–5% for a Mac Pro and iMac to 26% of Martinho et al. found in any notable quantity was
the mass of a HomePod (see the environmental PP, in small WEEE devices (20% of total plastic),
report cards at Apple, n.d.a). though some PP (8%) and PVC (4%) were also
In addition to total mass, the types of plastic used found in large cooling appliances. Underscoring
vary significantly between WEEE types. Martinho the challenges of finding representative data, these
et al. (2012) found three-quarters of the plastic figures are starkly different to those for vacuum
used in large cooling appliances to be PS. Perhaps cleaners (37% PP, 11% PVC, 8% HDPE, 44%
illustrating the aesthetic, rather than functional, other) and fridges/freezers, in which 47% of the
nature of plastic in EEE, Figure 6 shows that PS plastic found was PUR (Fiore et al., 2019). It is
was also the dominant plastic used in cathode-ray difficult to reconcile these figures for individual uses
tube (CRT) televisions (85%), but made up just with the global consumption figures presented by
4% of the plastic used in CRT monitors. The only Geyer et al. (2017) (Figure 3).
Figure 5 Mass and proportion of plastics in common waste electrical and electronic equipment
18 60
Average plastic mass per appliance (kg)
Average proportion of plastic (%)
15 50
12 40
9 30
6 20
3 10
0 0
Large cooling Small WEEE Printers Copying equipment Central Monitors/
appliances processing units televisions
Source: Martinho et al. (2012)
Figure 6 Average proportions of plastic types in common waste electrical and electronic equipment
PS PVC PP PE Others
Small WEEE
Central processing units
Copying equipment
Printers
CRT televisions
CRT monitors
Large cooling appliances
0 10 20 30 40 50 60 70 80 90 100
Average proportion of plastic type (%)
Note: CRT, cathode-ray tube.
Source: Martinho et al. (2012)
214 Plastics in the
electrical and electronic
equipment sector in 2050
As outlined in chapter 1, our approach is to use, as global prosperity increases, especially in
compare two possible 2050 scenarios: a BAU the Global South. This corresponds to an annual
scenario and a low-plastic-consumption one. As average growth rate of 3.5%, comprising 4.1%
discussed in more detail in the synthesis report, growth in the Global South and 2.6% in the
we approximate BAU as 3% growth per year. Global North. This is higher than the 3% growth
The low-plastic-consumption scenario is based rate under our BAU scenario, mainly because the
on the 1.5°C-compatible LED scenario published LED scenario projects substantial economic gains
by Grubler et al. (2018). The LED scenario is in low- and middle-income countries, increasing
mainly focused on energy demand, so does not the number of people able to own EEE.
relate directly to all of the SDGs. However, The higher growth rate results in approximately
energy use within the LED scenario surpasses 18% more devices in 2050 than under our BAU.
the relevant Decent Living Standards (Rao and Even so, this figure is assumed to be considerably
Min, 2017).4 lower than it might otherwise be, as it includes
The amount of plastic used by the EEE sector three key emerging trends that reduce rates of
can be approximated by the sector’s activity individual device ownership:
(the amount of new EEE devices) and its plastic
intensity (the amount of new plastic in each new • a shift away from private ownership towards
device). The LED scenario provides a framework appliances as a service, both for domestic
to investigate changes in activity – the demand (such as washing machines in multi-
for the services that plastic materials provide family buildings) and business purposes
compared with the BAU scenario – through (for instance device-as-a-service (DaaS)) (see,
dematerialisation and reuse. We augment this for example, HP, 2019)
with an analysis of reductions in the sector’s • the increased use of cloud computing and
plastic intensity – the potential to fulfil residual virtualisation (accessing hardware and digital
demand for plastic materials with other materials content stored elsewhere, rather than locally
– through substitution. • device consolidation, where multi-function
appliances provide the services previously
4.1 Vision 2050 provided by many others.
The LED scenario projects that the number of The third trend builds on Grubler et al.’s (2018)
electrical devices will more than double between illustration of how smartphones today already
now and 2050, to reach 134 billion appliances in provide the services previously provided by 18
4 Specifically, in terms of shelter, consumer goods, mobility and nutrition. See Supplementary Note 12 in Grubler et al.
(2018) for more.
22individual devices and could include, for example, today. The compositional data for EEE in 2050
integrated home communication, entertainment under the LED scenario (A. Grübler, pers. comm.,
and security systems, or wearable technology 2019) and the average lifespans of different
that integrates communication technology and product groups in use today (Baldé et al., 2017)
health monitoring. yielded a weighted average of approximately five
years. For the scenarios described above, using
4.1.1 Impact on new EEE product sales projections from the LED scenario yielded a
The turnover of products is affected by demand for approximately 26.8 billion new EEE
competing trends. The rise in the shared use of products in 2050, compared with 22.8 billion
EEE would probably increase what might be under BAU (Figure 7).
termed their ‘load factor’, or the proportion of
each day that they are in use. This could have 4.1.2 Reuse and recycling of EEE in 2050
little impact on demand for EEE that is currently The advances in modular, reparable, durable
replaced before the end of its useful life, but designs would also facilitate far higher levels of
where the lifespan of EEE is mainly dependent reuse, thanks to better-developed resale markets
on in-use time (because of wear and tear), the (analogous to reuse in our model, see chapter 1).
lifespan would decrease, as such EEE would wear Based on the expected prevalence of information
more quickly. However, the same trend could and communications technology (ICT) devices
also underpin the purchase of higher quality and in total EEE in 2050 and the world-leading
more robust appliances, which, along with a reuse rates in parts of the ICT sector today (see
modular design revolution that saw a return to chapter 5), we estimate that 25% of global
products that could be easily disassembled and demand for EEE could be met by direct resale or
repaired, would extend their in-use lifetime and reconditioning in 2050.
reduce demand for new products. Recycling rates for the EEE sector in 2050
It is, however, unclear which of these trends would be much higher than those today, as legal
would have the bigger effect, so we assume that regulations around the world created business
average turnover rates are broadly similar to those models that facilitated near-complete recycling of
Figure 7 Demand for electrical and electronic equipment under different scenarios
LED scenario: Global North Global South BAU (3% compound annual growth rate) scenario
30
Electrical and electronic equipment sales (billion units)
20
10
0
2020 2025 2030 2035 2040 2045 2050
Source: Authors, based on data from Grubler et al. (2018)
23WEEE. This would be driven in part by the growth produced. Clear, ambitious and enforced WEEE
of circular material economies more generally, directives would mean that the cost, effort and
and in part by growth in the importance of more infrastructure required to recycle plastic WEEE
localised, on-demand production (for example, would be shared over all EEE materials. New
additive manufacturing or 3D printing for spare recycling routes, processes and benign/inert
parts). Product labelling, similar to that used for materials would overcome current concerns about
energy efficiency and recycling today (Figure 8), the contamination of recycled plastic streams with
would detail the carbon footprint and material additives and other plastics (such as biopolymers).
composition of each EEE device. This increase in Moreover, recycling should be easier in the
visibility of the impact would allow sustainably EEE sector than other sectors. EEE products are
minded consumers to make side-by-side typically made by easily identifiable producers,
comparisons of devices in markets that more fully contain valuable materials sought by recycling
reflected the full costs of ownership or usership schemes and are themselves valuable, making
(for example, resource taxes and a reuse/recycling them less likely to be discarded. Together, these
levy could be factored into the retail price). factors could push plastics recycling in the EEE
A major shift in residual plastic demand sector to the upper limit of that suggested by
would arise from the sector’s step change in Material Economics (2018) (80%).5
the use of recycled materials compared with
the status quo. Much broader and well-funded 4.1.3 High-level impacts on demand for
extended producer responsibility (EPR) schemes plastics
would ensure far higher WEEE collection rates. The consumption of plastics by the EEE sector is
Simplified EEE design, to create more easily a function of the demand for new EEE (activity,
disassembled devices and the prohibition of toxic, in terms of the number of new devices) and the
plastic-deteriorating and non-recyclable additives, plastic intensity of that activity (the amount
would allow better-quality plastic waste to be of plastics used per device). We use these two
Figure 8 Examples of energy and recycling efficiency labelling
Source: Wikipedia images (2010); Fairphone (n.d.b)
5 This figure is just for information. Recycling rates are considered holistically across all sectors in the accompanying
synthesis report.
24aspects to frame our analysis of opportunities to for EEE relates to a shift towards smaller EEE
reduce the consumption of new plastic materials products, especially for households. For example,
by the EEE sector. the shift to more compact homes and offices,
The combined impact of the low-plastics- described in this study’s construction-sector
consumption scenario and dematerialisation report, and the continued emergence of on-
yields annual demand for EEE in 2050 that demand food delivery, as noted in the packaging-
is 191% higher than 2015 levels6 (the latest sector report, could steer consumer demand
available data on sectoral plastics consumption). from larger to smaller refrigerators. In the UK,
Crudely, if the intensity of plastics use in 2015 the total mass of current refrigerator models
continued out to 2050, this would result in an ranges from approximately 15 kg to 75 kg (see,
EEE sector that consumed 46 Mt of plastics for example, Currys PC World, n.d.a; n.d.b). No
in 2050. For comparison, our assumption of data were available on the variation of plastic
annual growth of 3% under a BAU scenario content by size of refrigerator, but assuming this
would result in plastics consumption of 51 Mt in is similar for differently sized options, a shift in
2050 (so, our low-plastics-consumption scenario consumer demand towards the smaller end of
shows a reduction of 12% in demand for plastic the scale would yield a considerable reduction
compared with BAU).7 Again, for comparison, in the quantity of plastic required to provide the
the growth we assume under BAU is considerably same service.
lower than many other short-term market This shift to smaller EEE could also impact
forecasts which, for example, project annual many other appliances and electronics, for
growth of 6.9% in plastics for the EEE industry example replacing wide-screen televisions, which
(Grand View Research, 2017), itself projected to typically weigh over 10 kg, with pocket-size
grow by more than 6% a year over the next five projectors that already weigh as little as 0.25 kg
years (Globe Newswire, 2018). (for example, see Hoffman, 2017) and replacing
In addition to these changes, the low- physical computer input devices with ones based
plastics-consumption scenario offers various on projected images or gestures.
ways in which the intensity of use by the EEE Separately, there appear to be few technical
sector might be decreased, by reducing the barriers to substituting many plastics with other
amount of plastics required to satisfy demand materials. This is already common in market
(dematerialisation by use-efficiency) and segments with higher retail prices. The decision
substitution with other products, both of which to substitute plastics can be for mainly aesthetic
we explore in the following section. reasons to do with consumer taste – for example,
brushed metal and wood are common casing
4.2 Alternative ways of meeting alternatives – or functional reasons – various
plastics demand in 2050 types of steel are used in many commercial EEE
products, as it is considered to be easier to clean
There is evidence to suggest that much of the and more durable. In some cases, a reduction in
remaining demand for plastics in the sector (88% demand for plastic materials may be an outcome
of BAU) could be met using less plastic, or non- of higher recyclability criteria, as already
plastic alternatives. Sometimes these approaches observed for stainless steel, for example (Bakhiyi
cross over – that is, products that deliver the et al., 2018). Additive manufacturing (of which
same service can require fewer materials and can 3D printing is a subset) is a well-established
incorporate alternatives to plastics. process that can create fully customised products
One example of how the 2050 vision could from non-plastic materials, including metals,
lead to a further decrease in demand for plastics ceramics and biomass materials (Thompson
6 This forecast is compiled by backcasting the calculated 2020–2050 growth rates for the 2015–2020 period.
7 This includes the 18% increase compared with BAU from LED-scenario figures and the 25% reduction in demand owing
to reuse (in other words, 118% × (100% – 25%).
25You can also read