Data & Digital Platforms: Driving Tourism Growth in Asia Pacific - SEPTEMBER 2018 - PATA
←
→
Page content transcription
If your browser does not render page correctly, please read the page content below

Data & Digital Platforms:
Driving Tourism Growth in
Asia Pacific

SEPTEMBER 2018       supported by Google
Data & Digital Platforms: Driving
                            Tourism Growth in Asia Pacific

                 A Pacific Asia Travel Association (PATA) and
                                    Oxford Economics Report
                                                        Supported by Google

Disclaimer
All rights reserved. No part of this publication may be reproduced in any form or by any
electronic or mechanical means, including information storage and retrieval systems,
without permission in writing from authorised personnel from Oxford Economics or the
Pacific Asia Travel Association (PATA), except by accredited media who may quote brief
passages in an article with appropriate sourcing to PATA & Oxford Economics.

This publication is intended to provide accurate information and includes material from
sources considered to be reliable. It is provided with the understanding that PATA, a not-
for-profit organisation, and the author are not rendering any professional services,
disclaim any warranty concerning information provided, assume no liability for advertising
claims and reserve the right to accept or reject any advertising.

PATA & Oxford Economics welcome suggestions for corrections or changes. Statements
and opinions expressed in this publication do not necessarily represent those of PATA,
which assumes no responsibility for editorial content.

It should also be recognised that data used within this report were accurate at the time of
compilation, some changes due to revisions and/or changes in collection may have
occurred since publication.

Copyright: Oxford Economics and Pacific Asia Travel Association, Bangkok 2018.

Front cover image is copyright trumzz / Bigstock

ISBN: 1-932171-96-7
TABLE OF CONTENTS
                          Foreword           ............................................................................................................. 4
                          Executive Summary ................................................................................................. 5
                          2.                 The Asia Pacific Tourism Sector........................................................ 10
                               2.1           Current Tourism Sector Size ............................................................. 10
                               2.2           Total Tourism Spending ..................................................................... 12
                               2.3           Economic Contribution of Tourism..................................................... 13
                               2.4           Tourism Growth Trends ..................................................................... 15
                          3.                 Online Activity & Digital Platforms ..................................................... 18
                               3.1           Internet Penetration Remains Low in Asia Pacific ............................. 18
                               3.2           Travel is Organised Online ................................................................ 21
                               3.3           Platforms Facilitate Online Travel Behaviour .................................... 23
                          4.                 Data Innovation .................................................................................. 28
                               4.1           Digital Data as a Vital Resource for Innovation ................................. 28
                               4.2           Business Benefits of Innovation......................................................... 32
                               4.3           Consumer Benefits of Innovation....................................................... 34
                               4.4           Destination Benefits of Innovation ..................................................... 35
                          5.                 The Growth Opportunity .................................................................... 37
                               5.1           Digital Opportunity by Destination ..................................................... 37
                               5.2           The Importance of Data Innovation for Growth ................................. 40
                               5.3           Opportunity for GDP and Employment .............................................. 42
                          6.                 Conclusions & Policy Recommendations .......................................... 45
                          Definitions & Acronyms .......................................................................................... 52
                          Appendix 1: Case Study Details ............................................................................. 53
                               Airbnb        ........................................................................................................... 53
                               Grab          ........................................................................................................... 54
                               Klook         ........................................................................................................... 56
                               Mekong Tourism ............................................................................................... 57
                               The Road Trip ................................................................................................... 59
                               Yanolja       ........................................................................................................... 61
                          Appendix 2: Destination Summaries ...................................................................... 63

Data & Digital Platforms: Driving Tourism Growth in Asia Pacific                                                                                         3
FOREWORD
Dr. Mario Hardy, CEO, Pacific Asia Travel Association
Technology is the driving force behind many of the innovations that are
affecting various aspects of today’s world. As we move towards an exponential
future, these innovations are now characterised by their velocity, speed of
development and the impact that they are having – and will have – on existing
systems.
Recent technological advances offer significant potential for the travel and
tourism industry and knowing how to navigate this new landscape is crucial as
consumers find new avenues online to be inspired and plan their trips. In
addition, the ever-increasing use and accessibility of smart phones, apps,
wearables, and payment platforms, as well as new software, only adds to the
many challenges ahead.
How do travel and tourism organisations leverage current advancements to
differentiate themselves from their competitors and become successful in
today’s environment?
To provide a one-step solution would be virtually impossible, as new
technologies emerge daily and new businesses launch products and services
that are reshaping the industry and disrupting traditional models.
It is essential that organisations obtain a thorough understanding of current
technologies and innovations to make smarter and more informed decisions.
This comprehensive report on digital platforms and data driven innovation
provides important insight into the need in embracing the technological
changes and developing a growth mindset.
Even as the growth momentum of Asia Pacific is set to continue over the next
five years, the growth in international arrivals across Asia Pacific is often
unequal with subtle changes and shifts occurring as travellers discover new
destinations and increasingly turn away from those that do not offer the
experiences and memories that they seek and demand. Organisation can
adapt and stay ahead of these changes through the proper collection and
analysis of data and the informed use of available digital platforms.
As the Pacific Asia Travel Association (PATA) acts as a catalyst for the
responsible development of travel and tourism to, from and within the Asia
Pacific region, we understand that adopting policies to support a thriving digital
ecosystem can only be achieved through the concerted efforts of the private
and public sector working together to enhance access to digital products and
services and facilitate cross-border data flows.
This report lays the foundation towards this goal and should be shared with all
travel and tourism stakeholders in order to maximise the full potential of the
opportunities available.
Data & Digital Platforms: Driving Tourism Growth in Asia Pacific 4EXECUTIVE SUMMARY
Destinations in the Asia Pacific region can maximise tourism growth, and in
turn job creation, by expanding their online presence. As travellers organise
Large growth
trips online more frequently, destination management organisations and
opportunities exist from an businesses should leverage available tools and digital platforms to engage with
embrace of digital them throughout the planning process. Data generated by online interactions
interactions. can be leveraged to further drive innovation and growth. There are
opportunities to generate over 9 million new jobs in the region. This would
stimulate GDP growth by up to an additional 1% destination-by-destination with
an average 5% rise in the Travel & Tourism sector.
TOURISM DRIVES GROWTH IN ASIA PACIFIC
1 in 11 jobs in Asia Pacific Tourism is a large and rapidly growing sector across the Asia Pacific region.
are supported by the Currently, the sector supports 181 million jobs, or roughly 1 in 11 of all jobs,
according to research by WTTC & Oxford Economics1.
rapidly growing tourism
sector. The sector has grown in importance by outpacing wider activity in recent years.
GDP generated by Travel & Tourism grew at an average annual rate of 7.3%
over the past five years, compared to economy-wide GDP growth for the region
of 4.2% (in constant price terms).
Growth is driven by a range of factors including rising wealth in key source
markets, increased air connectivity to both short- and long-haul markets, as
well as improving digital connectivity. This report focuses on 12 destinations
across the Asia Pacific region with a wide range of sector performances and
digital behaviours, all of which can benefit from continued tourism growth.
Digital Travel Footprint
% tourism organised online by destination, 2018 estimate
100%
90%
80%
62%-92% travel is 70%
60%
researched or booked 50%
online: access constraints 40%
30%
partly explain this 20%
difference. 10%
0%
Source: Tourism Economics
1 Tourism impacts are measured as the direct impacts for all tourism-facing businesses, plus wider impacts arising along the
supply chain and due to spending of wages. Direct impacts include those for traditional tourism businesses as well as for new
innovative tourism businesses, such as Airbnb and other new accommodation providers, plus ride-sharing providers.
Data & Digital Platforms: Driving Tourism Growth in Asia Pacific 5TRAVELLERS HAVE BECOME DIGITAL
Around 80% of global travel is reliant on online research2, and according to
80% of travel is organised Tourism Economics estimates, reliance is similar across the Asia Pacific
online in Asia Pacific and region. As economic development and travel continue to grow alongside
worldwide: this is despite greater internet penetration, the importance of digital research will only
lower internet penetration increase.
in the region at 48% Utilisation of online travel research is high despite relatively low internet
compared with 62% for penetration in the region. Currently, only 48% of the population in the region
the rest of the world. has access to the internet, compared to 62% of the population of the rest of the
world3.
Between 62% and 92% of travel to 12 key Asia Pacific destinations, from
origins worldwide, are estimated to be currently organised online.
Discrepancies in reliable broadband access are partially responsible for this
disparity, while prohibitively high costs are an issue for some more remote
areas. Broadband costs are up to 18% of average income, well above the
target of 5% set by the UNESCO Broadband Commission 4.
TRAVELLERS MAKE MORE INFORMED DECISIONS
Digital travel planning
takes place over a 3- Due to a wealth of information available through digital sources, travellers are
month period, involving a more informed throughout the planning process than ever before. Planning for
the average trip occurs over a period of almost 3 months5, including over 250
wealth of information and
unique research moments in some instances6.
over 250 online searches.
Additionally, travellers continue to visit travel sites beyond the initial planning
and booking period for research on destinations and attractions, including once
they have arrived at their destination and even afterwards. Almost 70% of
travellers share their experiences online 7.
Hence, there are opportunities for businesses and destination management
organisations to engage with travellers throughout all five stages of the
planning process.
DATA INNOVATION SUPPORTS GROWTH
Data innovation drives 5- Digital interactions throughout the planning process create data which enable
10% increase in businesses and destinations to better understand traveller needs. For example,
productivity growth. The Road Trip in New Zealand has successfully invested in analytics to better
understand and reach potential customers. The examples of Grab and Airbnb
demonstrate clear benefits to performance by employing machine learning to
better meet demand.
Data are an integral element for driving business performance through
technological development and global market connectivity. Productivity growth
2 Visa Global Travel Intentions Study, 2018
3 Internet world stats
4Internet Society, Mobile Internet Usage Trends in Asia Pacific, 2016
5 Worldwide Travel Path to Purchase, TripAdvisor, 2017
6 GfK & Google research for Australia, 2018
7 Visa Global Travel Intentions Study 2018
Data & Digital Platforms: Driving Tourism Growth in Asia Pacific 6is fostered by opening avenues to new domestic and international markets. The
Data are a key part of OECD notes that “data-analytics is increasingly driving innovation.” Productivity
digital innovation which can be 5-10% higher for businesses which innovate with data8.
should be employed to
The benefits of data innovation are particularly clear for tourism due to the
support growth.
importance of demand from international markets. Better knowledge of traveller
needs from both short- and long-haul source markets can improve targeted
advertising as well as focused product innovation.
As the costs of data storage and processing fall, smaller businesses can take
advantage of these benefits and compete more effectively with larger players in
domestic and international markets. However, the OECD notes that most
businesses outside of the ICT sector are not fully taking advantage of these
benefits due to data management skills shortages.
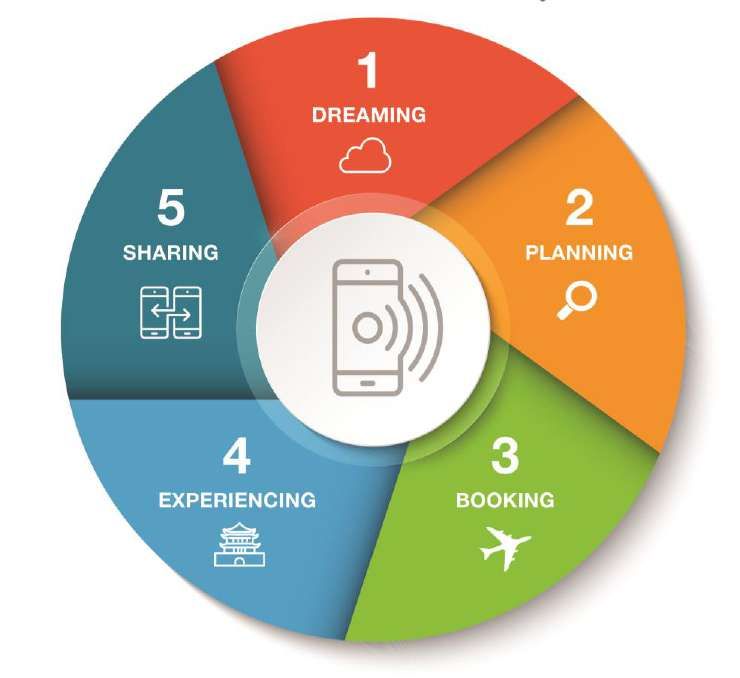
Platforms support the digital ecosystem throughout the Five Stages of
Travel Planning and generate usable data to support growth
Digital platforms are at the
heart of all online
interactions throughout
the travel planning
process, generating
usable data to support
growth.
• Dreaming: travellers identify aspirational destinations for future trips
• Planning: active research as options are narrowed
• Booking: time and cost savings ensure a greater likelihood of booking
• Experiencing: travellers optimise trips by accessing digital information,
including mobile apps
• Sharing: experiences are shared during and after trips to inspire other
travellers
8 OECD, Data-driven innovation for growth and well-being, 2015
Data & Digital Platforms: Driving Tourism Growth in Asia Pacific 7DIGITAL PLATFORMS MAXIMISE ECOSYSTEM BENEFITS
Travellers rely on platforms to provide them with information throughout all
Platforms facilitate online stages of travel planning. They can benefit from better informed decisions and
interactions between are increasingly taking research tools with them as a result. Around 61% of
travellers download travel apps before trips9 and 87% of millennials said their
travellers and businesses:
smartphone was their most essential travel item10.
87% millennials consider
their smartphone to be the Shared experiences can reach and inspire new travellers. For example, the
most important travel item. Mekong Moments programme is turning social media traffic into a commercial
platform for destinations in the Mekong River basin.
Businesses, including SMEs, can more easily reach potential travellers in both
domestic and international markets. In turn, they have experienced positive
impacts on sales. For example, Klook was developed to connect travellers with
a wide range of travel businesses within Asia Pacific destinations, and it is now
the largest booking platform in the region.
Destinations benefit from sustainable growth in GDP and employment as well
as improved visitor management, including the ability to direct visitors to
secondary destinations, widening benefits and reducing overcrowding.
OPPORTUNITIES FOR GROWTH
Over 9 million new jobs Asia Pacific destinations have gained market share by embracing digital
content to meet demand in source markets. This has produced an average
can be generated from
annual growth premium for international arrivals of 1% over the past five years.
digital travel across 12 key
Asia Pacific destinations. Growth in the coming years will be maximised by continuing to adopt best
practices for using data and digital platforms. There is an opportunity for an
estimated average 5% additional growth, and up to 8% destination-specific
growth, in sector GDP over the next five years. This is equivalent to a 0.5%
growth premium for overall GDP on average, and up to 1.0% by destination.
This would entail the creation of over 9 million new jobs over the next five
years.
Incremental Digital Tourism Opportunity GDP Growth Opportunity
000s new jobs from data and digital platforms over expected baseline % growth over baseline expectation, 2023
growth, 2023 Japan
6,000 5,333 Philippines
Total
5,000 Chinese Taipei
Direct Republic of Korea
4,000
3,000 Hong Kong SAR
2,087 New Zealand
2,000
Thailand
617
1,000 115 266 22 52 24 23 323 101 367 Indonesia
0 India
China
Australia
Vietnam
0.0% 0.2% 0.4% 0.6% 0.8% 1.0% 1.2%
Source: Tourism Economics Source: Tourism Economics
9 Visa Global Travel Intentions Study, 2018
10 PATA Youth Travel Report: Stepping Out of the Crowd, 2016
Data & Digital Platforms: Driving Tourism Growth in Asia Pacific 8RECOMMENDATIONS FOR POLICY MAKERS IN ASIA PACIFIC
• Digital network:
Continue to invest in high-speed internet to ensure availability for travellers, the resident
population and local businesses. In both India and Indonesia, only 22% of households have
access to reliable internet11, and the proportion of the population covered by a mobile
network is also lower than average (93% in India and 95% in Indonesia compared with a
global average of 98%12). Travellers are less able to leverage platforms to access
information when visiting these destinations.
Encouraging service providers to extend their reach into new regions can stimulate
investment in digital networks13 and can allow travellers to access consistent and reliable
platforms regardless of their destination.
• Digital skills:
Address skills shortages in data management, especially among SMEs, to ensure that they
can compete effectively with larger businesses in international markets and take advantage
of affordable digital technology.
Equip tourism businesses with best practices for reaching their audience, including
translation of relevant content into key languages, and the means to better understand
potential travellers. Governments should consider appointing a Chief Data Adviser.
• Facilitate data innovation:
Develop policies that facilitate the use of data as a vital resource to drive productivity and
tourism growth. An average increase in productivity of 5-10% has been identified for
businesses which innovate with data14. By contrast, according to research by Bauer et al 15,
the imposition of data localisation measures in Asia Pacific destinations would reduce GDP
across a range of economies: from -0.1% in India up to -1.7% in Vietnam.
Destinations can also benefit from sustainable market development as efforts can be made
to smooth demand flows across a wider area and timeframe with a better understanding of
demand patterns.
• Support a thriving digital ecosystem
Encourage destination management organisations and businesses to leverage the best
available tools to engage with tourists throughout the planning process and encourage
traveller feedback through reviews and social media. For example, one fifth of millennials
surveyed in a PATA report were directly inspired in making travel choices by what their
friends posted on social media16.
Maintain a policy framework that promotes innovation and allows competition between small
local businesses and global players. Benefits are evident for both travellers and local
businesses alike under these conditions.
11 World Bank, World Development Indicators
12 World Economic Forum, Travel & Tourism Competitiveness Report 2017
13 Brookings Global Economy and Development, Regulating for a Digital Economy, 2018
14 OECD, Data-driven innovation for growth and innovation, 2015
15 Bauer, Lee-Makiyama, van der Marel, Verschelde, The Costs of Data Localisation, 2014
16 PATA Youth Travel Report: Stepping Out of the Crowd, 2016
Data & Digital Platforms: Driving Tourism Growth in Asia Pacific 92. THE ASIA PACIFIC TOURISM
SECTOR
KEY POINTS
• Tourism is a key sector in the Asia Pacific region, supporting 180 million jobs in the
region, equivalent to 1 in 11 of all jobs.
• GDP generated by Travel & Tourism has grown by 7.3% on average relative to 4.2%
growth in the wider economy.
• International tourism arrivals in APAC destinations have grown faster than all other
world regions over the past decade.
• Short-haul travel, from source markets within the Asia Pacific region, has outpaced
long-haul travel demand growth over the 2007-17 period, growing by a cumulative
83%. However, long-haul demand remains important and will be supported by
developing connectivity.
• Asia Pacific destinations have gained market share, aided by gains in digital
connectivity.
2.1 CURRENT TOURISM SECTOR SIZE
Inbound tourism arrivals in APAC reached 317 million in 2017, up from 180
million a decade before. International tourism arrivals in APAC destinations
have grown faster than in any other world region over the past decade.
Between 2007 and 2017, arrivals grew 76%, an average annual growth rate of
Inbound tourism arrivals in
5.8%. This is a full 2 percentage points higher than the equivalent average rate
APAC reached 317 million
of world travel growth over the same period.
in 2017, up from 180
million a decade before Inbound Tourism Growth by Region
Index, 2007=100
180
170 World
APAC
160 Europe
150 Americas
MEA
140
130
120
110
100
90
2007 2009 2011 2013 2015 2017
Source: Tourism Economics
Data & Digital Platforms: Driving Tourism Growth in Asia Pacific 10Short-haul travel, from source markets within the Asia Pacific region, accounts
Short-haul travel accounts for almost four-fifths of international arrivals. Of the total number of trips to Asia
for around four-fifths of Pacific destinations, 251 million were from short-haul markets.
international travel to Asia
International Tourist Arrivals to APAC, Short- vs. Long-haul
Pacific destinations.
Arrivals, mn
350
300 Long-haul Short-haul
250
200
150
100
50
0
2007 2008 2009 2010 2011 2012 2013 2014 2015 2016 2017
Source: Tourism Economics
China welcomed 61 China welcomed 61 million international tourist arrivals in 2017, more than any
million international of the other Asia Pacific destinations in this study. Of these arrivals, 85% were
tourists in 2017 as the from short-haul markets (including the large volumes of travel from Hong Kong
SAR and Macao as short-haul international travel is in line with published
largest destination in the
national statistics). China received the second largest volume of long-haul
region.
arrivals (9.3 million), although they only accounted for around 15% of all travel.
Thailand is the second largest select destination market in APAC with 36
million arrivals in 2017, 74% of which came from short-haul markets.
International Tourist Arrivals to Select APAC Destinations
Arrivals, mn, 2017
70
60
Long-haul Short-haul
50
40
30
20
10
0
India receives the largest
number of long-haul Source: Tourism Economics
arrivals in absolute and
proportional terms. India received 12 million arrivals from long-haul source markets in 2017: more
than any other market considered here. This represented 73% of its almost 17
million total visitor arrivals. India is the only destination to attract more than half
of its visitors from beyond the region. The five largest source markets for India
arrivals include the long-haul markets of the USA, the UK and Canada, plus
Data & Digital Platforms: Driving Tourism Growth in Asia Pacific 11Bangladesh and Sri Lanka. When taking average length of stay into account,
the importance of these long-haul markets is accentuated further. Germany,
France and the Russian Federation are all larger than Sri Lanka as source
markets when measured in terms of nights spent within India.
Vietnam received the lowest volume of arrivals from long-haul markets among
these destinations. The proportion of arrivals from long-haul markets was also
the lowest accounting for only 4% of total demand.
Chinese Taipei and Hong Kong SAR also receive a low proportion of visits from
beyond the region, just 11% and 12%, respectively. Travel from China is
counted as part of short-haul international travel, consistent with national data
sources.
2.2 TOTAL TOURISM SPENDING
Tourist activity in the region generates large revenues for businesses, tax
revenue for governments, and increased employment. The large domestic
travel markets must also be considered for a complete view of the impact of
tourism by destination. In many Asia Pacific destinations the number of
domestic overnights dwarfs the number of international overnights.
Domestic overnights represent around 90% Chinese travel and totalled 2.4
Domestic travel demand billion in 2017, dwarfing the 295 million international overnights. Domestic
exceeds international demand comprised a similar proportion of total tourism spending in China.
travel in most
Domestic travel is also important in Japan, accounting for almost 85% of travel
destinations, but is less
demand, with 435 million domestic overnights in 2017, compared to just 84.6
dynamic.
million international overnights. This is the destination with the second largest
share of domestic demand within the region after China.
Tourism Spend in Select APAC Destinations, Domestic vs. International
US$ bn, 2017
250
838 Domestic International
200
150
100
50
0
Source: Tourism Economics
International travel volume surpasses domestic volume only in Hong Kong SAR
and Chinese Taipei, helped by the large influence of travellers from Mainland
China which are counted as international in official statistics.
Data & Digital Platforms: Driving Tourism Growth in Asia Pacific 12The bulk of tourism spending across the region is generated by leisure
travellers, according to the WTTC annual economic impact research, carried
Leisure travel generates out in conjunction with Oxford Economics. Japan and the Republic of Korea
the bulk of activity across have the highest proportion of revenue generated by business travel at 32%
the region. and 34%, respectively. In China, just 20% of spending was business travel
related.
India has the smallest business travel segment, accounting for only 6% of all
travel and tourism spend in 2017. The business market in Chinese Taipei was
also relatively small (in both share and in absolute terms), accounting for just
10% of its total travel and tourism spend of US$17.4 billion. In Australia, the
business share was also relatively small, accounting for just 12% of its total
travel and tourism spend of US$24.9 billion in 2017.
2.3 ECONOMIC CONTRIBUTION OF TOURISM
To assess the true value of the Travel & Tourism sector for Asia Pacific
economies, it is crucial to consider direct, indirect, and induced effects. The
direct benefit of spending by tourists is mapped to GDP by counting only the
value-added components. This includes the revenue, profit and value-added for
traditional providers of tourism services such as hotels and airlines, as well as
Travel & Tourism supports
new service providers that are powered by digital platforms, such as Airbnb,
9.8% of whole economy
Uber, and Grab.
GDP taking wider impacts
into account. Wider Travel & Tourism impacts include the indirect benefits throughout the
supply chain and the induced impacts of consumption from wage income
effects.
The Travel & Tourism sector has a significant impact on GDP in the APAC
region. The sector directly generates 3.3% of total GDP and supports 9.8% of
total GDP including indirect and induced impacts, according to prior Oxford
Economics analysis on behalf of the World Travel & Tourism Council (WTTC).
Contribution of T&T to GDP in Select APAC Destinations
Chinese Taipei
Republic of Korea
Indonesia Direct Total
Japan
Vietnam
India
APAC
Australia
China
Hong Kong SAR
New Zealand
Sector importance ranges Thailand
from 4.4% GDP in Philippines
Chinese Taipei up to 0 5 10 15 20 25
21.6% GDP in the Source: WTTC, Oxford Economics % whole economy GDP, 2017
Philippines.
Within the Asia Pacific region, Travel & Tourism makes the largest contribution
to whole economy GDP in the Philippines. The direct impact in 2017 was 8.8%
Data & Digital Platforms: Driving Tourism Growth in Asia Pacific 13of total GDP and including indirect and induced effects the impact was 21.5%.
Thailand’s whole economy GDP is also heavily supported by the presence of a
thriving Travel and Tourism sector. In 2017, it directly accounted for 9.5% of
whole economy GDP, and 21.4% in total including indirect and induced
impacts.
9.4% employment is In absolute terms, these impacts were largest in China, where direct Travel &
supported by tourism Tourism impacts totalled US$405 billion in 2017, or US$1,355 billion including
indirect and induced impacts.
activity, equivalent to 1 in
every 11 jobs. Contribution of T&T to Employment in Select APAC Destinations
Republic of Korea
Chinese Taipei
Japan Direct Total
Vietnam
India
APAC
Indonesia
China
Australia
Hong Kong SAR
Thailand
Philippines
New Zealand
0 5 10 15 20 25
Source: WTTC, Oxford Economics % whole economy employment, 2017
Travel & Tourism also supports a comparable proportion of employment within
the region. On average, 4.0% of APAC employment is directly generated by the
sector. In total, 9.4% of all jobs are supported by the sector, equivalent to 1 in
11 of all jobs. Development in the Travel & Tourism is an important tool for job
Travel & Tourism supports creation.
over 180 million jobs in
Tourism activity provides the highest proportion of support to a labour market in
the region. New Zealand – 22% of all jobs are supported by Travel & Tourism activity.
Contribution of T&T to Employment in Select APAC Destinations
New Zealand Direct Total
Hong Kong SAR
Chinese Taipei
Republic of Korea
Australia
Vietnam
Japan
Thailand
Philippines
Indonesia
India
China
0 20 40 60 80
Source: WTTC, Oxford Economics Workers mn, contribution, 2017
Data & Digital Platforms: Driving Tourism Growth in Asia Pacific 14Overall, Travel & Tourism supports over 180 million jobs in the region, 80
million of which are within China. Travel & Tourism also supports over 40
million jobs in India and directly employed 26.1 million workers in 2017.
2.4 TOURISM GROWTH TRENDS
International tourist arrivals growth over the past ten years was strongest in
Chinese Taipei out of the destinations under consideration, with average
International arrivals grew annual growth in arrivals of 13.8%.
at an average annual rate
of 6% over the past ten International Arrivals Growth to Select APAC Destinations, 2007-17
years. % CAGR
14%
12%
10%
8%
6%
4%
2%
0%
Source: Tourism Economics
Japan also saw strong growth over the period, with international tourist arrivals
growing on average 13.1% per year. This was due to exceptional growth in the
last five years following relative stagnation in prior years. Crucial to this growth
was the relative weakening of the yen and an ability to attract ever greater
numbers of Chinese visitors.
Despite the large size of the market, international travel to China grew just
1.1% on average per year over the ten-year period. This was the weakest
growth of international tourist arrivals across all selected destinations.
Short-haul travel has Short-haul travel from source markets within the Asia Pacific region has
outpaced long-haul travel demand, growing at an average annual rate of 6.2%.
outpaced demand from
This has resulted in cumulative growth of 83% over the past 10 years.
long-haul markets to Asia
Pacific. This expansion is related to rapidly rising income levels within the regions’
developing economies, which has led to the formation of millions of new
middle-income households with a complementary appetite for international
travel. This is particularly notable in China where an estimated quarter of all
households earn above the threshold value at which travel is affordable. Ten
years ago, fewer than 10% of households could afford travel. However,
according to the China Tourism Academy, only around 10% of the Chinese
population hold passports and in comments made by Dai Bin, head of the CTA,
“overseas travel has not yet become a national trend”17.
17 PATA Youth Travel Report: Stepping Out of the Crowd, 2016
Data & Digital Platforms: Driving Tourism Growth in Asia Pacific 15Growth in Middle-Class Households in Select APAC Destinations
Continued growth in % households, 2007 vs. 2017 (mn households at top)
middle class household
9 48 2 7 17 2 108 9 2 2 23 1
formation will continue to 100%
support short-haul travel. 80% 2017
60% 2007
40%
20%
0%
Source: Tourism Economics
The size of the global middle class is forecast to increase from 1.8 billion to 4.9
billion by 2030 and 85% of this growth will come from Asia18. This will continue
to support intraregional demand and growth in the Asia Pacific region will again
outpace other world regions.
Arrivals from Europe grew Long-haul demand growth of 54% over the past ten years should not be
50%, from the Americas discounted. Over the 2007-17 period, arrivals to APAC destinations from
60% and from MEA 59% Europe grew 50% (4.2% CAGR), arrivals from the Americas grew 60% (4.8%
over 2007-17. CAGR), and arrivals from MEA source markets grew 59% (4.8% CAGR).
Continued expansion in both physical and digital connectivity will support
further growth.
Arrivals Growth Decomposition: 2013-18
Other market share shifts
CAGR: split by main drivers
24% Price competitiveness
25%
Source market growth
20%
15% 12% 11%
10% 2%
7% 8% 8% 7%
10% 4% 7%
5% 3%
0%
-5%
-10%
Source: Tourism Economics
Arrivals growth over the past five years has been compared against key drivers
in Tourism Economics’ modelling to understand the relative importance of
different factors in explaining growth. Economic drivers and outbound demand
18 PATA Youth Travel Report: Stepping Out of the Crowd, 2016
Data & Digital Platforms: Driving Tourism Growth in Asia Pacific 16growth from source markets comprise roughly four-fifths of the growth across
the region on average, although there is significant variation by destination.
Market share gains Faster or slower growth than that dictated by source market developments
explain one-fifth of recent involves shifts in market share. The shifts are typically due to price
growth for Asia Pacific competitiveness; more facilitative travel policy (including changes in visa
destinations; aided by regimes or marketing); developments in connectivity; or the impact of natural or
digital connectivity. geopolitical events. The Republic of Korea and Hong Kong SAR lost market
share over this period due to geopolitical developments that caused travellers
from some key source markets to stay away.
Both physical and digital connectivity are important factors for accessing new
source markets and greater use of digital resources to reach potential travellers
can boost growth. Physical connectivity, including the rise of Low Cost Carriers,
explains a proportion of the growth observed across the region. Digital
connectivity is becoming increasingly important as a driver of growth.
APAC GDP Growth, Whole Economy vs. T&T
Index, 2007=100
230
Whole Economy GDP
210
Travel & Tourism GDP
190
170
150
130
110
90
GDP generated by Travel 2007 2009 2011 2013 2015 2017
& Tourism has grown at Source: Tourism Economics
an average annual rate of
7.3%, outpacing the wider Unsurprisingly, GDP generated by the Travel & Tourism sector has outpaced
advances in the wider economy over recent years, albeit by a lesser amount
economy which grew just
than international growth since domestic demand growth has been slower.
4.2%.
Over the past ten years, the GDP contribution of Travel & Tourism in the region
grew at an average annual rate of 7.3% compared with 4.2% growth in whole
economy GDP.
Data & Digital Platforms: Driving Tourism Growth in Asia Pacific 173. ONLINE ACTIVITY & DIGITAL
PLATFORMS
KEY POINTS
• Internet penetration in the Asia Pacific region is 48%, which is lower than in the rest of
the world on average. Internet speeds also vary markedly across destinations and high
costs are evident in some regions.
• Mobile connectivity varies, which can affect day-to-day behaviour and mobile use
within foreign destinations.
• Online travel planning and booking is widespread in the Asia Pacific region, with a high
digital footprint. 80% travel is organised online.
• It is essential that platform use by businesses and destination management
organisations matches source market preferences, including the rise of mobile access.
• Continued investment in digital networking is essential to realise growth opportunities.
3.1 INTERNET PENETRATION REMAINS LOW IN ASIA PACIFIC
Internet penetration in the Asia Pacific region is lower than in the rest of world.
On average, 48% of the population in the Asia Pacific region has access to the
internet, compared with 62% of the population of the rest of the world 19.
Penetration is much higher in developed regions such as North America and
Western Europe and only Africa has lower internet penetration. Despite this,
the Asia Pacific region accounts for nearly half of the world’s internet users.
Asia Pacific internet
penetration rate is lower Internet Penetration by Destination
than in the rest of the % households with online access, 2017
100 93 93
world, at 48%. 87 88 89
82
77
80 66
63
60 53 55
40 34
20
0
Source: Internet World Stats, Oxford Economics
19 Internet world stats
Data & Digital Platforms: Driving Tourism Growth in Asia Pacific 18However, the overall figures for the region conceal wide variation among
Internet access varies by destinations. In advanced economies, such as Japan and the Republic of
destination, related to Korea, penetration is over 90%. By contrast, in less developed economies,
economic development. such as India, penetration is as low as 34%.
Around 2.3 billion people in the region are still without regular access to the
internet, two-thirds of which are in India (0.89 billion) and China (0.64 billion).
There remains significant potential for future growth in connectivity and
associated benefits.
Household Income & Internet Penetration
Internet penetration (%) Republic of
100 Korea Japan
90 Thailand
Hong Kong SAR
New Zealand
80 Chinese Taipei
Vietnam Australia
70
Philippines
60
Indonesia China
50
40 India
30
0 20 40 60 80 100
Middle class households
Source: Internet World Stats, Oxford Economics (% earning over US$20,000)
Wealthier economies are
Wealthier destinations are more likely to be online. There is a clear correlation
more likely to be online, between internet penetration and average income, defined as the proportion of
and as economic middle class households able to afford travel. A threshold value of US$20,000
development continues, has been identified as an indicator of middle-class household income at which
the importance of digital point travel (domestic and international) becomes affordable.
travel will grow.
Internet Penetration & Average Connection Speed Republic of
Mbps Korea
30
25 Hong Kong SAR
Japan
20
Thailand
Chinese Taipei
15
Australia
Vietnam New Zealand
10 India Indonesia
China
5 Philippines
Access speed is related to 0
market development, but 30 40 50 60 70 80 90 100
Source: Internet World Stats, Akamai Internet penetration (%)
may be a constraint to
traveller activity. Internet speed also varies by destination, and unsurprisingly the most
connected destinations also enjoy higher internet speeds. Slower internet
speeds are an inconvenience to residents and affect businesses’ ability to
embrace new digital platforms and strategies for reaching customers. Crucially,
Data & Digital Platforms: Driving Tourism Growth in Asia Pacific 19internet speed may also impede travellers as they attempt to access trusted
platforms on mobile devices.
The Philippines, for example, has relatively high penetration, as over 60% of
High costs in the households have access to the internet, but average speeds are among the
Philippines, Vietnam and slowest in the region at 5.5 Mbps. Its average peak connection speed of 45.0
Indonesia are a potential Mbps is comparable only with India and China in the region. President Duterte
barrier to growth. has approved a plan to deploy a national broadband network, to host a national
portal, and to connect more remote areas of the country20.
Even when broadband is available, the costs can be prohibitively high for
businesses. This is particularly the case in landlocked Asian countries and
small island states in the Pacific, where broadband can be up to 18% of the
monthly average gross national income – much higher than the UNESCO
Broadband Commission’s target of 5%21. There is an apparent correlation
between average broadband costs and national income, but there are also
significant outliers.
Household Income & Average Broadband Cost
Middle class households (% earning over US$20,000)
Australia
100 Chinese Taipei Japan New Zealand
Republic of
80 Hong Kong SAR
Korea
60
40
China
Thailand Philippines Indonesia
20 India
Vietnam
0
20 30 40 50 60 70 80
Source: BDRC Continental & Cable, Oxford Economics Cost of broadband (US$/month)
Chinese Taipei and the Republic of Korea have particularly low costs relative to
average incomes while residents are overwhelmingly online with high
connection speeds.
Indonesia, the Philippines, Vietnam and India have particularly high costs
relative to average incomes, which may partly explain the relatively low
connectivity in these countries.
Investment in digital
networks is essential to By continuing to invest in digital networks, the number of people connected to
realise benefits of online the internet and connection speeds will increase and costs should fall. This will
interactions. allow destinations to realise further benefits of digital interactions. By 2021,
according to the CISCO VNI forecast22, 62% of the Asia Pacific region’s
population will be using the internet at an average speed of 64 Mbps. This will
be faster than the global average connection speed and will entail 2.9
20 Akamai’s State of the Internet Q1 2017 report
21 Internet Society, Mobile Internet Usage Trends in Asia Pacific, 2016
22 CISCO Complete Visual Networking Index Forecast, 2017
Data & Digital Platforms: Driving Tourism Growth in Asia Pacific 20networked devices per individual. Under these projections, the Asia Pacific
region will represent almost 40% of all data traffic, up from 35% just five years
earlier. Mobile connections will account for the bulk of the growth. In a survey
The use of mobile devices
by the Internet Society, 47% of respondents use a mobile device as their
will account for the bulk of
primary means of going online. This figure is higher among respondents below
growth in data traffic. 25 years old (61%), and those who live in South East Asia (52%). This is a
case of leapfrogging, whereby those in developing economies have moved
straight to mobile devices rather than following the established technology
adoption taken by more developed nations.
CISCO VNI monthly data traffic forecast by region
Exabytes / month
300
MEA
250 Europe
Americas
200
APAC
150
100
50
0
2016 2020
Source: CISCO, Tourism Economics
3.2 TRAVEL IS ORGANISED ONLINE
Low internet penetration in a destination does not necessarily mean that its
residents are less likely to organise travel online. India is the highest ranked
Low internet penetration digitally dependent traveller-nation, followed by China and Indonesia23,
does not necessarily imply according to a study across 19 destinations by Travelport.
residents are less likely to Travel Share of Accessed Sites & Average Connection Speed
Travel site share of unique visits (%)
organise travel online. 80
Chinese Taipei
70 Republic of
New Zealand
60 Hong Kong SAR Korea
Australia
50 Indonesia
India Japan
40 China Thailand
30 Vietnam
20 Philippines
10
0
0 5 10 15 20 25 30
Mbps
Source: Akamai, comScore*, Oxford Economics
* data available for 9 destinations. Estimates included for the Philippines, the Republic of Korea and New Zealand
23 Travelport, Digital Traveller Survey, 2017
Data & Digital Platforms: Driving Tourism Growth in Asia Pacific 21The internet is a trusted data source in the Asia Pacific region and travel is
already widely organised online. Across the region, 30% of those with internet
access regularly visit travel sites. This proportion rises in line with internet
penetration and average access speeds across destinations.
Online travel research and booking is apparently a function of the online market
Online platforms are trusted maturity within an economy. As online interactions become more reliable and
sources for travel research. more trusted, a greater proportion of travel activity will move online. Tourism
Use of offline sources fell typically involves greater research than other consumer products because the
from 82% to 47% in 2017. nature of travel requires a financial investment without any ability to ‘pre-test’
the product. Recommendations from friends and relatives have traditionally
been the most trusted source of information among travellers. The rise of social
media means such interactions are increasingly moving online. Online tourism
research is facilitated by digital interactions and a range of trusted and
specialist platforms.
The proportion of travel organised online has already risen sharply, as the
share of travellers using offline sources of information for trip planning fell from
82% in 2015 to 47% in 201724. Asian travellers are the least likely to use offline
methods to book accommodation.
However, the proportion of tourism activity organised online does not match
source market demand in all cases. Destinations and businesses must
understand and embrace the online preferences of key source markets to
Over 70% of APAC
maximise the efficiency of online interactions.
millennial travellers made
bookings for transport and There is also considerable variation in internet travel behaviour by age cohort,
accommodation online. with younger travellers viewing it as the norm. Over 70% of APAC millennial
travellers book transport and accommodation online 25.
Digital Travel Footprint
% tourism organised online by destination, 2018 estimate
100%
90%
80%
70%
60%
50%
40%
30%
20%
10%
0%
Source: Tourism Economics
24 Visa Global Travel Intentions Study, 2018
25 PATA Youth Travel Report: Stepping Out of the Crowd, 2016
Data & Digital Platforms: Driving Tourism Growth in Asia Pacific 22By combining several data sources, Tourism Economics has estimated the
digital travel footprint (the proportion of tourism organised online) for each
destination.
80% of travel in the region is On average, almost 80% of travel is organised online across 12 Asia Pacific
organised online. destinations, similar to the 83% of travel organised online worldwide 26. There
are wide variations by destination in the proportion of travel organised online,
ranging from just 62% in Vietnam to 92% in Japan.
Those destinations with a higher proportion of travel organised online have
already realised many benefits, including those related to platforms, but can still
benefit from continued data innovation. Destinations with lower digital footprints
have opportunities for faster growth and greater market development by
adopting best practices observed in more successful digital destinations.
3.3 PLATFORMS FACILITATE ONLINE TRAVEL BEHAVIOUR
A wide range of platforms enable digital interactions throughout the five stages
Digital platforms are of the travel planning process: Dreaming, Planning, Booking, Experiencing, and
essential to organise travel Sharing. Travellers interact with online platforms such as specialised travel
online. content apps, general search sites and company websites to gain information
at each stage. These digital interactions, in turn, generate data which can be
used by businesses and destination management organisations to improve
products and services for travellers and drive future growth.
Platforms support the digital ecosystem throughout the Five Stages of Travel Planning
1. Dreaming
Travellers identify
aspirational
destinations for
future trips
5. Sharing 2. Planning
Experiences are
Active research as
shared during and
options are
after trips to inspire Digital narrowed
other travellers Platforms
facilitate online
interactions
generating data
to support growth
4. Experiencing 3. Booking
Travellers optimise
Time and cost
trips by accessing
savings ensure a
digital information,
greater likelihood
including mobile
of booking
apps
26 Visa Global Travel Intentions Study, 2018
Data & Digital Platforms: Driving Tourism Growth in Asia Pacific 23Dreaming – travellers identify potential destinations for future travel through a
variety of sources, including content posted by other travellers online. Of the
Travellers are inspired by 73% of travellers who use online sources to decide on their destination, 35%
social media posts and rely on content posted by other travellers. This is considerably higher than any
other content posted by other information source, including family and friends. When considering 18- to
other travellers. 24-year olds, the reliance on online opinions rises to 38%.
The utilization of search, social media and other platforms in this stage
generates usable data for destinations and businesses to understand potential
visitors as well as perceptions of their destination compared to competitors.
However, this may involve some very long lead times as aspirational
destinations may be identified and investigated well before actual travel can
become a reality. One in five Asians are directly inspired by what their friends
posted on social media27.
Planning – more active travel planning occurs during this stage as options are
explored using the wealth of available information. Online reviews and
Online trip planning involves responses to reviews are critical in shaping travel decisions. Destinations and
a wealth of information, businesses can effectively reach a large audience to influence decisions by
occurring over a 3-month harnessing the right platforms.
period. Travellers are more informed than ever before and have access to a wealth of
information throughout the planning process. Online trip planning involves
access to more information than offline planning. Planning for the average trip
occurs over a period of almost 3 months28, “amounting to 259 unique online
research moments. Online search sits right at the centre, helping travellers
navigate back and forth between different touchpoints”29.
Although research is now overwhelmingly online, booking does not always rely
on the same platform or medium and one in three travellers book off-line. Data
generated by travellers in planning should be analysed separate from booking
data as it can provide further usable information.
Flexible access to platforms, Booking – by using trusted platforms, travellers have greater confidence that
including mobile access is they are basing decisions on unbiased information. They are emboldened to
essential to meet traveller book additional trips and increase their length of stay to fit in extra attractions30.
needs. The likelihood of Destinations benefit from the extra visits, nights and associated spending, while
consumers benefit from lower costs by finding better deals.
booking is increased by
providing more relevant Data generated by digital booking and research platforms should be combined
information. to form a holistic understanding of how much time travellers spend on each
aspect of research before booking. There is considerable overlap between the
benefits of platforms and data innovation as shown in the example of Klook.
Since many connected travellers want to leave planning the more granular
details of their travel until they arrive at their destination, it is important to have
more flexible routes to research and booking. Connected travellers currently
27 PATA Youth Travel Report: Stepping Out of the Crowd, 2016
28 TripAdvisor, Worldwide Travel Path to Purchase, 2017
29 GfK & Google research for Australia
30 TripAdvisor, Sizing Worldwide Tourism Spending & TripAdvisor’s Economic Impact, 2018
Data & Digital Platforms: Driving Tourism Growth in Asia Pacific 24use smartphones more frequently to “find things to do” (67% travellers) than for
booking accommodation (37%) or for organising their trip (44%). The right
platforms and mobile access are key to reach travellers and benefit businesses
and destinations.
Case study: Klook
Digital platforms transformed the travel industry by allowing consumers to optimise searches
for airline flights and hotel reservations. Now comes the race to help travellers plan things to
do once they reach their destinations.
Founded in 2014, Klook has become one of Asia’s leading travel activities and services
booking platforms. The platform allows travellers to discover and book popular attractions,
local tours, rail passes, food options, and unique experiences around the world on its website
and mobile app. The site claims 30 million unique visitors per year, and, according to the chief
revenue officer Anita Ngai, transactions and unique visitors are growing by triple digits
annually and are expected to reach US$1 billion this year. About one-third of its customers are
based in mainland China, another third in South East Asia, and about 20% in Japan and the
Republic of Korea.
About 70% of Klook’s customer interactions take place via mobile phones, compared to about
30% for comparable online travel agents (OTAs)—and a disproportionate number of those
customers are Millennials. Meeting market demand means emphasizing services like instant
confirmation via mobile devices when users book a guided tour or outdoor adventure.
“This is all driven by consumer behaviour,” Ms. Ngai says, referring to the ubiquitous use of
smartphones among Asian millennials. “The expectation of our users is that everything will be
instantaneous.”
Klook’s next step is allowing customers direct entry into the events they book. “The most
difficult part of our business is the redemption and fulfilment part,” Ms. Ngai says. Klook is
working with providers like Hong Kong rail to provide a QR code so that purchasers can
download an electronic ticket directly to their mobile device and then show their phones to an
agent to validate their travel.
See Appendix 1 for the complete case study
Experiencing – trips are increasingly optimised through continued access to
platforms during travel, including the widespread use of mobile devices.
Travellers can continue to explore options and effectively navigate destinations
by integrating digital platforms into their travelling experience, also generating a
wealth of data about activities undertaken.
Use of platforms within destinations is now widespread 31. Travellers in the Asia
Pacific region lead the way in terms of travellers accessing TripAdvisor and
OTAs via mobile devices32. The most common planning method for 83% of
young Asian travellers was to ‘make a basic plan first and then work out the
rest when I arrive’33.
31 Visa Global Travel Intentions Study, 2018
32 TripAdvisor’s TripBarometer, 2016 (Traveller Trends and Motivations, Global Findings)
33 PATA Youth Travel Report: Stepping Out of the Crowd, 2016
Data & Digital Platforms: Driving Tourism Growth in Asia Pacific 25Travellers are also increasingly relying on online and contactless payments
87% of millennials instead of traditional cash-based methods of payment. Hospitality businesses
need to meet this demand, while retaining trust that transactions are secure.
consider their
They can do this by showing charges in each traveller’s own currency and
smartphone their most
avoiding unnecessary additional charges.
essential travel item.
Digital Interactions are Widespread During Trips
61% travellers download apps before trips
87% millennials say that smartphones are their most essential travel item
88% travellers access digital information during their trip
48% millennials use ride-sharing apps
70% travellers share experiences online
20% millennials are directly inspired by social
media when making travel choices
Source: Visa Global Travel Intentions Study 2018;
PATA Youth Travel Report: Stepping Out of the Crowd, 2016
Case study: Grab
Just five years ago, it could be risky for a single woman in South East Asia to hail a taxi and
feel confident she would get to her destination safely, without being harassed or overcharged.
Today, ride-hailing apps have changed the situation drastically by allowing riders to tell friends
and family where they are heading, and by vetting drivers before they are hired. The core
proposition of Grab, the leading service in South East Asia, is that “someone who gets in our
car gets a safe, affordable ride,” says Ditesh Gathani, the company’s head of engineering in
Singapore.
A Singapore-based start-up founded by two Malaysian graduate students while at Harvard
Business School, the Grab app has been downloaded more than 100 million times, and lets
customers order taxis, cars, and even motorbikes on-demand.
Another key innovation is a translate function in Grab’s in-app chat feature, so that a
Singaporean visitor landing in Phuket need not speak Thai to communicate with her Grab
driver.
See Appendix 1 for the complete case study
Sharing – travellers are increasingly sharing experiences both during and after
69% travellers shared travel. This information on social media then helps others in the dreaming
process as recommendations from friends and relatives are still widely trusted
experiences via social
by travellers.
media.
Social media clearly links the dreaming and sharing stages, and to a lesser
extent the experiencing stage. In 2017, 69% of travellers surveyed shared their
Data & Digital Platforms: Driving Tourism Growth in Asia Pacific 26You can also read