An expanding manifold in transmodal regions characterizes adolescent reconfiguration of structural connectome organization
←
→
Page content transcription
If your browser does not render page correctly, please read the page content below
RESEARCH ARTICLE

                                    An expanding manifold in transmodal
                                    regions characterizes adolescent
                                    reconfiguration of structural connectome
                                    organization
                                    Bo-yong Park1,2*, Richard AI Bethlehem3,4, Casey Paquola1,5, Sara Larivière1,
                                    Raul Rodrı́guez-Cruces1, Reinder Vos de Wael1,
                                    Neuroscience in Psychiatry Network (NSPN) Consortium†, Edward T Bullmore4,
                                    Boris C Bernhardt1*
                                    1
                                      McConnell Brain Imaging Centre, Montreal Neurological Institute and Hospital,
                                    McGill University, Montreal, Canada; 2Department of Data Science, Inha University,
                                    Incheon, Republic of Korea; 3Autism Research Centre, Department of Psychiatry,
                                    University of Cambridge, Cambridge, United Kingdom; 4Brain Mapping Unit,
                                    Department of Psychiatry, University of Cambridge, Cambridge, United Kingdom;
                                    5
                                      Institute of Neuroscience and Medicine (INM-1), Forschungszentrum Jülich, Jülich,
                                    Germany
*For correspondence:
by9433@gmail.com (B-P);
boris.bernhardt@mcgill.ca (BCB)     Abstract Adolescence is a critical time for the continued maturation of brain networks. Here, we
†
 A complete list of investigators   assessed structural connectome development in a large longitudinal sample ranging from
from the Neuroscience in            childhood to young adulthood. By projecting high-dimensional connectomes into compact manifold
Psychiatry Network (NSPN)           spaces, we identified a marked expansion of structural connectomes, with strongest effects in
Consortium can be found in the      transmodal regions during adolescence. Findings reflected increased within-module connectivity
Supplementary Information.          together with increased segregation, indicating increasing differentiation of higher-order
Group author details:               association networks from the rest of the brain. Projection of subcortico-cortical connectivity
Neuroscience in Psychiatry          patterns into these manifolds showed parallel alterations in pathways centered on the caudate and
Network (NSPN) Consortium See       thalamus. Connectome findings were contextualized via spatial transcriptome association analysis,
page 21                             highlighting genes enriched in cortex, thalamus, and striatum. Statistical learning of cortical and
Competing interest: See             subcortical manifold features at baseline and their maturational change predicted measures of
page 22                             intelligence at follow-up. Our findings demonstrate that connectome manifold learning can bridge
                                    the conceptual and empirical gaps between macroscale network reconfigurations, microscale
Funding: See page 22
                                    processes, and cognitive outcomes in adolescent development.
Received: 07 November 2020
Accepted: 30 March 2021
Published: 31 March 2021

Reviewing editor: Lucina Q
                                    Introduction
Uddin, University of Miami
                                    Adolescence is a time of profound and genetically mediated changes in whole-brain network organi-
University, United States           zation (Larsen and Luna, 2018; Menon, 2013). Adolescent development is important for the matu-
                                    ration in cognitive and educational functions and brain health more generally, a notion reinforced by
   Copyright Park et al. This
                                    the overlapping onset of several neurodevelopmental and psychiatric disorders (Hong et al., 2019;
article is distributed under the
                                    Khundrakpam et al., 2017; Paus et al., 2008). With increased capacity to carry out longitudinal
terms of the Creative Commons
Attribution License, which          studies in large samples, it is now possible to track changes in brain network organization within sub-
permits unrestricted use and        jects, providing insights into maturational processes, their biological underpinnings, and their effects
redistribution provided that the    on behavior and cognition.
original author and source are         By offering an in vivo window into brain organization, neuroimaging techniques, such as magnetic
credited.                           resonance imaging (MRI), offer the ability to track adolescent brain development over time. Several

Park et al. eLife 2021;10:e64694. DOI: https://doi.org/10.7554/eLife.64694                                                           1 of 32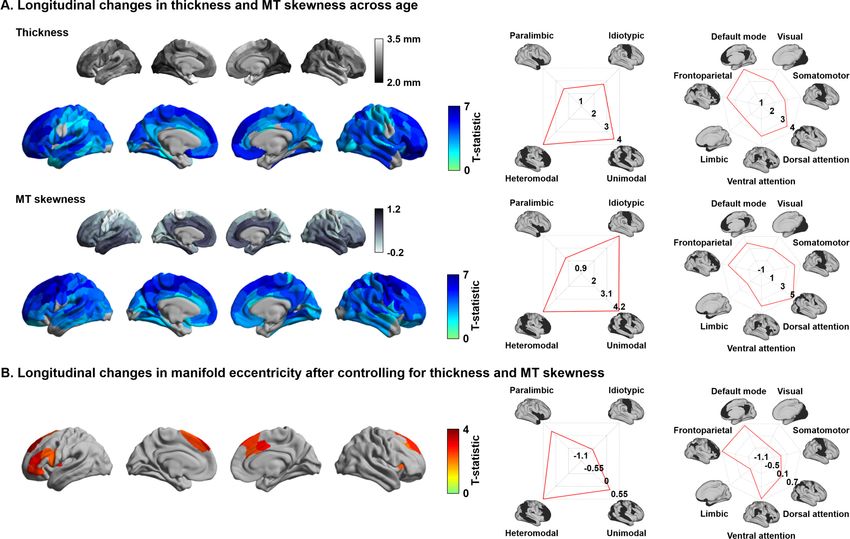
Research article                                                                                                     Neuroscience

                                    cross-sectional and longitudinal studies in neurodevelopmental cohorts have focused on the analysis
                                    of morphological changes (Gogtay et al., 2004; Shaw et al., 2006; Tamnes et al., 2017), including
                                    MRI-based cortical thickness (Shaw et al., 2006; Tamnes et al., 2017) and volumetric measures
                                    (Gogtay et al., 2004; Tamnes et al., 2017). Studies robustly show initial gray matter increases until
                                    mid-late childhood followed by a decline for the rest of the lifespan. During adolescence, cortical
                                    thickness decreases in widespread brain regions (Khundrakpam et al., 2013; Shaw et al., 2006;
                                    Sotiras et al., 2017; Tamnes et al., 2017). Thus, contextualizing connectome alterations relative to
                                    established patterns of cortical thickness findings may establish whether inter-regional network
                                    changes occur above and beyond these diffuse effects of regional morphological maturation. More
                                    recent work explored changes in intracortical microstructure, capitalizing on myelin-sensitive con-
                                    trasts such as magnetization transfer ratio (MT) mapping, which generally suggest overall increases
                                    in adolescence (Paquola et al., 2019a; Whitaker et al., 2016) together with depth-dependent shifts
                                    in intracortical myelin profiles (Paquola et al., 2019a). Besides the increasingly recognized changes
                                    in cortico-cortical connectivity, studying subcortical regions offer additional insights for understand-
                                    ing brain maturation during adolescence. Indeed, an increasing body of connectome-level studies
                                    emphasizes that subcortical structures contribute significantly to patterns of whole-brain organiza-
                                    tion, dynamics, and cognition (Hwang et al., 2017; Müller et al., 2020; Shine et al., 2019). In prior
                                    neurodevelopmental studies, it has been shown that the volumes of the striatum and thalamus
                                    decrease between adolescence and adulthood, potentially paralleling processes resulting in cortical
                                    gray matter reduction during this time window (Herting et al., 2018). A close inter-relationship
                                    between cortical and subcortical development is also suggested by recent functional connectivity
                                    work suggesting that cortico-subcortical pathways are intrinsically remodeled during adolescence
                                    (Váša et al., 2020), and these changes affect cognitive functioning. Collectively, these prior findings
                                    suggest measurable trajectories of cortical and subcortical structural organization and support asso-
                                    ciations to cognitive development (Baum et al., 2020; Shaw et al., 2006).
                                        Recent conceptual and methodological advances enable the study of brain organization, develop-
                                    ment, and substrates underlying cognitive trajectories in humans. One key modality to track devel-
                                    opmental changes in structural connectivity is diffusion MRI (dMRI), a technique sensitive to the
                                    displacement of water in tissue that allows for the non-invasive approximation of inter-regional white
                                    matter tracts. Prior cross-sectional and longitudinal studies in children and adolescents outlined
                                    changes in the microstructure of major white matter tracts during development based on the analy-
                                    sis of dMRI-derived tissue parameters (Lebel and Beaulieu, 2011; Schmithorst and Yuan, 2010).
                                    These findings have been complemented by assessments of brain network topology using graph-
                                    theoretical analysis (Baker et al., 2015; Hagmann et al., 2010; Lebel and Beaulieu, 2011;
                                    Oldham and Fornito, 2019), which reported a relatively preserved spatial layout of structural hubs
                                    across adolescent development on the one hand (Hagmann et al., 2010), yet with a continued
                                    strengthening of their connectivity profiles, likely underpinned by the ongoing maturation of long-
                                    range association fibers (Baker et al., 2015; Lebel and Beaulieu, 2011; Oldham and Fornito,
                                    2019).
                                        One emerging approach to address connectome organization and development comes from the
                                    application of manifold learning techniques to connectivity datasets. By decomposing whole-brain
                                    structural and functional connectomes into a series of lower dimensional axes capturing spatial gra-
                                    dients of connectivity variations, these techniques provide a compact perspective on large-scale con-
                                    nectome organization (Margulies et al., 2016; Paquola et al., 2019b; Vos de Wael et al., 2020a).
                                    In addition, these techniques capture multiple, potentially overlapping gradients in connectivity
                                    along cortical mantle, which can represent both subregional heterogeneity and multiplicity within a
                                    brain region (Haak and Beckmann, 2020). In prior work, we showed that multiple dMRI gradients
                                    can illustrate structural underpinnings of dynamic functional communication in the adult human con-
                                    nectome (Park et al., 2021b). In line with prior conceptual accounts, the low-dimensional eigenvec-
                                    tors (i.e., gradients) derived from these techniques provide continuous dimensions of cortical
                                    organization, and thus the eigenvectors can jointly generate intrinsic coordinate systems of the brain
                                    based on connectivity (Bijsterbosch et al., 2020; Haak et al., 2018; Huntenburg et al., 2018;
                                    Margulies et al., 2016; Mars et al., 2018). Beyond these methodological considerations, prior work
                                    has shown that the principal gradients estimated from resting-state functional (Margulies et al.,
                                    2016), microstructural (Paquola et al., 2019b), and diffusion MRI (Park et al., 2021a) all converge
                                    broadly along an established model of sensory-fugal hierarchy and laminar differentiation

Park et al. eLife 2021;10:e64694. DOI: https://doi.org/10.7554/eLife.64694                                                            2 of 32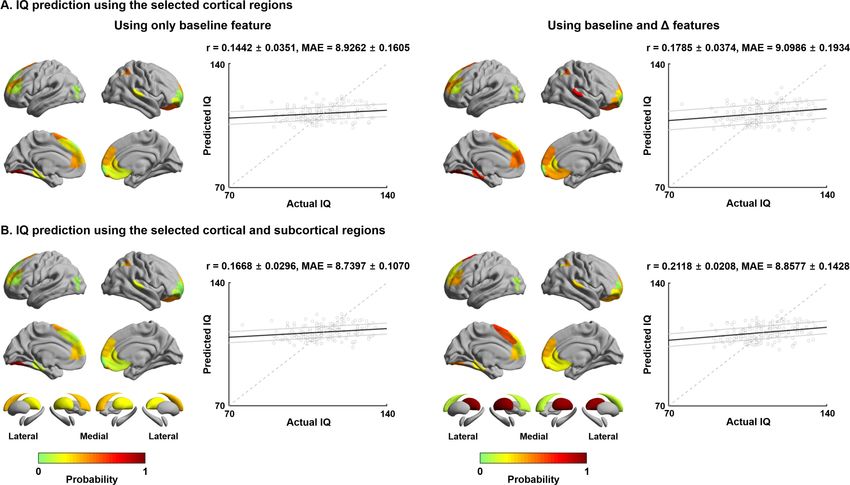
Research article                                                                                                    Neuroscience

                                    (Mesulam, 1998), allowing gradient mapping techniques to make conceptual contact to theories of
                                    cortical organization, development, and evolution (Buckner and Krienen, 2013; Goulas et al.,
                                    2018; Huntenburg et al., 2018; Sanides, 1969; Sanides, 1962). An emerging literature has indeed
                                    shown utility of the gradient framework to study primate evolution and cross-species alignment
                                    (Blazquez Freches et al., 2020; Valk et al., 2020; Xu et al., 2020), neurodevelopment (Hong et al.,
                                    2019; Paquola et al., 2019a), as well as plasticity and structure-function coupling (Park et al.,
                                    2021b; Valk Sofie et al., 2020; Vázquez-Rodrı́guez et al., 2019). In a recent assessment by our
                                    team, manifold learning techniques have been applied to myelin sensitive intracortical MT data,
                                    showing an increasing myeloarchitectural differentiation of association cortex throughout adoles-
                                    cence (Paquola et al., 2019a). Still, the longitudinal maturation of dMRI connectomes in children
                                    and adolescents using manifold techniques has not been tracked.
                                        Imaging-transcriptomics approaches allow for the identification of cellular and molecular factors
                                    that co-vary with imaging-based findings (Arnatkeviciute et al., 2019; Fornito et al., 2019;
                                    Gorgolewski et al., 2014; Hawrylycz et al., 2015; Thompson et al., 2013). Recently established
                                    resources, such as the Allen Human Brain Atlas (Arnatkeviciute et al., 2019; Hawrylycz et al.,
                                    2015), can be utilized to spatially associate macroscale imaging/connectome data with the expres-
                                    sion patterns of thousands of genes. These findings have already been applied in the study of
                                    healthy adults (Hawrylycz et al., 2015; Park et al., 2020) and typically developing adolescents
                                    (Mascarell Maričić et al., 2020; Padmanabhan and Luna, 2014; Paquola et al., 2019a;
                                    Vértes et al., 2016; Whitaker et al., 2016), as well as individuals suffering from prevalent brain dis-
                                    orders (Altmann et al., 2018; Hashimoto et al., 2015; Klein et al., 2017; Park et al., 2021a;
                                    Patel et al., 2021; Romero-Garcia et al., 2019). The gene sets that co-vary with in vivo findings can
                                    furthermore be subjected to gene set enrichment analyses to discover potentially implicated molec-
                                    ular, cellular, and pathological processes (Ashburner et al., 2000; Carbon et al., 2019; Chen et al.,
                                    2013; Dougherty et al., 2010; Kuleshov et al., 2016; Morgan et al., 2019; Romero-Garcia et al.,
                                    2018; Subramanian et al., 2005). For example, studies in newborns have shown that cortical mor-
                                    phology reflects spatiotemporal patterns of gene expression in fetuses, linking molecular mecha-
                                    nisms to in vivo measures of cortical development in early life (Ball et al., 2020). Work in
                                    adolescents has furthermore shown that developmental changes in regional cortical thickness meas-
                                    ures and myelin proxies spatially co-localize with the expression patterns of genes involved in synap-
                                    tic and oligodendroglial function (Paquola et al., 2019a; Whitaker et al., 2016). Building on these
                                    prior investigations, the current study aimed at exploring whether adolescent structural connectome
                                    reconfigurations, assessed using manifold learning techniques, reflect the expression patterns of
                                    specific genes in order to identify potential molecular signatures of macroscale structural network
                                    development.
                                        Here, we charted developmental changes in structural connectome organization, based on an
                                    accelerated longitudinal neuroimaging study involving 208 participants investigated between 14 and
                                    26 years of age (Kiddle et al., 2018; Whitaker et al., 2016). Compared to cross-sectional designs,
                                    longitudinal studies track within-subject change, separating developmental effects from between-
                                    subject variability (Louis et al., 1986). We first estimated longitudinal changes in structural connec-
                                    tome manifolds across age. This compact and lower dimensional space furthermore allowed for the
                                    integration of connectome-level findings with changes in MRI-based measures of cortical morphol-
                                    ogy and intracortical myelin. We furthermore projected subcortico-cortical connectivity patterns into
                                    the manifold space to assess parallel developmental shifts of these pathways in the studied time win-
                                    dow. Connectome manifold changes were contextualized at the molecular level via transcriptomic
                                    association and developmental enrichment analyses based on post-mortem datasets, which further-
                                    more allowed for data-driven exploration of time windows of spatially co-localized gene sets. To
                                    also assess behavioral associations of connectome manifold changes, we utilized supervised machine
                                    learning to predict future measures of cognitive function quantified via the intelligence quotient (IQ).
                                    IQ is a widely used marker of general cognitive abilities, which shows good test–retest reliability
                                    (Brown and May, 1979; Watkins and Smith, 2013; Catron, 1978; G.-Matarazzo et al., 1973;
                                    Snow et al., 1989; Wagner and Caldwell, 1979) and has previously been applied to index overall
                                    cognitive function during development (Crespi, 2016; Garde et al., 2005; Garde et al., 2000;
                                    Koenis et al., 2018; Park et al., 2016; Ramsden et al., 2011; Shaw et al., 2006; Suprano et al.,
                                    2020). In the study of neurodevelopment, neuroimaging reports have previously assessed associa-
                                    tions between IQ and large-scale network measures in children to adolescents (Koenis et al., 2018;

Park et al. eLife 2021;10:e64694. DOI: https://doi.org/10.7554/eLife.64694                                                           3 of 32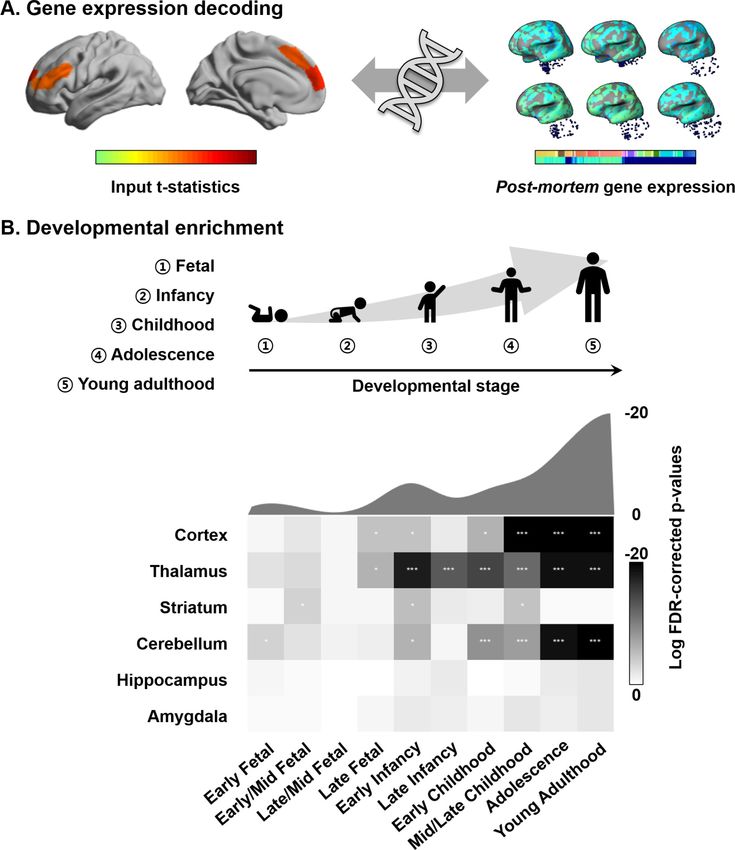
Research article Neuroscience
Ramsden et al., 2011; NSPN Consortium et al., 2018; Shaw et al., 2006; Suprano et al., 2020).
Multiple sensitivity analyses were conducted at several steps to verify the robustness of our findings,
and analytical code is made fully accessible to allow for independent replication of our findings.
Results
These findings were based on the Neuroscience in Psychiatry Network (NSPN) cohort (Kiddle et al.,
2018; Whitaker et al., 2016). In brief, we studied 208 healthy individuals enrolled in an accelerated
longitudinal study, with approximately equal numbers of males and females in each of five age-
related strata that collectively spanned the time period from 14 to 25 years coinciding with transition
from adolescence to young adulthood. Participants (48% female) had a mean age of 18.82 years
(range = 14–25 years) at baseline and 19.95 years (15–26 years) at follow-up. The average interval
between baseline and follow-up scan was 11.28 months (range = 6–12 months). See Materials and
methods for details on participant selection, image processing, and analysis.
Macroscale structural connectome manifold
For every participant, we built cortex-wide structural connectome manifolds formed by the eigenvec-
tors displaying spatial gradients in structural connectome organization using non-linear dimensional-
ity reduction techniques (Vos de Wael et al., 2020a; Vos de Wael et al., 2020b, https://github.
com/MICA-MNI/BrainSpace). Individual manifolds were aligned to a template manifold estimated
from a hold-out dataset (see Materials and methods) (Langs et al., 2015; Vos de Wael et al.,
2020a). Three eigenvectors (E1, E2, and E3) explained approximately 50% of information in the tem-
plate affinity matrix (i.e., 20.7/15.8/13.5% for E1/E2/E3, respectively), with each eigenvector showing
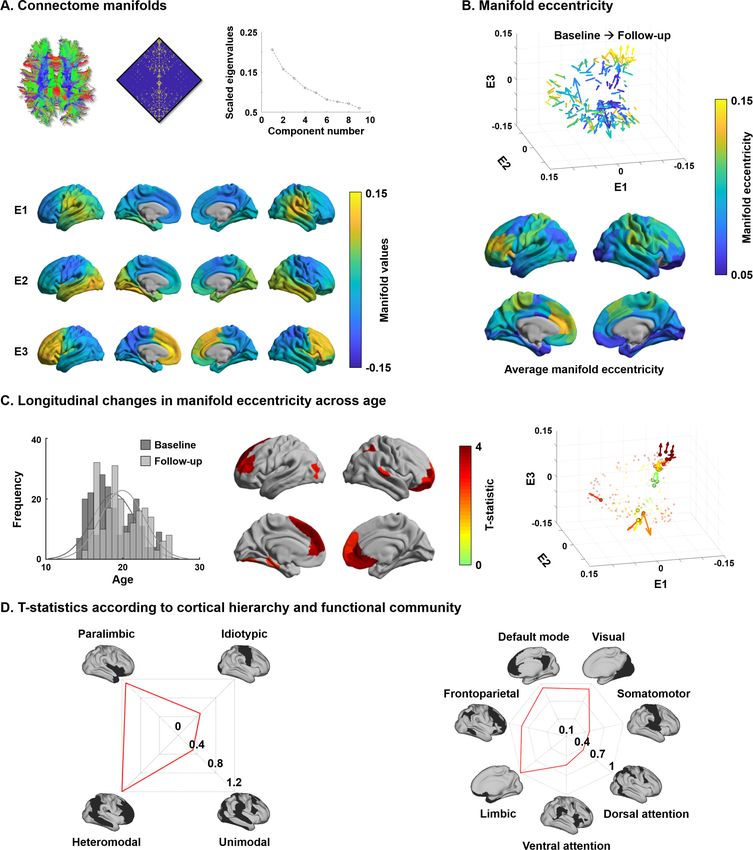
a different axis of spatial variation across the cortical mantle (Figure 1A). Eigenvectors depicted a
continuous differentiation between medial and lateral cortices (E1), between inferior and superior
cortices (E2), and between anterior and posterior areas (E3). For each participant and time point, we
calculated manifold eccentricity, which depicts how far each node is located from the center of the
template manifold (see Materials and methods). It thus quantifies the changes in eigenvectors
between the time points in terms of expansion and contraction instead of comparing multidimen-
sional connectome manifolds (Bethlehem et al., 2020). The manifold eccentricity showed high val-
ues in frontal and somatomotor regions, while temporoparietal, visual, and limbic regions showed
low values (Figure 1B).
Changes in manifold eccentricity across age
Leveraging linear mixed effect models that additionally controlled for effects of sex, site, head
motion, and subject-specific random intercepts (Worsley et al., 2009), we assessed changes in man-
ifold eccentricity across age (see Materials and methods). Manifold eccentricity expanded as age
increased, especially in bilateral prefrontal and temporal areas, as well as left early visual and right
lateral parietal cortices (false discovery rate [FDR] < 0.05; Benjamini and Hochberg, 1995;
Figure 1C). Stratifying these effects along four cortical hierarchical levels, defined using an estab-
lished taxonomy based on patterns of laminar differentiation and tract-tracing data in non-human
primates (Mesulam, 1998), we identified peak effects in heteromodal association and paralimbic
areas (Figure 1D). Convergent findings were observed when analyzing the effects with respect to
intrinsic functional communities (Yeo et al., 2011), showing highest effects in default mode and lim-
bic areas followed by visual and frontoparietal cortices. No significant contraction of manifold eccen-
tricity was observed. In addition, we could not find any significant effects when we fitted the model
with a quadratic form of age (i.e., age2), indicating the manifold eccentricity linearly increases across
age.
To conceptualize the findings derived from manifold eccentricity with respect to conventional net-
work topologies, we correlated manifold eccentricity changes with several graph-theoretical meas-
ures of structural connectome (Figure 1—figure supplement 1; Rubinov and Sporns, 2010). We
first defined six spatially contiguous clusters within the regions that showed significant age-related
changes in manifold eccentricity (see Figure 1C) and correlated within-subject changes in manifold
eccentricity with developmental changes in degree centrality, connectivity distance, and modular
parameters (i.e., within-module degree and participation coefficient based on modules defined via
Louvain’s community detection algorithm [Blondel et al., 2008]; see Materials and methods;
Park et al. eLife 2021;10:e64694. DOI: https://doi.org/10.7554/eLife.64694 4 of 32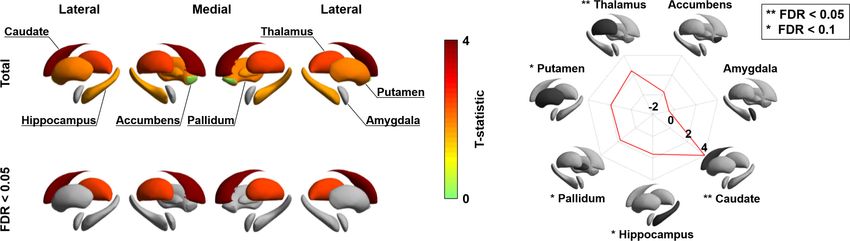
Research article                                                                                                            Neuroscience

Figure 1. Structural connectome manifolds. (A) Systematic fiber tracking based on diffusion magnetic resonance imaging generated a cortex-wide
structural connectome, which was subjected to diffusion map embedding. As shown in the scree plot, three eigenvectors (E1, E2, E3) accounted for
approximately 50% information of connectome data, and each depicted a different gradual transition across the cortical mantle. (B) Manifold
eccentricity measured by Euclidean distance between the template center and each data point. Arrows depict average positional change in
Figure 1 continued on next page

Park et al. eLife 2021;10:e64694. DOI: https://doi.org/10.7554/eLife.64694                                                                   5 of 32
Research article                                                                                                                  Neuroscience

Figure 1 continued
connectivity space from baseline to follow-up. The color of each arrow represents each brain region mapped on the surface on the bottom. (C) The
histogram represents age distribution of all subjects at baseline and follow-up. The colors on brain surfaces indicate t-statistics of regions showing
significant longitudinal changes in manifold eccentricity across age, following multiple comparisons correction with a false discovery rate < 0.05.
Datapoint colors in the scatter plot represent t-statistics. Identified regions are represented with arrows that originate from baseline to follow-up. (D)
Stratification of age-related changes in manifold eccentricity according to prior models of cortical hierarchy (Mesulam, 1998) and functional magnetic
resonance imaging communities (Yeo et al., 2011).
The online version of this article includes the following source data and figure supplement(s) for figure 1:
Source data 1. Source files for connectome manifolds and age-related changes in manifold eccentricity.
Figure supplement 1. Association between structural connectome manifold and connectome topology measures.
Figure supplement 2. Modular structures.
Figure supplement 3. Age-related trends in connectome topology measures.
Figure supplement 4. Structural connectome manifolds using Schaefer 300 atlas.
Figure supplement 5. Sensitivity analysis for site and sex.
Figure supplement 6. Longitudinal changes in manifold eccentricity, after excluding participants with the lowest correspondence to template
manifolds.
Figure supplement 7. Structural connectome manifolds generated using principal component analysis.
Figure supplement 8. Longitudinal changes in graph measures across age.
Figure supplement 9. Longitudinal changes in manifold eccentricity calculated using all eigenvectors.
Figure supplement 10. Connectome manifolds estimated using group consistency method.
Figure supplement 11. Structural connectome manifolds using a structural parcellation.
Figure supplement 12. Longitudinal changes in edge weights of structural connectome.
Figure supplement 13. Longitudinal changes in manifold eccentricity using a subset of participants who completed Tanner scale.
Figure supplement 14. Structural connectome manifolds using different template dataset.
Figure supplement 15. A schema of manifold eccentricity for three eigenvectors.

                                      Figure 1—figure supplement 2). We found significant positive associations for degree centrality
                                      and within-module degree, suggesting that connectome manifold expansion reflects a concurrent
                                      increase of overall connectivity, particularly within modules. Stratifying changes in manifold eccen-
                                      tricity, as well as connectome topology measures, according to the discretized age bins confirmed
                                      these age-related trends (Figure 1—figure supplement 3). Indeed, except for participation coeffi-
                                      cient, values in general increased from childhood to young adulthood.

                                      Effects of cortical morphology and microstructure
                                      Previous studies demonstrated significant changes in cortical morphology and microstructure during
                                      adolescence, showing co-occurring reductions in cortical thickness and MT skewness, the latter
                                      being an index of depth-dependent intracortical myelin changes in multiple lobes (Gogtay et al.,
                                      2004; Khundrakpam et al., 2017; Paquola et al., 2019a; Shaw et al., 2006). We replicated these
                                      findings by showing cortical thinning in almost all brain regions across the studied age window as
                                      well as reductions in depth-dependent MT skewness, suggestive of supragranular enrichment of
                                      myelin (Figure 2A). To evaluate whether the age-related changes in manifold eccentricity were
                                      robust above and beyond these regional changes in cortical thickness and MT, we implemented lin-
                                      ear mixed effect models including cortical thickness and MT as covariates in the analysis of develop-
                                      mental change in manifold eccentricity (Figure 2B). While we observed virtually identical spatial
                                      patterns of manifold eccentricity changes in models that controlled for thickness, MT skewness, and
                                      both, age-related effects in regions of significant manifold eccentricity findings (see Figure 1C) were
                                      reduced in models that additionally controlled for these covariates (average reduction of t-value in
                                      models controlling for thickness/MT skewness/both = 42/18/68%).

                                      Age-related changes in subcortico-cortical connectivity
                                      Besides visualizing these changes in cortico-cortical connectivity, we also capitalized on the manifold
                                      representation to assess adolescent changes in the connectivity of subcortical regions, to obtain a
                                      more holistic insight into whole-brain connectome reconfigurations during this time period, and to
                                      examine whether subcortical connectivity patterns undergo parallel developmental trajectories
                                      (Hwang et al., 2017; Shine et al., 2019). Specifically, we assessed changes in subcortical-weighted
                                      manifolds across age, defined by projecting the streamline strength of subcortical regions to cortical

Park et al. eLife 2021;10:e64694. DOI: https://doi.org/10.7554/eLife.64694                                                                          6 of 32
Research article Neuroscience
Figure 2. Age-related effects on macro- and microstructural metrics of cortical anatomy. (A) The t-statistics of identified regions that showed significant
age-related changes in cortical thickness (upper row) and magnetization transfer ratio MT (bottom row), and stratification of t-statistics according to
cortical hierarchy (Mesulam, 1998) and functional community (Yeo et al., 2011). (B) Age-related changes in manifold eccentricity after controlling for
cortical thickness and MT.
The online version of this article includes the following source data for figure 2:
Source data 1. Source files for age-related changes in cortical thickness and magnetization transfer ratio.
targets to the manifold space (see Materials and methods). Such an analysis situates changes in sub-
cortico-cortical pathways in the macroscale context of cortico-cortical connectivity identified in the
previous analyses. After multiple comparisons correction, the caudate and thalamus showed signifi-
cant age-related effects on subcortical-weighted manifolds (FDR < 0.05; Figure 3), and marginal
effects were observed in the putamen, pallidum, and hippocampus (FDR < 0.1).
Transcriptomic association analysis
Connectome organization, in general, and macroscale gradients, in particular, have been argued to
reflect genetic expression profiles, underscoring the close link between the physical layout of the
brain and innate transcriptional patterning (Buckner and Krienen, 2013; Fornito et al., 2019). Here,
we carried out a transcriptomic association analysis and developmental enrichment analyses to con-
textualize the age-related manifold eccentricity changes with respect to patterns of post-mortem
gene expression from a sample of independent adults (Figure 4A). Specifically, leveraging mixed
effect models, we associated the spatial patterns of manifold change across age in the NSPN sample
(controlling for covariation of cortical thickness and MT) with cortical maps of post-mortem gene
expression data from the Allen Institute for Brain Sciences (Arnatkeviciute et al., 2019;
Gorgolewski et al., 2015; Gorgolewski et al., 2014; Hawrylycz et al., 2012; Markello et al.,
Park et al. eLife 2021;10:e64694. DOI: https://doi.org/10.7554/eLife.64694 7 of 32Research article Neuroscience
Figure 3. Longitudinal changes in subcortical-weighted manifolds. The t-statistics of age-related changes in subcortical-weighted manifolds. The effects
of each subcortical region are reported on the radar plot. FDR: false discovery rate.
The online version of this article includes the following source data for figure 3:
Source data 1. Source files for age-related changes in subcortical-weighted manifolds.
2020). Among the list of most strongly associated genes (FDR < 0.05), we selected only genes that
were consistently expressed across different donors (r > 0.5) (Arnatkeviciute et al., 2019;
Hawrylycz et al., 2012; Markello et al., 2020; Supplementary file 1). We performed developmen-
tal gene set enrichment analysis using the cell-type-specific expression analysis (CSEA) tool, which
compares the selected gene list with developmental enrichment profiles (see Materials and methods)
(Dougherty et al., 2010; Xu et al., 2014). This analysis highlights developmental time windows
across macroscopic brain regions in which genes are strongly expressed. We found marked expres-
sion of the genes enriched from childhood onward in the cortex, thalamus, and cerebellum
(FDR < 0.001; Figure 4B). Although signal was reduced, genes were also enriched for expression in
the striatum at the transition from childhood to adolescence (FDR < 0.05). On the other hand, identi-
fied genes were not found to be expressed in the hippocampus and amygdala.
Association between connectome manifold and cognitive function
Finally, to establish associations between connectome reconfigurations and cognitive functioning,
we utilized supervised machine learning to predict full IQ at follow-up using manifold eccentricity
features. Independent variables were combinations of cortical and subcortical manifold features at
baseline and their age-related trajectory data. We used elastic net regularization with nested ten-
fold cross-validation (Cawley and Talbot, 2010; Parvandeh et al., 2020; Tenenbaum et al., 2000;
Varma and Simon, 2006; Zou and Hastie, 2005) (see Materials and methods), and repeated the
prediction 100 times with different training and test dataset compositions to mitigate subject selec-
tion bias. Across cross-validation and iterations, 6.24 ± 5.74 (mean ± SD) features were selected to
predict IQ using manifold eccentricity of cortical regions at baseline, 6.20 ± 5.14 cortical features at
baseline and maturational change, 5.45 ± 5.99 cortical and subcortical features at baseline, and
5.16 ± 5.43 at baseline and maturational change, suggesting that adding more independent varia-
bles may not per se lead to improvement in prediction accuracy. The manifold eccentricity of cortical
regions at baseline significantly predicted future IQ score (mean ± SD r = 0.14 ± 0.04; mean absolute
error [MAE] = 8.93 ± 0.16, p=0.09). Prediction performance was slightly improved when we com-
bined the manifold eccentricity both at baseline and differences between follow-up and baseline
(r = 0.18 ± 0.04; MAE = 9.10 ± 0.19, p=0.04) (Figure 5A). Notably, prediction accuracy was
improved if we additionally considered subcortical manifold features (baseline: r = 0.17 ± 0.03;
MAE = 8.74 ± 0.11, p=0.04; baseline and maturational change: r = 0.21 ± 0.02; MAE = 8.86 ± 0.14,
p=0.01) (Figure 5B). The regions showing strongest predictive validity for IQ were prefrontal, parie-
tal, and temporal cortices, as well as the caudate and thalamus. The probability map of the selected
brain regions (bottom right of Figure 5B) was further decoded using Neurosynth (Yarkoni et al.,
Park et al. eLife 2021;10:e64694. DOI: https://doi.org/10.7554/eLife.64694 8 of 32Research article Neuroscience
Figure 4. Transcriptomic analysis. (A) Gene decoding process by associating t-statistics from the linear mixed
effect model with post-mortem gene expression maps. (B) We identified genes that were spatially correlated with
the input t-statistic map (false discovery rate [FDR] < 0.05) and selected only those that were furthermore
consistently expressed across different donors (r > 0.5). These genes were input to a developmental enrichment
analysis, showing strong associations with cortex, thalamus, striatum, and cerebellum during the childhood-to-
adulthood time window. The degree of gene expression for developmental windows is reported on the bottom.
The curve represents log transformed FDR-corrected p-values, averaged across the brain regions for each of the
time windows reported on the bottom. ***FDR < 0.001, ** FDR < 0.01, *FDR < 0.05.
The online version of this article includes the following source data for figure 4:
Source data 1. Source files for developmental enrichment profiles.
2011), revealing strong associations with higher-order cognitive and social terms (Figure 5—figure
supplement 1). We compared the prediction performance of our model with a baseline model,
where IQ of the test set was simple average of training set (r = 0.15 ± 0.06, MAE = 8.98 ± 0.04,
p=0.12; see Materials and methods). We found that our model outperformed this baseline model
Park et al. eLife 2021;10:e64694. DOI: https://doi.org/10.7554/eLife.64694 9 of 32Research article Neuroscience
Figure 5. Intelligence quotient (IQ) prediction by baseline and follow-up measures of cortical and subcortical manifolds. (A) Probability of selected
brain regions across ten-fold cross-validation and 100 repetitions for predicting future IQ using only baseline manifold eccentricity (left), and both
baseline and maturational change in the feature (right). Correlations between actual and predicted IQ are reported. Black lines indicate mean
correlation, and gray lines represent 95% confidence interval for 100 iterations with different training/test dataset. (B) The prediction performance when
both cortical and subcortical features were considered. MAE: mean absolute error.
The online version of this article includes the following source data and figure supplement(s) for figure 5:
Source data 1. Source files for selected probability as well as actual and predicted intelligence quotient.
Figure supplement 1. Cognitive decoding of the selected regions for intelligence quotient (IQ) prediction.
Figure supplement 2. Intelligence quotient (IQ) prediction using regression tree approach.
(Meng’s z-test p < 0.001) (Meng et al., 1992). We also predicted the change of IQ between the
baseline and follow-up, instead of IQ at follow-up, using the imaging features. However, we could
not find significant results.
Sensitivity analysis
Spatial scale
Repeating the longitudinal modeling with a different spatial scale (i.e., 300 parcels), findings were
highly consistent (Figure 1—figure supplement 4).
Site and sex effects
Furthermore, manifold eccentricity of the identified cortical regions and age consistently correlated
positively across different sites and within both biological sexes, yielding non-significant interaction
effects (Figure 1—figure supplement 5).
Park et al. eLife 2021;10:e64694. DOI: https://doi.org/10.7554/eLife.64694 10 of 32Research article Neuroscience
Different parameters for diffusion map embedding
When we changed parameters of diffusion map embedding for generating connectome manifolds
(see Materials and methods), t-statistic maps of age-related changes in manifold eccentricity were
largely consistent (mean ± SD linear correlation r = 0.92 ± 0.10).
Gradient alignment fidelity
When calculating linear correlations between template and individual manifolds before and after
alignment, we found significant increases after alignment (r = 0.92 ± 0.03/0.93 ± 0.03/0.94 ± 0.03)
compared to before alignment ( 0.02 ± 0.03/–0.001 ± 0.37/0.003 ± 0.12) for E1/E2/E3, respectively,
supporting effectiveness of alignment. After excluding 10% of subjects with poor alignment (cutoff
r = 0.83; the new set was correlated with the template manifold, r = 0.94 ± 0.01), we found consis-
tent age-related changes in manifold eccentricity (Figure 1—figure supplement 6), with the t-statis-
tic map showing strong correlation to the map derived in the whole sample (r = 0.97, pResearch article Neuroscience
attention and sensory networks (FDR < 0.05; Figure 1—figure supplement 12), consistent with find-
ings based on manifold eccentricity.
Manifold eccentricity and pubertal stages
We repeated the longitudinal modeling within a subset of participants who completed the Tanner
scale (n = 73) (Marshall and Tanner, 1970; Marshall and Tanner, 1969) and found relatively consis-
tent albeit weaker age-related changes in manifold eccentricity as for the overall sample (Figure 1—
figure supplement 13A). Notably, manifold eccentricity within the identified regions derived from
overall sample and Tanner scale revealed a significant interaction effect (t = 2.36, p=0.01; Figure 1—
figure supplement 13B), suggesting that participants in early pubertal stages show more marked
changes in manifold eccentricity across age compared to those in later stages.
IQ prediction using nonlinear model
We predicted IQ at follow-up using a regression tree method (Breiman et al., 1984), instead of lin-
ear regression model, but we could not find improved prediction performance (Figure 5—figure
supplement 2).
Discussion
The current study tracked whole-brain structural connectome maturation from adolescence to young
adulthood in an accelerated longitudinal imaging cohort (Kiddle et al., 2018; Whitaker et al.,
2016). Capitalizing on advanced manifold learning techniques applied to dMRI-derived connec-
tomes, we established that higher-order association cortices in prefrontal, medial and superior tem-
poral areas, as well as parieto-occipital regions, expanded in their connectome manifold
representation indicative of an increased differentiation of these systems from the rest of the brain
in adolescence. Parallel topological analysis based on graph theory indicated that these changes
anatomically coincided with increases in the within-module connectivity of transmodal cortices. Find-
ings were consistent across the different acquisition sites and biological sexes, and similar albeit
slightly weaker when correcting connectivity manifolds for MRI-based measures of macrostructure
(cortical thickness) and microstructure (skewness of MT depth profile). In addition to the cortical
manifold expansion, we found parallel reconfigurations of subcortical connectivity patterns for the
caudate and thalamus. Decoding our findings with post-mortem gene expression maps implicated
genes enriched in adolescence and young adulthood, again pointing to both cortical as well as sub-
cortical targets. Finally, the combination of both cortical and subcortical manifold measures pre-
dicted behavioral measures of intelligence at follow-up, with higher performance than cortical or
subcortical data alone. Collectively, our findings provide new insights into adolescent structural con-
nectome maturation and indicate how multiple scales of cortical and subcortical organization can
interact in typical neurodevelopment.
Leveraging advanced manifold learning, we depicted macroscale connectome organization along
continuous cortical axes. Similar approaches have previously been harnessed to decompose micro-
structural (Paquola et al., 2019b; Paquola et al., 2019a) and functional MRI (Bethlehem et al.,
2020; Hong et al., 2019; Margulies et al., 2016; Murphy et al., 2019; Vos de Wael et al., 2020a).
These techniques are appealing as they offer a low-dimensional perspective on connectome reconfi-
gurations in a data-driven and spatially unconstrained manner. In our longitudinal study, we could
identify marked connectome expansion during adolescence, mainly encompassing transmodal and
heteromodal association cortex in prefrontal, temporal, and posterior regions, the territories known
to mature later in development (Gogtay et al., 2004; Shaw et al., 2006). Findings remained consis-
tent when we considered a linear dimensionality reduction technique, suggesting robustness to
methodological details of this analysis. Connectome expansion can be understood as an overall
greater differentiation of the connectivity of these areas from the rest of the brain as they would
then cover wider portions of the corresponding manifold space. Manifold expansion in higher-order
areas correlated with an increase in their within-module connectivity, but not with participation coef-
ficient and connectivity distance measures that would be more reflective of their between-module
connectivity. In light of potential limitations of dMRI tractography in detecting long-distance fiber
tracts (Betzel et al., 2019; Maier-Hein et al., 2017), we cannot rule out a reduced sensitivity of our
Park et al. eLife 2021;10:e64694. DOI: https://doi.org/10.7554/eLife.64694 12 of 32Research article Neuroscience
approach for the study of long-range inter-regional connections. Nevertheless, our diffusion model-
ing was based on constrained spherical-deconvolution approaches together with SIFT2-based tracto-
gram filtering, in addition to using a distance-dependent thresholding approach that may have
partially mitigated these limitations (Betzel et al., 2019). Thus, our findings do overall confirm and
extend prior dMRI studies that have focused on specific tracts and that have indicated considerable
developmental shifts in diffusion parameters, such as increases in fractional anisotropy and decreases
in mean diffusivity in early and late adolescence (Olson et al., 2009). Other studies have furthermore
reported increased streamline count estimates (Genc et al., 2020). In this context, our macroscale
manifold findings likely reflect an ongoing consolidation of transmodal cortical communities. These
findings align with prior graph-theoretical studies, which have pointed to concurrent increases in net-
work integration and consolidation of network hubs from late childhood to early adulthood
(Baker et al., 2015; Lebel and Beaulieu, 2011; Oldham and Fornito, 2019). Considering their dis-
tributed regional substrate, these network effects are likely driven by the ongoing maturation of
fiber bundles that interconnect these higher-order cortices, including superior longitudinal fascicules,
but also thalamic and basal ganglia pathways (Tamnes et al., 2010), throughout adolescence.
Projecting manifold solutions back onto cortical surfaces allowed us to integrate our connectome
manifold results with morphometric and intracortical intensity indices obtained via structural and
quantitative MRI contrasts in the same participants. We were thus able to balance the network-level
effects against trajectories of intracortical remodeling. Longitudinal changes in these cortical fea-
tures were overall in agreement with prior work, suggesting marked reductions in cortical thickness
in adolescence (Khundrakpam et al., 2017; Shaw et al., 2006), possibly reflecting synaptic pruning
processes (Petanjek et al., 2011) together with decreases in the skewness of intracortical MT pro-
files, a feature sensitive to preferential myelination of supragranular layers (Paquola et al., 2019a).
Although we still observed significant age-related changes in manifold eccentricity after controlling
for these intracortical and morphological measures, the effect sizes of our findings were reduced.
This effect was particularly evident when running a parallel analysis that additionally controlled for
depth-dependent shifts in cortical microstructure, a finding in line with more generally demonstrated
links between cortical microstructural depth profiles and inter-regional connectivity (Paquola et al.,
2019b). In the context of adolescence and prior findings in the NSPN dataset (Paquola et al.,
2019a), these results thus suggest a coupled process that affects depth-dependent shifts in cortical
myeloarchitecture, on the one hand, and adolescent shifts in macroscale connectome organization,
on the other hand, as shown by our longitudinal manifold analyses.
In addition to emphasizing a distributed set of association cortices and their cortico-cortical con-
nections, analysis of subcortico-cortical connectivity patterns highlighted parallel developmental pro-
cesses in several subcortical structures and their connections, particularly the caudate and thalamus.
These findings were independently supported by transcriptomic association studies and develop-
mental enrichment analyses, which implicated genes expressed in cortical regions and these subcor-
tical structures during late childhood, adolescence, and young adulthood. The caudate nucleus of
the striatum has long been recognized to play an important role in mediating large-scale cortical
network organization (Aglioti, 1997; Alexander and Crutcher, 1990; Graybiel, 1995), a finding
also increasingly recognized in the connectome literature (Hwang et al., 2017; Müller et al., 2020;
Shine et al., 2019). It is known to modulate activity in prefrontal association areas during memory-
driven internal thought processes (Aglioti, 1997), and higher-order cognitive functions, notably
motivational processes, decision making, as well as cognitive control and executive functions more
generally (Aglioti, 1997; Graybiel, 1995). Regions of the striatum participate in dense cortico-sub-
cortical feedback loops and exchange neural activity through dense connections with adjacent basal
ganglia structures as well as the thalamus (Aglioti, 1997; Alexander and Crutcher, 1990;
Shine, 2021). Associating macroscopic changes in manifold eccentricity with post-mortem microar-
ray data provided by the Allen Human Brain Atlas (Arnatkeviciute et al., 2019; Fornito et al.,
2019; Gorgolewski et al., 2014; Hawrylycz et al., 2015; Thompson et al., 2013), we identified
gene sets expressed in cortical regions and subcortical structures of the thalamus and striatum dur-
ing late childhood, adolescence, and young adulthood. Despite these findings being associative and
based on separate datasets, they overall support our results that brain network maturation from late
childhood until early adulthood implicates micro- and macroscale factors in both subcortical and cor-
tical networks. Coupled network and molecular changes may ultimately change subcortical and corti-
cal circuit properties, including the balance of excitation and inhibition (E/I). Human brain
Park et al. eLife 2021;10:e64694. DOI: https://doi.org/10.7554/eLife.64694 13 of 32Research article Neuroscience
development involves spatio-temporal waves of gene expression changes across different brain
regions and developmental time windows (Ip et al., 2010; Kang et al., 2011; Shin et al., 2018). In
the study of adolescent development, prior studies have suggested shifts in E/I balance, evolving
from a dominant inhibitory bias in early developmental stages towards stronger excitatory drive in
later stages, and suggested that these may underlie the maturation of cognitive functions such as
working memory and executive control (Dorrn et al., 2010; Lander et al., 2017; Liu et al., 2007). In
common neurodevelopmental disorders, including autism, schizophrenia, and attention-deficit
hyperactivity disorder, imbalances in cortical E/I and cortico-subcortical network function have been
demonstrated (Cellot and Cherubini, 2014; Gandal et al., 2018; Lee et al., 2017; Lewis et al.,
2005; Nelson and Valakh, 2015; Park et al., 2021a; Sohal and Rubenstein, 2019; Trakoshis et al.,
2020), potentially downstream to perturbations of different neurotransmitter systems, such as inter-
neuron-mediated GABA transmission (Bonaventura et al., 2017; Kilb, 2012; Liu et al., 2007;
Park et al., 2021a; Silveri et al., 2013; Trakoshis et al., 2020; Tziortzi et al., 2014).
Higher-order cognitive function implicates functionally relevant whole-brain network mechanisms,
and its prediction may thus leverage structurally governed principles of network integration and seg-
regation. Application of a supervised machine learning framework with cross-validation and regulari-
zation to our cohort demonstrated that it is possible to predict inter-individual variations in future IQ
from structural connectome manifold data. These findings complement conceptual accounts linking
brain organization to cognitive function (Margulies et al., 2016; Mesulam, 1998) and earlier efforts
to predict IQ measures from inter-regional measures of connectivity and graph-theoretical indices of
network topology (Greene et al., 2018). Notably, evaluations of several feature combinations
highlighted that predictive performance was highest when including both baseline and trajectory
data, and when complementing cortical and subcortical manifold features. These findings re-empha-
size the benefits of incorporating subcortical nodes in the characterization of large-scale cortical net-
work organization and overall cognitive function (Alves et al., 2019; Müller et al., 2020;
Shine, 2021; Shine et al., 2019). Of note, although our model significantly outperformed a baseline
model, the relationship between the actual and predicted IQ scores did not locate on the equality
line and the strength of the association was rather weak. Further improvements in brain-based IQ
prediction in adolescence, for example, through combinations of structural and functional imaging
features, will be a focus of future work.
Adolescence is a time characterized by ongoing brain changes (Baum et al., 2020; Gogtay et al.,
2004; Larsen and Luna, 2018; Menon, 2013; Shaw et al., 2006), gradually increasing indepen-
dence from caregivers, accompanied by strong increments in knowledge and our ability to think
more abstractly and to cooperate with our peers to achieve common goals. On the other hand, ado-
lescence is also a sensitive time window for risk taking, the development of addictions, and is associ-
ated with high rates of onset of several psychiatric disorders (Hong et al., 2019;
Khundrakpam et al., 2017). Our study has shown that structural brain network organization contin-
ues to mature significantly during this time period, with higher-order association cortices in prefron-
tal and posterior regions especially showing an expansion of their corresponding connectome
manifold signature. Findings were related to an increased strengthening of intra-community connec-
tivity as well as cortico-subcortical connectivity to thalamo-striatal regions. Although the current
work was restricted to a longitudinal sample of typically developing adolescents, our framework may
be useful to explore multiscale network perturbations in cohorts with a psychiatric diagnosis or those
at risk for addiction or atypical neurodevelopment.
Materials and methods
Participants
We obtained imaging and phenotypic data from the NSPN 2400 cohort, which contains question-
naire data on 2402 individuals (with MRI data on a subset of ~300) from adolescence to young adult-
hood in a longitudinal setting (Kiddle et al., 2018; Whitaker et al., 2016). The NSPN study was
ethically approved by the National Research Ethics Service and conducted in accordance with NHS
research governance standards. All participants provided informed consent in writing, with addi-
tional parental consent for participants aged less than 16 years at enrollment. Included participants
completed quality-controlled (see Data preprocessing section) multimodal MRI scans consisting of
Park et al. eLife 2021;10:e64694. DOI: https://doi.org/10.7554/eLife.64694 14 of 32Research article Neuroscience
T1-weighted, MT, and dMRI for at least two time points. Our final sample consisted of a total of 208
participants (48% female; mean [range] age = 18.82 [14–25] years at baseline and 19.95 [15–26] at
follow-up; inter-scan interval of 11.28 [6–12] months), collected from three different UK sites: Wolf-
son Brain Imaging Centre and MRC Cognition and Brain Sciences Unit in Cambridge; and University
College London. We divided the participants into template and non-template cohorts with matched
age, sex, and site ratio. The template dataset (n = 30; 50% female; mean [range] age = 18.69 [15–
24] years at baseline and 19.84 ± 2.66 [16–25] at follow-up) was used for constructing the group
mean template manifold and the non-template dataset (n = 178; 47% female; mean [range]
age = 18.84 [14–25] years at baseline and 19.97 [15–26] at follow-up) was used for conducting main
analyses. Of note, changing the template dataset composition did not markedly affect main findings
(Figure 1—figure supplement 14).
MRI acquisition
Imaging data were obtained using Siemens Magnetom TIM Trio 3T scanners. T1-weighted and MT
sequences were acquired using a quantitative multiparameter mapping sequence (repetition time
[TR]/flip angle = 18.7 ms/20˚ for T1-weighted and 23.7 ms/6˚ for MT; six equidistance echo times
[TE] = 2.2–14.7 ms; voxel size = 1 mm3; 176 slices; field of view [FOV] = 256 240 mm; matrix
size = 256 240 176) (Weiskopf et al., 2013). The dMRI data were acquired using a spin-echo
echo-planar imaging sequence (TR = 8700 ms; TE = 90 ms; flip angle = 90˚; voxel size = 2 mm3; 70
slices; FOV = 192 192 mm2; matrix size = 96 96 70; b-value = 1000 s/mm2; 63 diffusion direc-
tions; and 6 b0 images).
Data preprocessing
T1-weighted data were processed using the fusion of neuroimaging preprocessing (FuNP) pipeline
integrating AFNI, FSL, FreeSurfer, ANTs, and Workbench (Avants et al., 2011; Cox, 1996;
Fischl, 2012; Glasser et al., 2013; Jenkinson et al., 2012; Park et al., 2019), which is similar to the
minimal preprocessing pipeline for the Human Connectome Project (Glasser et al., 2013). Gradient
nonlinearity and b0 distortion correction, non-brain tissue removal, and intensity normalization were
performed. The white matter and pial surfaces were generated by following the boundaries between
different tissues (Dale et al., 1999), and they were averaged to generate the midthickness contour,
which was used to generate the inflated surface. The spherical surface was registered to the
Conte69 template with 164k vertices (Van Essen et al., 2012) and downsampled to a 32k vertex
mesh. Quality control involved visual inspection of surface reconstruction of T1-weighted data, and
cases with faulty cortical segmentation were excluded. Surface-based co-registration between T1-
weighted and MT weighted scans was performed. We generated 14 equivolumetric cortical surfaces
within the cortex and sampled MT intensity along these surfaces (Paquola et al., 2019a). The ver-
tex-wise MT profiles for each surface depth were averaged based on the Schaefer atlas with 200 par-
cels (Schaefer et al., 2018). The dMRI data were processed using MRtrix3 (Tournier et al., 2019),
including correction for susceptibility distortions, head motion, and eddy currents. We visually
inspected the quality of co-registration between the adolescence data and adult-driven surface tem-
plate as well as parcellation atlas, and all data showed reasonable registration results.
Structural connectome manifold identification
Structural connectomes were generated from preprocessed dMRI data (Tournier et al., 2019).
Anatomically constrained tractography was performed using different tissue types derived from the
T1-weighted image, including cortical and subcortical gray matter, white matter, and cerebrospinal
fluid (Smith et al., 2012). Multi-shell and multi-tissue response functions were estimated
(Christiaens et al., 2015), and constrained spherical-deconvolution and intensity normalization were
performed (Jeurissen et al., 2014). The tractogram was generated with 40 million streamlines, with
a maximum tract length of 250 and a fractional anisotropy cutoff of 0.06. Subsequently, spherical-
deconvolution informed filtering of tractograms (SIFT2) was applied to reconstruct whole-brain
streamlines weighted by the cross-section multipliers, which considers the fiber bundle’s total intra-
axonal space across its full cross-sectional extent (Smith et al., 2015). The structural connectome
was built by mapping the reconstructed cross-section streamlines onto the Schaefer 7-network
based atlas with 200 parcels (Schaefer et al., 2018) then log-transformed to adjust for the scale
Park et al. eLife 2021;10:e64694. DOI: https://doi.org/10.7554/eLife.64694 15 of 32Research article Neuroscience
(Fornito et al., 2016). We opted for this atlas as it (i) allows contextualization of our findings within
macroscale intrinsic functional communities (Yeo et al., 2011), (ii) incorporates the option to assess
results across different granularities, and (iii) aligns the current study with previous work from our
group (Benkarim et al., 2020; Paquola et al., 2020; Park et al., 2021b; Park et al., 2021a; Rodrı́-
guez-Cruces et al., 2020) and others (Baum et al., 2020; Betzel et al., 2019; Osmanlıoğlu et al.,
2019).
Cortex-wide structural connectome manifolds were identified using BrainSpace (https://github.
com/MICA-MNI/BrainSpace; Vos de Wael et al., 2020a). First, a template manifold was estimated
using a group representative structural connectome of the template dataset. The group representa-
tive structural connectome was defined using a distance-dependent thresholding that preserves
long-range connections (Betzel et al., 2019). An affinity matrix was constructed with a normalized
angle kernel, and eigenvectors were estimated via diffusion map embedding (Figure 1A), a nonlin-
ear dimensionality reduction technique (Coifman and Lafon, 2006) that projects connectome fea-
tures into low-dimensional manifolds (Margulies et al., 2016). This technique is only controlled by a
few parameters, computationally efficient, and relatively robust to noise compared to other nonlin-
ear techniques (Errity and McKenna, 2007; Gallos et al., 2020; Hong et al., 2020;
Tenenbaum et al., 2000), and has been extensively used in the previous gradient mapping literature
(Hong et al., 2019; Hong et al., 2020; Huntenburg et al., 2017; Larivière et al., 2020a;
Margulies et al., 2016; Müller et al., 2020; Paquola et al., 2019a; Park et al., 2021b; Valk et al.,
2020; Vos de Wael et al., 2020a). It is controlled by two parameters a and t, where a controls the
influence of the density of sampling points on the manifold (a = 0, maximal influence; a = 1, no influ-
ence) and t controls the scale of eigenvalues of the diffusion operator. We set a = 0.5 and t = 0 to
retain the global relations between data points in the embedded space, following prior applications
(Hong et al., 2019; Margulies et al., 2016; Paquola et al., 2019a; Paquola et al., 2019b; Vos de
Wael et al., 2020a). Briefly, the eigenvectors estimated from the decomposition technique generate
a connectivity coordinate system (Bijsterbosch et al., 2020; Haak et al., 2018; Huntenburg et al.,
2018; Margulies et al., 2016; Mars et al., 2018) – the diffusion map, where Euclidean distances in
the manifold correspond to diffusion times between the nodes of the network (Coifman and Lafon,
2006). In this manifold space, interconnected brain regions with similar connectivity patterns are
closely located, and regions with weak similarity in connectivity patterns are located farther apart.
After generating the template manifold, individual-level manifolds were estimated from the non-
template dataset and aligned to the template manifold via Procrustes alignment (Langs et al., 2015;
Vos de Wael et al., 2020a). To analyze change in the low-dimensional manifold space, we simplified
the multivariate eigenvectors into a single scalar value that is., manifold eccentricity (Figure 1B).
Manifold eccentricity was calculated as the Euclidean distance between the manifold origin and all
data points (i.e., brain regions) in manifold space. The template center was defined as the centroid
of the first three eigenvectors, which explained 50% variance. Specifically, manifold eccentricity was
defined as follows:
" #
N N N
1 X X X
CT ¼ T ðE1Þi ; T ðE2Þi ; T ðE3Þi (1)
N i¼1 i¼1 i¼1
vffiffiffiffiffiffiffiffiffiffiffiffiffiffiffiffiffiffiffiffiffiffiffiffiffiffiffiffiffiffiffiffiffiffiffiffiffiffiffiffi
u 3
uX
ME ¼ t fI ðEe Þ CT ðeÞg2 (2)
e¼1
CT is the template manifold origin, N the number of brain regions, T ðÞ the template manifold,
ME the manifold eccentricity, I ðÞ the individual manifold, and CT ðeÞ the origin of e-th template mani-
fold. Simply, as shown in Figure 1—figure supplement 15, each brain region (i.e., each dot in the
scatter plot) is described as a vector from the manifold origin (i.e., triangular mark in the scatter
plot), and manifold eccentricity is simply a length (i.e., Euclidean distance) of that vector. Shifts in
connectivity patterns of a given region thus will lead to shifts in the vectors, which in turn changes
the manifold eccentricity. Thus, manifold eccentricity quantifies global brain organization based in
the connectivity space.
Park et al. eLife 2021;10:e64694. DOI: https://doi.org/10.7554/eLife.64694 16 of 32You can also read