Climate Perspectives in the Intra-Americas Seas - MDPI
←
→
Page content transcription
If your browser does not render page correctly, please read the page content below
atmosphere
Review
Climate Perspectives in the Intra–Americas Seas
Ana María Durán-Quesada 1,2, * , Rogert Sorí 3,4 , Paulina Ordoñez 5 and Luis Gimeno 3
 1   Atmospheric, Oceanic and Planetary Physics Department & Climate System Observation Laboratory,
     School of Physics, University of Costa Rica, San José 11501, Costa Rica
 2   Center for Geophysical Research, University of Costa Rica, San José 11501, Costa Rica
 3   Environmental Physics Laboratory (EPhysLab), CIM–UVigo, Universidade de Vigo, 32004 Ourense, Spain;
     rogert.sori@uvigo.es (R.S.); l.gimeno@uvigo.es (L.G.)
 4   Instituto Dom Luiz, Faculdade de Ciências, Universidade de Lisboa, 1749–016 Campo Grande, Portugal
 5   Centro de Ciencias de la Atmósfera, Universidad Nacional Autónoma de México,
     Mexico City 04510, Mexico; orpep@atmosfera.unam.mx
 *   Correspondence: ana.duranquesada@ucr.ac.cr

 Received: 20 July 2020; Accepted: 1 September 2020; Published: 9 September 2020

 Abstract: The Intra–Americas Seas region is known for its relevance to air–sea interaction processes,
 the contrast between large water masses and a relatively small continental area, and the occurrence
 of extreme events. The differing weather systems and the influence of variability at different
 spatio–temporal scales is a characteristic feature of the region. The impact of hydro–meteorological
 extreme events has played a huge importance for regional livelihood, having a mostly negative
 impact on socioeconomics. The frequency and intensity of heavy rainfall events and droughts are
 often discussed in terms of their impact on economic activities and access to water. Furthermore,
 future climate projections suggest that warming scenarios are likely to increase the frequency and
 intensity of extreme events, which poses a major threat to vulnerable communities. In a region
 where the economy is largely dependent on agriculture and the population is exposed to the impact
 of extremes, understanding the climate system is key to informed policymaking and management
 plans. A wealth of knowledge has been published on regional weather and climate, with a majority
 of studies focusing on specific components of the system. This study aims to provide an integral
 overview of regional weather and climate suitable for a wider community. Following the presentation
 of the general features of the region, a large scale is introduced outlining the main structures that
 affect regional climate. The most relevant climate features are briefly described, focusing on sea
 surface temperature, low–level circulation, and rainfall patterns. The impact of climate variability at
 the intra–seasonal, inter–annual, decadal, and multi–decadal scales is discussed. Climate change is
 considered in the regional context, based on current knowledge for natural and anthropogenic climate
 change. The present challenges in regional weather and climate studies have also been included in the
 concluding sections of this review. The overarching aim of this work is to leverage information that
 may be transferred efficiently to support decision–making processes and provide a solid foundation
 on regional weather and climate for professionals from different backgrounds.

 Keywords: climate change; cyclones; drought; ENSO; IAS; moisture transport; rainfall; SST

1. Introduction
     The Intra–Americas Seas (IAS) region is defined as an area that includes the Gulf of Mexico and
the Caribbean Sea. Jointly with the eastern Tropical Pacific, this region integrates the water masses
enclosing Central America, Mexico, northern South America, and the Caribbean islands. From a
large–scale perspective, continental rainfall over the IAS region, including Central America, is at times
considered a part of the North American Monsoon (NAM) rainfall [1,2]. A more precise definition of

Atmosphere 2020, 11, 959; doi:10.3390/atmos11090959                         www.mdpi.com/journal/atmosphere
Atmosphere 2020, 11, 959                                                                             2 of 32

the NAM refers to north–western Mexico and Arizona, where rainfall patterns are accompanied by
the seasonal reversal of surface winds that occur along the Gulf of California [3,4]. The latter better
integrates with the classical definition of the monsoon regime, based on the annual reversal of surface
winds [5]. The NAM definition and its geographic domain have been subject to variations. An updated
definition of the NAM is based on rainfall characteristics, where its domain is considered to include
most of the IAS region [6]. In this review, the term Western North American monsoon (WNAM)
refers to the precipitation over north–western Mexico and the US southwest, to avoid confusion.
Located in tropical America, the IAS receives a decent share of incoming solar radiation, with an
average of approximately 240 Wm−2 . This energy input is the primary force underpinning large–scale
circulation patterns. The land–water configuration in the region highlights that ocean–atmosphere
coupling plays an important role in interactions that ultimately shape regional weather and climate [7].
Amongst the many dynamic and thermodynamic feedbacks relevant to regional processes, heat fluxes
are one of the main drivers accounting for energy exchange. Heat transport is far from being a
near surface parameter; in the region, it is strongly connected to the loop current, and is therefore
constrained to ocean bathymetry [8]. The sea surface temperature (SST) is characterised by the
Western Hemisphere Warm Pool (WHWP) [9], which is the second largest warm pool on Earth.
The WHWP features the seasonal SST gradients, including the seesaw between the eastern tropical
Pacific (ETPac) and the Caribbean Sea. The WHWP accounts for variations in trade winds because the
coupling between the meridional SST gradient and trade winds operates at the seasonal, inter–annual,
and decadal time scales [10]. Trade winds dominate the low–level circulation and play a relevant
role in boundary layer processes that modulate mass exchange, energy feedback, moisture transport,
cyclone development, convective activity, and rainfall distribution. The main low–level structures
in the region are the Caribbean Low–Level Jet (CLLJ) [11] and Choco Jet [12]. Their role to modulate
rainfall patterns has been widely studied [13], as well as their connectivity with large–scale features
such as the Inter–Tropical Convergence Zone (ITCZ) [14,15]. Heavy rainfall in the region is a
combination of regional and large–scale processes and features, including the so–called Mid–Summer
Drought (MSD) [16], ITCZ seasonal activity [14,17], tropical disturbances [18,19], and mesoscale
convective activity [20].
      Although some countries in the region have developed more integral economic sustainability
in the technology and services sectors, the regional economy is largely dependent on agriculture.
Agricultural production [21] accounts for a significant part of the national Gross Primary Product
(GPP), and the main exportation products include coffee, fresh fruit, and flowers [22,23]. Agriculture is
often linked with agritourism as a means of sharing the added value of sustainable production [24,25].
The dependence of regional economics on weather and climate opens up a debate on water resources
management. As water resources are highly vulnerable to the effect of hydro–meteorological extremes,
changes to water and climate increases the risk of an already distressed sector that has experienced
the pressures of trade agreements [26]. Drought has had a significant effect on Central American
and Caribbean crops as severe droughts affect approximately half of the production on average
during drought [27,28]. Heavy rainfall and associated floods also impact crops, due to their ability
to disrupt harvesting, processing, and transportation [29]. Conditions linked to El Niño–Southern
Oscillation (ENSO) events have been associated with an increase in crop diseases such as coffee rust [30].
Hydro–meteorological extremes have a profound impact on regional agriculture, compromising food
security, decreasing economic growth, affecting a large number of households that depend on major
crops, and increasing societal risk of impoverishment [31].
      Electricity generation in parts of the region relies on a steady rainfall annual cycle or the capacity
to adapt production to rainfall deficits. The regional electricity matrix is comprised of a combination of
different energy sources, including hydroelectric, wind farms, geothermal, thermal, and co–generation
with hydroelectric and thermal. Nearly 44–64% of electricity production in Central America is thermal,
with the exception of Costa Rica, where thermal production constituted 25% of the energy mix in
2010 [32]. Over the last four decades, Guatemala and Panama achieved an increase of hydropower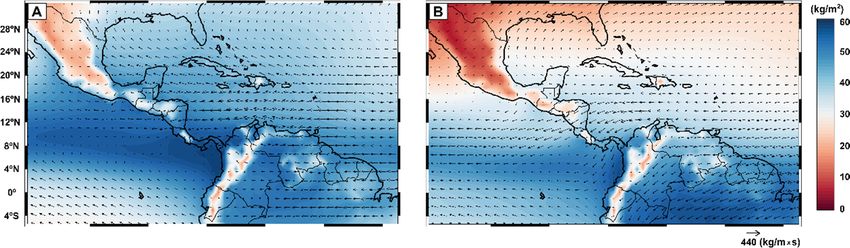
Atmosphere 2020, 11, 959 3 of 32
capacity from 2000 to 4000 GWh and 5000 GWh, respectively. Costa Rica managed to double their
hydropower capacity to nearly 7000 GWh [33]. In the Caribbean, the energy matrix is dominated by
coal, diesel, and fuel oil [34]. Central America’s plans to increase their share of renewable energy
production will need to confront the climate constraints posed to hydropower and wind farming,
with solar energy under review due to the costs and impact of cloudiness on energy generation
efficiency. In Mexico, clean energy contributed 20% of annual production (64,848 GWh) in 2016,
with hydropower representing 48% of the clean energy contribution [35]. Variability modes such
as ENSO have a global impact on hydropower generation, where El Niño events decrease annual
hydropower production in Central American dams [36]. The combination of hydrometeorological
extremes and the growing demand are part of the regional challenges for energy security, and moreover,
renewable energy production.
Access to clean water for consumption was declared a human right by the 64–292 resolution
of the United Nations General Assembly. However, clean water access is recognised as one of the
most neglected human rights [37]. In the IAS region, water pollution with contaminants such as
arsenic [38] poses an additional threat to water access. Inequitable water access has been purported
to plague Latin America and the Caribbean [39], with water–related conflicts often explored in the
drylands [40,41]. The issues for water resources for agricultural production and human consumption
have been drawn as a focal point. Under such circumstances, with scenarios that point to a reduction
in water availability [42], the most plausible scenario appears to be an exacerbation of competition for
water. Future climate projections suggest a scenario in which drylands in the Pacific coastal region are
affected by greater aridity and rainfall reduction [43]. Projections also suggest a drier Caribbean by
the end of the century [44], where a significant ecological impact is expected. A high risk of forest
loss has been recognised for Central America, due to a projected decrease in runoff, despite potential
reductions in greenhouse gas emissions [45]. Warming points to several disruptions in ecosystem
behaviours, with multi–scale impacts from functional traits [46] to population dynamics [47] and forest
resilience [48]. These circumstances highlight the importance of weather and climate, the variability
and impacts of climate change across all areas of human livelihoods, and the vulnerability of the region
as a climate change hotspot. This review aims to provide an integral overview of the climate system at
a regional scale. It seeks to contribute to a body of knowledge that will benefit a broad spectrum of
groups interested in understanding the main features of weather and climate that shape life in the IAS
and the perspectives of climate change for the region.
2. Large–Scale Climate Forcing
Regional climate is the result of interactions at multiple scales, where the large scale plays a
key role in the modulation of the easterly flow and the distribution of SST. The large scale sets the
environment for a manifold of feedbacks, with smaller scales that define the climate characteristics at
regional and local scales. We selected pressure patterns and the ITCZ to provide an overview of the
relevance of these large–scale features for regional climate.
2.1. Pressure Patterns
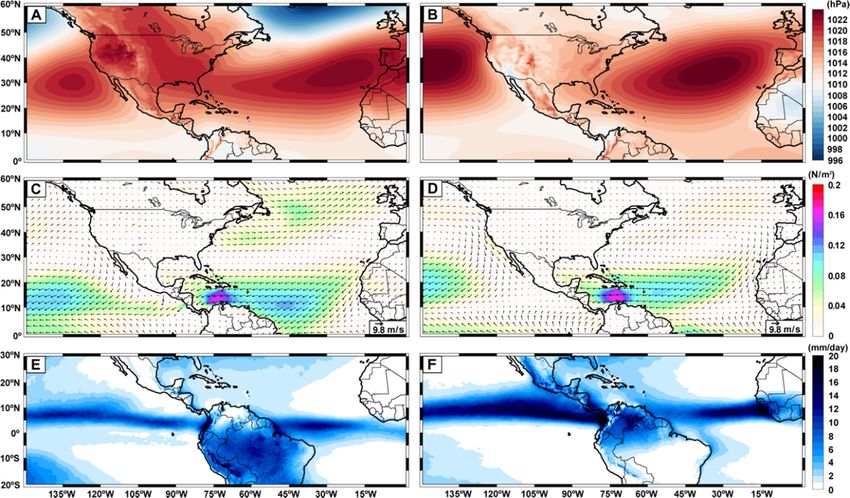
During summer, circulation in North America possesses a unique pattern with a lower tropospheric
cyclone over the continent. Figure 1 shows that it is accompanied by anticyclonic circulations over
the oceans on its western and eastern sides, the Western Pacific High (WPH) and the North Atlantic
Subtropical High (NASH) respectively, with an opposite pattern in the upper troposphere [49].
The low–level circulation in the Atlantic region is dominated by the NASH, with associated geostrophic
easterlies and south easterlies in the Gulf of Mexico. This semi–permanent feature is commonly
referred to as the Azores High or Bermuda High, in Europe and North America, respectively [50].
Focusing on the magnitude and location of the highest central pressure of the NASH [51] showed that
the anticyclone migrates in a somewhat elliptical pattern from month to month within an area bounded
by 258–408◦ N and 208–508◦ W. The upper panel in Figure 1 contrasts the high–pressure systems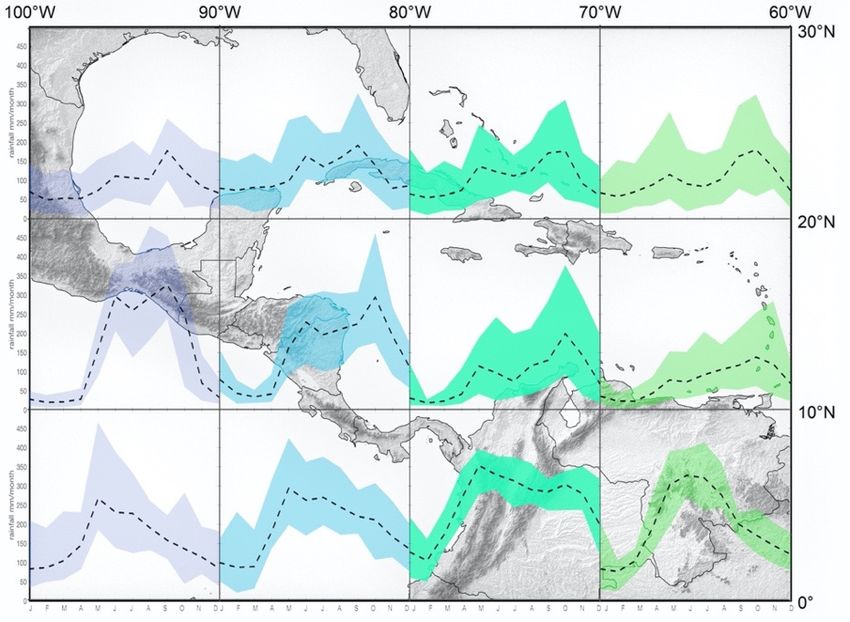
Atmosphere 2020, 11, 959 4 of 32
between summer months June–July–August (JJA) and winter months December–January–February
Atmosphere
(DJF), 2020, of
in terms 11, intensity
x FOR PEERand
REVIEW
extension. During summer, the NASH is enhanced, and its western 4 of 33
ridge extends to the south–eastern US [52], inducing a strong easterly flow across the Caribbean.
flow across the Caribbean. This flow supplies warm and humid air to feed large–scale precipitation
This flow supplies warm and humid air to feed large–scale precipitation over tropical and subtropical
over tropical and subtropical North America [53]. The strength and orientation of the western ridge
North America [53]. The strength and orientation of the western ridge of the NASH plays an important
of the NASH plays an important role in modulating the intra–seasonal variability of summer rainfall
role in modulating the intra–seasonal variability of summer rainfall over the IAS, characterised by
over the IAS, characterised by coupling with marine boundary layer clouds [54]. The circulation
coupling with marine boundary layer clouds [54]. The circulation associated with the most westward
associated with the most westward extension of the NASH during July and August is linked with the
extension of the NASH
MSD (described during
in Section Julythrough
3.4.1), and August is linked with
the reinforcement the MSD (described
of low–level anticyclonicinflow
Section
over 3.4.1),
the
through the reinforcement
Gulf of Mexico [55]. of low–level anticyclonic flow over the Gulf of Mexico [55].
Figure
Figure 1. 1.Mean
Mean Sea–Level
Sea–Level Pressure
Pressurefor for(A) DJF
(A) andand
DJF (B) (B)
JJA. JJA.
10 m10
wind vectorsvectors
m wind and zonal
andwind
zonalshear
wind
(shaded)
shear for (C)
(shaded) forDJF
(C) and
DJF(D)
andJJA
(D)and
JJAaverage rainfallrainfall
and average for (C) January and (D) July
for (C) January and respectively, for the
(D) July respectively,
for1979–2019 period
the 1979–2019 based
period on fifth
based generation
on fifth generationof the European
of the European Centre
Centreforfor
Medium–Range
Medium–Range Weather
Weather
Forecasts atmospheric reanalyses of the global climate (ERA5) data. Both (A) and
Forecasts atmospheric reanalyses of the global climate (ERA5) data. Both (A,B) show the contrasting (B) show the
contrasting seasonal expansion of the North Atlantic Subtropical High (NASH) western
seasonal expansion of the North Atlantic Subtropical High (NASH) western ridge. Surface winds show ridge. Surface
thewinds show of
coherence thethe
coherence of the
large–scale large–scale
circulation circulation
with with the
the pressure pressure
patterns andpatterns and
the area thefeatures
that area thatthe
features the Caribbean Low–Level Jet (CLLJ) is observed as a maximum of zonal wind shear.
Caribbean Low–Level Jet (CLLJ) is observed as a maximum of zonal wind shear. Complimentary (E)
Complimentary (E) and (F) show the long–term average daily regional rainfall distribution. Based on
and (F) show the long–term average daily regional rainfall distribution. Based on this, the seasonal
this, the seasonal migration of the Inter–Tropical Convergence Zone (ITCZ) may be observed,
migration of the Inter–Tropical Convergence Zone (ITCZ) may be observed, including its effect over
including its effect over continental rainfall, contrasting drier conditions overland in January.
continental rainfall, contrasting drier conditions overland in January.
The western ridge position of the NASH is associated with subsidence and clear skies, which
The western ridge position of the NASH is associated with subsidence and clear skies, which makes
makes the movement of cyclones difficult. However, when the NASH western ridge is located to the
the movement of cyclones difficult. However, when the NASH western ridge is located to the southwest
southwest of its summer climatological mean position, precipitation over the south–eastern US
of its summer climatological mean position, precipitation over the south–eastern US increases with
increases with enhanced moisture transport from adjacent tropical oceans [56]. Variations in
enhanced moisture transport from adjacent tropical oceans [56]. Variations in precipitation located at
precipitation located at the periphery of subtropical high systems have marked impacts on local
thecirculation
periphery of subtropical high systems have marked impacts on local circulation and the evolution of
and the evolution of nearby weather systems. However, there have been few
nearby weather systems.
observational studies onHowever, therein
precipitation have been
areas few observational
dominated studies
by subtropical on precipitation
highs, mainly due to in the
areas
dominated by subtropical highs, mainly due to the limited availability of well–matched
limited availability of well–matched measurements. Limited impacts on local precipitation due to measurements.
Limited impacts
prevailing on local high
subtropical precipitation due
conditions to prevailing
have subtropical
been observed. hightoconditions
According Reference have been observed.
[57], precipitation
According
was onlyto30% Reference
lower [57],
underprecipitation
the NASH was only 30%
conditions lower
than underunder the NASH
non–NASH conditions
conditions. than under
Whilst the
non–NASH
impact of the conditions. Whilst the
NASH conditions onimpact
rainfallofintensity
the NASH wasconditions on still
larger, it was rainfall
50% intensity
less than was larger,
intensity
it was
understillnon–NASH
50% less than intensityPrecipitation
conditions. under non–NASH under the conditions.
NASH was Precipitation under the
highly correlated withNASH
verticalwas
highly
motioncorrelated
as activewith vertical motion
up draughts, as active
occurring up draughts,
even under occurring
subtropical even under
high conditions. subtropical
In recent decades,high
the NASH has been documented to intensify, causing a westward movement of its western ridge in
summer. The northern hemisphere subtropical highs have been determined to intensify under
Atmosphere 2020, 11, 959                                                                             5 of 32

conditions. In recent decades, the NASH has been documented to intensify, causing a westward
movement of its western ridge in summer. The northern hemisphere subtropical highs have been
determined to intensify under warming conditions [58]. Changes in the seasonal response of rainfall to
the NASH have been found to be associated with anthropogenic warming [59]. Under a warming
scenario, state–of–the–art global climate models have projected that the NASH becomes more intense,
with its western ridge moving further westward [60]. An intensified NASH and its westward expansion
may enhance hydro–climate extremes such as heat stress and droughts in the south–eastern US [61]
and is likely to affect summer precipitation in the IAS region.

2.2. Large–Scale Circulation
       The low–level circulation in the tropics is driven by the ascending branch of the Hadley circulation
as a result of latitudinal heating gradients and plays a major role for the poleward transport of heat.
The analysis of the so–called trade winds and the overall global circulation goes back to the 18th
century [62]. Near the equator, moist and warm tropical air rises until reaching the subtropics, where it
descends towards the equator near the surface [63]. In the region, the circulation is featured by
the dominating easterlies, as shown in Figure 1, middle panel. Low–level winds are forced by SST
gradients and their strength is highly sensitive to SST changes [64]. Energy and mass exchange can be
described by the relationship between SST and winds. The vertical velocity, which is responsible for
the energy and mass transfer, is forced by diabatic heating and at the same time, the vertical velocity
drives the large–scale flow within the boundary layer [65]. As a result, changes in the large–scale flow
are a response to near surface heating and therefore, surface winds are driven by SST. Despite the
relative simplicity, this interaction is highly complex as it involves a series of non–linear feedbacks.
Further interactions between the lower atmosphere and the ocean surface can be described in terms
of footprinting mechanisms. The latter is given as the tropical atmosphere is also sensitive to the
subtropical SST response to atmospheric variability at different time lags [66]. Here, we highlight the
fact that SST–atmosphere connectivity is not only local, and it is featured by mid–latitude tropical
feedbacks as well. This is relevant to better understand that the large–scale motions and variability
can be triggered by non–local interactions. A good example is the case of ENSO, for which extra
tropical precursors have been identified [67]. Another way to consider the role of surface processes
in the region is by means of the wind stress, given the sensitivity of the tropical circulation to this
variable. Wind stress corresponds to the force (per unit area) that the airflow exerts over a surface
and is a measure of the transfer of momentum between the atmosphere and the ocean, and therefore
provides a quantitative estimate of the air–sea coupling [68]. Wind stress plays a major role as a key
mechanism to trigger instabilities [69] as well as influence rainfall [70]. The different mechanisms and
interactions acting in the region are fundamental to determine the characteristics of rainfall. In fact,
it is the large scale that defines one of the most relevant structures associated to rainfall, as explained
in the next subsection.

2.3. ITCZ
      The ITCZ is a near–equatorial band of intense rainfall that extends longitudinally and can easily
be identified as a cloud band over the tropics. The ITCZ describes a meridional migration that
responds to the Earth’s orbit, as shown for January and July in Figure 1 (lower panel), when the ITCZ
is located at its lowest and highest meridional positions, respectively. This seasonal migration is crucial
as the meridional position modulates the distribution of rainfall over land and ocean. In addition
to seasonal migration, the mean position north of the equator is a result of cross–equatorial heat
transport from ocean circulation [71]. The position of the ITCZ depends on atmospheric energy balance,
whereby small changes in the energy flux can lead to larger departures from its mean position [72].
The responsiveness of the ITCZ position to temperature changes is not restricted to the tropical domain.
Changes at higher latitudes may also induce the asymmetric thermal forcing that leads to ITCZ
displacements. The extratropical SSTs over the Southern Atlantic Ocean play an important role in the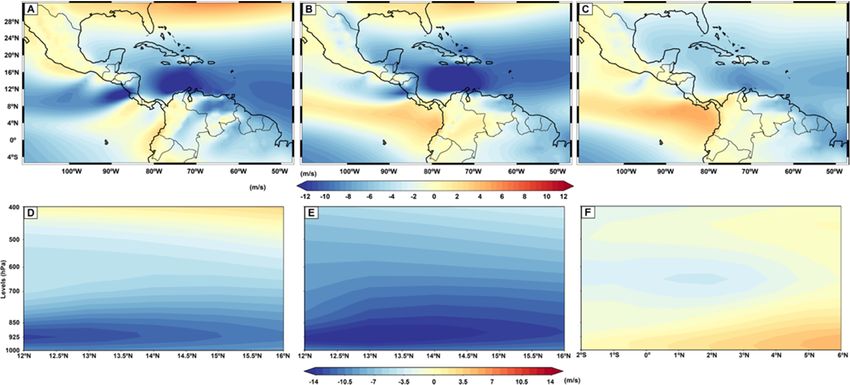
Atmosphere 2020, 11, 959                                                                           6 of 32

northern position of the ITCZ [73]. The ITCZ is connected with large–scale processes that modulate
rainfall in several regions. Its impact over Africa is mostly associated with rainfall over the southern
Sahara and northernmost Sahel [74]. For the South American climate, it is linked with Amazon
rainfall through complex interactions with convectively coupled Kelvin waves [75]. During DJF,
inter–hemispheric teleconnection is activated by vertical wind shear over tropical South America and
the western South Atlantic [76]. This facilitates the enhancement of the ITCZ convection over northern
South America. The connection with South American topography shows that the ITCZ southern
branch feature has feedback with the Andes cordillera, modulating precipitation over the tropical
Pacific [77]. Over Colombia, the ITCZ increases rainfall for one of the rainiest places on Earth—the
Lloró [12]. For Central America, the ITCZ is a dominant feature of the annual hydrologic cycle and
modulates moisture transport from the eastern tropical Pacific [78,79]. Further interactions between
the ITCZ and the CLLJ have been found to partially trigger a displacement of the ITCZ centre of
mass, ultimately spreading the rainfall distribution [14]. Given the relevance of the ITCZ position for
rainfall distribution, changes that may impinge variations in atmospheric energy balance are crucial to
understanding how anomalous migrations of the ITCZ may affect rainfall. The influence of the ENSO is
one of the most researched connections to the ITCZ anomalous meridional shifting. ENSO may increase
the wind stress over the western equatorial Atlantic, modifying Atlantic equatorial ocean dynamics
and providing a mechanism to couple rainfall pattern changes with ITCZ movements [80]. Over the
IAS, the ENSO has been associated with a westward movement of the ITCZ, decreasing rainfall activity
over the Pacific coast and increasing dry conditions.

3. Regional Climate Features

3.1. WHWP
      SST gradients between the Caribbean and the eastern tropical Pacific play a role in rainfall
distribution [81]. The regional SST is characterised by the WHWP, a warm pool defined as the area
enclosed by the 28.5 ◦ C isotherm that exhibits a marked seasonal cycle [9]. Its role in regional climate
is strongly linked to heat balance [82]. The evolution of WHWP components, namely the eastern
Pacific (EPWP) and Atlantic (AWP), may be considered independent as they respond to different
mechanisms, with the former being characterised by its subsurface oceanic dynamics [83]. The EPWP
develops earlier than the AWP, and its onset is seasonally synced with coastal shoaling that marks the
development of the Costa Rica Dome (CRD) [84] after March. There is an amplification of its spatial
extension across the Central American Pacific coast as far as 120 W on average, until August [85].
In addition to enclosing the biologically important CRD, the EPWP modulates Central American
rainfall, triggering deep convection. It is connected with the ITCZ and further activation of intense
deep convection [86] as well as cyclone development [87]. Its Atlantic counterpart starts its onset in
June and continues expansion to the southern Caribbean by September, with a peak between July
and September. The development of the AWP is mainly constrained by boundary layer coupling and
modulated by air–sea heat fluxes [88]. Warm waters enclosed by the AWP provide a major part of
the moisture transported within the region, playing a relevant role in rainfall contribution [79,89].
The AWP acts as a moisture supplier to the NAM in connection with the bridge established between
the CLLJ and the Great Plains low–level jet [90]. The AWP is important in terms of its regional
dynamics beyond its role as a moisture source, as regional rainfall is dependent on the AWP extension.
Anomalous extensions of the AWP are associated with a milder MSD, while a smaller AWP enhances
the MSD, increasing drier conditions over the Central American Pacific coast [91]. The AWP influences
the cyclone development season [92], and the enlargement of the AWP corresponds to a reduced
vertical wind shear, which allows an intensification of Atlantic hurricane activity. The activity of both
components of the WHWP are responsive to interannual variability [93]. Temperature changes in the
WHWP area impose a modulation in the WHWP dynamics, impacting on rainfall. Under a warming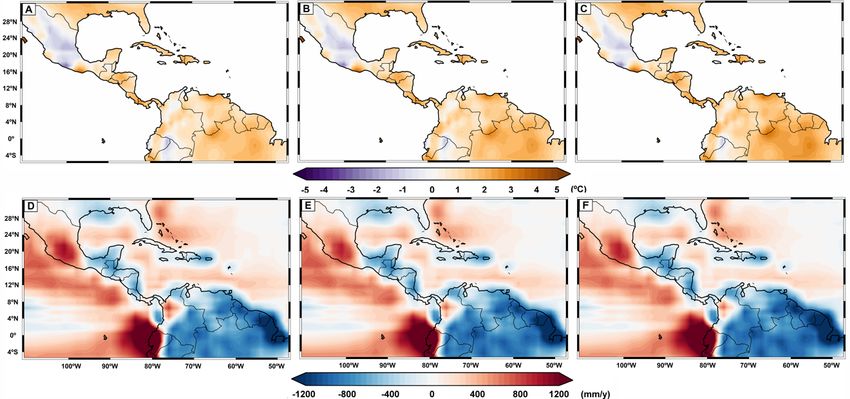
Atmosphere 2020, 11, 959 7 of 32
climate, temperature changes are predicted to cause variations in warm pool extensions and trigger
variations in the rainfall distribution within the IAS domain.
3.2. Low–Level Circulation
The IAS circulation is dominated by the descending branch of the Hadley cell, and the low–level
flow is controlled
Atmosphere 2020, 11, xby
FORtrade winds. In the regional context, low–level jets (LLJs) are fundamental
PEER REVIEW 7 of 33
mechanisms to modulate the regional climate and inter–hemispheric interactions. Globally, LLJs are
mechanisms
known to modulate
to be connecting the regional climate
to background and inter–hemispheric
circulations, modulating waterinteractions.
vapour supply Globally, LLJs
during are
extreme
known to be connecting to background circulations, modulating water vapour
events, and inducing variations in the cyclone development potential through wind shear control. supply during
extreme
LLJs may be events, and inducing
classified based onvariations
wind speed in the
andcyclone
heightdevelopment
as boundarypotential through
layer (height windhPa)
< 850 shear and
control. LLJs may be classified based on wind speed and height as boundary
free atmosphere (600 < height < 850). The free atmosphere LLJs influence synoptic systems layer (height < 850 hPa) and
and free atmosphere (600 < height < 850). The free atmosphere LLJs influence synoptic systems and
boundary layer LLJs modulate the synoptic and high–low–pressure transitioning systems [94]. In the
boundary layer LLJs modulate the synoptic and high–low–pressure transitioning systems [94]. In the
region, the main low–level structures are the CLLJ and the Choco jet, whereas the development of
region, the main low–level structures are the CLLJ and the Choco jet, whereas the development of
smaller–scale features results from interactions between the easterly flow and regional topography.
smaller–scale features results from interactions between the easterly flow and regional topography.
This wind–topography interaction allows the seasonal development of gap winds over Tehuantepec,
This wind–topography interaction allows the seasonal development of gap winds over Tehuantepec,
Papagayo, and Panama (as observed from the blue shaded regions on the Pacific coast shown for
Papagayo, and Panama (as observed from the blue shaded regions on the Pacific coast shown for
January
JanuaryandandFebruary
FebruaryininFigure
Figure2).
2).These
These gap
gap winds are important
winds are importanttotoenhance
enhanceoffshore
offshore upwelling
upwelling in in
thethe
easternmost
easternmost tropical Pacific and have a relevant biological role. Here, we focus on the CLLJ andthe
tropical Pacific and have a relevant biological role. Here, we focus on the CLLJ and
Choco jet as the
the Choco two
jet as themost prominent
two most features
prominent of low–level
features circulation
of low–level in the
circulation region.
in the region.
Figure
Figure 2. 2. Meanzonal
Mean zonalwind
windinin925
925hPa
hPa for
for (A)
(A) January, (B)
(B) July,
July, and
and (C)
(C)October.
October.The Themean
meanannual
annual
vertical
vertical cross–section(1000–400
cross–section (1000–400hPa)
hPa) for 80°◦ W–70°
for 80 W–70◦ WWfrom
from12°12◦NNtoto16° ◦ N
16N forfor
(D)
(D)January, (E)(E)
January, July,
July,
and (F) mean annual vertical cross–section (1000–400 hPa) for
◦ 90° W–80°
◦ W from
◦
and (F) mean annual vertical cross–section (1000–400 hPa) for 90 W–80 W from 2 S–6 N for October. 2°
◦ S–6° N for
October.
Data Data from ERA5.
from ERA5.
3.2.1. CLLJ
3.2.1. CLLJ
The The CLLJ
CLLJ [11,94]
[11,94] is defined
is defined as as
anan intensification
intensification of of
thethe easterly
easterly flow
flow at at approximately
approximately ◦ NN
12–15°
12–15 and
75–70 ◦
and 75–70°
W, withW, with maximum
maximum wind speeds
wind speeds reaching reaching
12 ms 12−1 . Itms
has. It
−1 has a marked
a marked annualannual cycleawith
cycle with a
primary
primary maximum between July (Figure 2B) and August, a secondary peak
maximum between July (Figure 2B) and August, a secondary peak between January (Figure 2A) and between January (Figure
2A) andand
February, February, and ain
a minimum minimum
October in October
(Figure 2C).(Figure
During 2C).
theDuring the secondary
secondary peak,
peak, the jet corethe jet core is
is constrained
constrained
below 925 hPabelow 925
(Figure hPawhereas
2D), (Figure 2D), whereas
for the primary for peak,
the primary peak,
the core the core
extends up extends up toas700
to 700 hPa, hPa, in
shown
as shown in Figure 2E [95]. This difference is important, as during the July
Figure 2E [95]. This difference is important, as during the July to August maximum, the CLLJ has to August maximum, thean
CLLJ has an extended connection as a free atmosphere LLJ, allowing interactions with circulations at
extended connection as a free atmosphere LLJ, allowing interactions with circulations at higher levels.
higher levels. In contrast, during the secondary maximum, the CLLJ is largely constrained to act
In contrast, during the secondary maximum, the CLLJ is largely constrained to act within the boundary
within the boundary layer domain, and its interactions have greater limitation. One of the main
layer domain, and its interactions have greater limitation. One of the main contributions of the CLLJ is
contributions of the CLLJ is as a regional moisture conveyor associated with rainfall over Central
as a regional moisture conveyor associated with rainfall over Central America, northern South America,
America, northern South America, and the Great Plains region [78,79]. The connectivity with the free
and the Great Plains region [78,79]. The connectivity with the free atmosphere as the CLLJ reaches
atmosphere as the CLLJ reaches the primary maximum provides a bridge that allows its interaction
thewith
primary maximum
the ITCZ. provides
The latter allowsathebridge that allows
modulation its interaction
of regional with thethe
rainfall through ITCZ. The latterofallows
displacement the
ITCZ meridional position [14]. Variations in the vertical structure of the CLLJ during boreal summer
months regulate cyclone activity in the tropical Atlantic, with an enhanced CLLJ increasing the wind
shear that suppresses cyclone formation [96]. Furthermore, the CLLJ plays a determinant role in the
development and intensification of easterly waves [97]. The CLLJ is subject to variability at different
time scales. At high frequencies, the CLLJ is a more efficient mechanism to transfer the influence of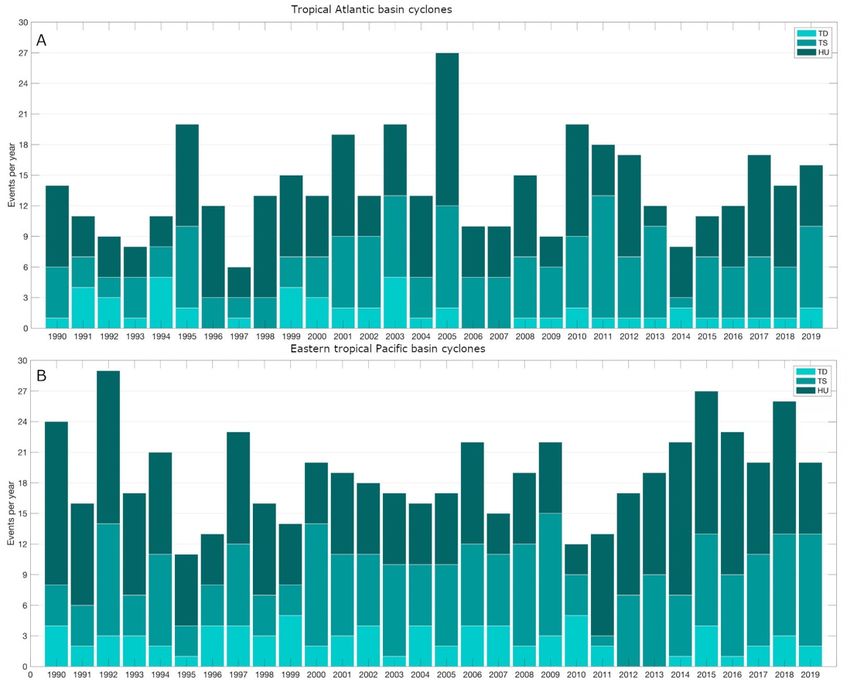
Atmosphere 2020, 11, 959                                                                            8 of 32

the modulation of regional rainfall through the displacement of the ITCZ meridional position [14].
Variations in the vertical structure of the CLLJ during boreal summer months regulate cyclone activity
in the tropical Atlantic, with an enhanced CLLJ increasing the wind shear that suppresses cyclone
formation [96]. Furthermore, the CLLJ plays a determinant role in the development and intensification
of easterly waves [97]. The CLLJ is subject to variability at different time scales. At high frequencies,
the CLLJ is a more efficient mechanism to transfer the influence of the Madden–Julian Oscillation
(MJO) to the easterly wave dynamics over the eastern Pacific [98]. At inter–annual scales, the ENSO is
the variability mode linked to the larger impact for the CLLJ, as warm (cold) ENSO conditions are
related to a stronger (weaker) CLLJ during JJA. The relationship between ENSO and CLLJ is different
for DJF and JJA [11,95]. This has further implications for rainfall patterns for a number of reasons.
First, anomalous moisture transport is enhanced such that during the first stage of the rainy season,
the Caribbean moisture source is diminished, while transport for Central America becomes stronger
during the primary maximum [79]. Second, the ITCZ position is shifted, and third, the wind shear
reduces the potential for cyclone formation. The increase in moisture supply does not necessarily
cause wetter conditions as the instabilities required for convection to activate are weakened by intense
winds, and the ITCZ also shifts away to the ocean [79].

3.2.2. Choco Jet
     The Choco jet is often studied for its association with heavy rainfall patterns, making north–western
Colombia one of the rainiest regions on Earth. The Choco jet was first introduced as an extension
of the south–westerly cross–equatorial flow in Reference [99]. The annual cycle of the Choco jet is
defined by the regional SST gradient, which allows the Choco jet to transition from its weakest intensity
during February–March to its peak in October [12]. In contrast to the CLLJ, the Choco jet exhibits
only one peak, and its intensity is nearly half the CLLJ maximum intensity at its primary maximum.
The Choco jet structure is confined below 850 hPa, so that the Choco jet may be considered a purely
boundary layer LLJ. Although, it has often been analysed in terms of an intensity index defined as the
longitudinal average of wind speed, as that the Choco jet also exhibits meridional displacement [15].
This has been traditionally neglected in previous generation reanalysis, as a coarse resolution reanalysis
does not adequately reproduce this feature. Variations in the meridional positioning of the jet core
are important, as shifting may modulate moisture transport and disrupt interactions with other
systems, creating an impact on rainfall distribution. The Choco jet advects moisture from the eastern
tropical Pacific, which largely dominates the hydro–climatology of northern South America [100–102].
Moisture supply from the Choco jet is also important for the Central American Pacific coast [78,79,103].
The relevance of the Choco jet is not restricted to moisture transport, as the Choco jet is also connected
with deep convective development over the region [104]. Connectivity between the Choco jet and
deep convection is complex and involves interactions with the ITCZ, and this may be connected
to the meridional positioning of the jet core [15]. A recent experimental campaign was conducted
to investigate the dynamics of the Choco jet and its role in regional rainfall. CHOCO–JEX was
developed as an inter–institutional effort led by Colombia to assess the observational aspects of Choco
jet dynamics [105]. The effect of inter–annual variability on the Choco jet was a decrease in intensity
during warm ENSO conditions, with a corresponding rainfall decrease [106]. The ENSO modulates
rainfall extremes, where warm ENSO is linked with drying and a cold ENSO is associated with
heavy rainfall via moisture transport enhancement, as per the 2010–2012 anomalous wet season [101].
The Choco jet response to the ENSO is the inverse of the response from the CLLJ. This also explains the
wetter conditions during the cold ENSO over the Pacific coast of Central America where the Pacific
moisture supply had increased [79].

3.3. Moisture Transport
     Moisture transport in the IAS is often discussed in terms of the WNAM [107], where rainfall
is favoured by moisture transport from the Gulf of Mexico, with the eastern tropical Pacific,
Atmosphere 2020, 11, 959 9 of 32
Caribbean Sea, and the Gulf of Mexico playing a minor role [108]. An accurate quantification
of evapotranspiration and moisture recycling is constrained by the complex surface and observational
data availability [109,110]. Moisture source diagnostics, related to the NAM and WNAM, have been
performed using observations [111], reanalysis, [112], modelling [113], and the combination of water
vapour tracers–enabled models and water–stable isotopes [4,114]. Despite the association of the IAS
for WNAM development, based on the connection between the GPLLJ and the CLLJ, the IAS waters
also play a key role. Complimentarily, here, we focus in moisture transport over the IAS.
Figure 2020,
Atmosphere 3A shows
11, x FORthe maximum
PEER REVIEW of vertically integrated water vapour during the rainiest period 9 of 33 of
the year, which reduces during the dry season despite still maintaining a good amount of moisture in
theinsouthernmost
the southernmost partpart of the
of the IAS IAS (Figure
(Figure 3B).The
3B). Themechanisms
mechanisms for regional
regionalmoisture
moisturetransport
transport have
have
long been explored. A northward transport of moisture across the ◦
20° N latitude
long been explored. A northward transport of moisture across the 20 N latitude with a southward shift with a southward
shift of minimum
of minimum moisture moisture
transport transport
duringduring the boreal
the boreal autumn autumn was identified
was identified in Reference
in Reference [115].[115]. The
The results
results of studies
of previous previous studies
have have highlighted
highlighted the relevance
the relevance of LLJs
of LLJs and and the
the ITCZ to ITCZ to modulate
modulate moisture moisture
transport
andtransport
rainfall and rainfall
[116]. [116]. The Caribbean
The Caribbean Sea is theSeamainis the mainofsource
source of moisture
moisture for Central
for Central AmericanAmerican
rainfall,
whilst concurrently modulating regional moisture transport dynamics. Transport from from
rainfall, whilst concurrently modulating regional moisture transport dynamics. Transport this
this source
source is very efficient and transport peaks between 4 to 6 days [79]. An independent
is very efficient and transport peaks between 4 to 6 days [79]. An independent analysis of moisture analysis of
moisture transport using physical tracers [117] showed consistency of previous backward trajectories
transport using physical tracers [117] showed consistency of previous backward trajectories and vertical
and vertical integrated moisture flux–based analysis. The Caribbean Sea contributes to rainfall in
integrated moisture flux–based analysis. The Caribbean Sea contributes to rainfall in northern South
northern South America with descending flow from the CLLJ that connects to a low–level structure
America with descending flow from the CLLJ that connects to a low–level structure in the Venezuelan
in the Venezuelan plains [101,102]. Continental sources of moisture for Central America are identified
plains [101,102]. Continental sources of moisture for Central America are identified as local moisture
as local moisture recycling and northern Colombia, with the latter allowing connectivity with the
recycling
Amazonandtonorthern
enhance Colombia, with the latter
inter–hemispheric allowing
bridges. connectivity
However, thewith the Amazon of
quantification to enhance
local
inter–hemispheric bridges. However, the quantification of local evapotranspiration
evapotranspiration and its role in recycling remains an open problem, limited by data scarcity and its role
and in
recycling remains
surface complexity. an open problem, limited by data scarcity and surface complexity.
Figure
Figure 3. 3.
MeanMean totalcolumn
total columnwaterwatervapour
vapour (shaded)
(shaded) and
and the
the vertically
verticallyintegrated
integratedwater
watervapour
vapourfluxflux
(arrows) for (A) May–October and (B) November–April for the 1979–2019 period
(arrows) for (A) May–October and (B) November–April for the 1979–2019 period based on ERA–5 data. based on ERA–5
data.moisture
A high A high moisture
contentcontent was observed
was observed betweenbetween MayOctober
May and and October
with with transport
transport mostly
mostly directed
directed along
along the storm track, following the development of the meridional branch of the CLLJ.
the storm track, following the development of the meridional branch of the CLLJ. In contrast, a reducedIn contrast, a
reduced moisture content is featured in the November–April period. Here, transport is
moisture content is featured in the November–April period. Here, transport is directed across Centraldirected across
Centralwith
America, America, with the cross–isthmus
the cross–isthmus transporttransport characteristics
characteristics of season.
of a drier a drier season.
Moisture
Moisture transportisissensitive
transport sensitivetoto the
the variability
variability modes
modesthat
thatdrive
drivechanges
changes inin
the
theSST and
SST LLJs.
and LLJs.
The moisture supply response to the ENSO is modulated by the response of the
The moisture supply response to the ENSO is modulated by the response of the CLLJ and the ChocoCLLJ and the Choco
jet,jet,
so so that moisture supply decreases (increases) from the Caribbean (eastern tropical Pacific, ETPac)
that moisture supply decreases (increases) from the Caribbean (eastern tropical Pacific, ETPac)
during the first stage of the rainy season. It is then enhanced from the Caribbean between July and
during the first stage of the rainy season. It is then enhanced from the Caribbean between July and
September and decreases from the ETPac in August [79]. The role of anomalous moisture transport
September and decreases from the ETPac in August [79]. The role of anomalous moisture transport
during ENSO events has also been confirmed by changes observed using modelling [118] and
during ENSO events has also been confirmed by changes observed using modelling [118] and physical
physical tracers [119]. The effect of the North Atlantic Oscillation (NAO) has been suggested to have
tracers [119]. The effect of the North Atlantic Oscillation (NAO) has been suggested to have a more
a more significant impact on the structure of moisture transport directly acting over the CLLJ rather
significant
than the impact
intensityonofthe structure
moisture of moisture
sources transport directly
in the Caribbean. This hasacting over the
an overall CLLJ
effect rather than
of increasing
thetransport
intensitytoofCentral
moisture sources in the Caribbean. This has an overall effect of increasing
America during NAO negative phases. In this sense, the location at which transport
the
to maximum
Central America
transportduring
arrivesNAO negative
is also modulated phases. In this sense,variations.
by NAO–induced the location
At at which
lower the maximum
frequencies, the
transport
impact of the PDO consists of an intensified ENSO pattern that induces a further weakening of
arrives is also modulated by NAO–induced variations. At lower frequencies, the impact
(enhancement) of moisture transport from the Caribbean (ETPac) during the first stage of the rainy
season. At higher frequencies, the MJO dominates transport variability as it acts as a force for the
CLLJ. Its effect on moisture transport consists of a strong intensification of moisture supply during
the rainy season for negative values of MJO–filtered Outgoing Longwave Radiation, strengthening
an easterly wave–like pattern moving to the west [118]. The main impact of moisture transportAtmosphere 2020, 11, 959 10 of 32
the PDO consists of an intensified ENSO pattern that induces a further weakening (enhancement) of
moisture transport from the Caribbean (ETPac) during the first stage of the rainy season. At higher
frequencies, the MJO dominates transport variability as it acts as a force for the CLLJ. Its effect on
moisture transport consists of a strong intensification of moisture supply during the rainy season for
negative values of MJO–filtered Outgoing Longwave Radiation, strengthening an easterly wave–like
pattern moving to the west [118]. The main impact of moisture transport variability is the modulation
of regional rainfall distribution. This has motivated the quest for a better understanding of transport
Atmosphere 2020, 11, x FOR PEER REVIEW 10 of 33
dynamics to improve forecasting capabilities and better interpret projected future climate scenarios.
3.4.3.4. Rainfall
Rainfall
The regional distribution of rainfall is defined by moisture transport, the migration of the ITCZ,
The regional distribution of rainfall is defined by moisture transport, the migration of the
cyclone development, passage of tropical disturbances, mesoscale convective systems (MCS)
ITCZ, cyclone development, passage of tropical disturbances, mesoscale convective systems (MCS)
development, and mid–latitude interactions (e.g., cold surges). On average, rainfall distribution is
development, and mid–latitude interactions (e.g., cold surges). On average, rainfall distribution is
bimodal with a marked dry season and the reduction of rainfall during the peak of the CLLJ in July
bimodal with a marked dry season and the reduction of rainfall during the peak of the CLLJ in July
(see area averages in Figure 4). This bimodal distribution is more prominent on the Pacific coast, as
(seemoist
area air
averages
flow fromin Figure 4). Thisinteracts
the Caribbean bimodalwith
distribution is more
the mountain prominent
range, and the on the Pacific
Caribbean slopecoast,
is
as moist air flow from the Caribbean interacts with the mountain range, and the
wetter in contrast with a drier Pacific slope. Complementary rainfall over the Caribbean Caribbean slopeis is
wetter in contrast
dynamically with a drier
influenced by Pacific slope.Interactions
the Pacific. Complementary rainfall
between both over
waterthe Caribbean
masses driveisfluctuations
dynamically
influenced
observedbyin therainfall
Pacific. patterns
Interactions between
[120] and areboth water masses
modulated by drive fluctuations
large–scale observed
pressure in rainfall
patterns and
patterns [120] and are modulated
temperature gradients [121]. by large–scale pressure patterns and temperature gradients [121].
◦ 10◦ areas
Figure 4. Average
Figure annual
4. Average cycle
annual cycleofofrainfall
rainfallfor
forcontiguous 10° ×
contiguous 10 × 10° areasas
asshown
shownininthe
theboxes
boxes based
based
on on
monthly Global Precipitation Measurement (GPM) for the 2001–2019
monthly Global Precipitation Measurement (GPM) for the 2001–2019 period. period.
3.4.1. Rainfall Distribution and the MSD
3.4.1. Rainfall Distribution and the MSD
The
Theannual
annualrainfall
rainfallcycle
cycleisisstrongly
stronglycontrolled
controlled by
by the migrationof
the migration ofthe
theITCZ.
ITCZ.The Thecentral
central and
and
western Colombian annual precipitation cycle results from the passage of the
western Colombian annual precipitation cycle results from the passage of the ITCZ. This consists ofITCZ. This consists
of distinct rainy seasons
distinct rainy seasons (April–May
(April–Mayand and October–November)
October–November)and anddrier
drierororless
lessrainy
rainyconditions
conditions
(December–February
(December–February and June–August) [122,123]. From the northern Caribbean coast of Colombia to to
and June–August) [122,123]. From the northern Caribbean coast of Colombia
southern
southernMexico,
Mexico,thetherainfall
rainfallannual
annualcycle
cycleisisdominated
dominated by a relatively
relativelydry
dryseason
seasonfrom
fromNovember
November to to
April, and
April, anda wet
a wetseason
seasonfromfromMayMay to to October. Furthernorth,
October. Further north,the
the bulk
bulk of annual
of annual rainfall
rainfall overover
much much
of
of Mexico occursduring
Mexico occurs duringaafour–month
four–month period
period (June
(June to September)
to September) [124].
[124]. Rainfall
Rainfall decreases
decreases duringduring
the
theboreal
borealsummer
summermonths
monthsininthe thePacific
Pacificcoast
coastofofCentral
CentralAmerica.
America.Therefore,
Therefore, much
much of of
the
theIAS
IASregion
region
features
features a rainy
a rainy season season with periods
with periods that arethat are or
above above
beloworaverage
below precipitation.
average precipitation. Rainfall
Rainfall seasonality
seasonality
is marked is marked
by two by two precipitation
precipitation peaks: May–June peaks:and
May–June and September–October.
September–October. In general, In this
general, this a
features
features a bimodal distribution with a relative minimum precipitation during
bimodal distribution with a relative minimum precipitation during July and/or August. This relative July and/or August.
This relative minimum is known as the MSD and corresponds to a minimum in convective activity.
Terms such as canícula (regardless of the name being defined for temperate climate) and veranillo have
been used locally to refer to this condition depending on the region of occurrence [16,125,126]. Figure
4 shows the long–term rainfall annual cycle (dotted lines) and the maximum and minimum values
(defined by the shaded area) averaged over 10° × 10°, upon which the bimodal distribution thatAtmosphere 2020, 11, 959 11 of 32
minimum is known as the MSD and corresponds to a minimum in convective activity. Terms such as
canícula (regardless of the name being defined for temperate climate) and veranillo have been used
locally to refer to this condition depending on the region of occurrence [16,125,126]. Figure 4 shows
the long–term rainfall annual cycle (dotted lines) and the maximum and minimum values (defined by
the shaded area) averaged over 10◦ × 10◦ , upon which the bimodal distribution that features rainfall
may be observed. The amplitude of the MSD varies across the domain with northern Central America
and the Caribbean, exhibiting the largest rainfall decrease during the boreal summer.
The MSD is the result of a rainfall–enhancing mechanism that occurs twice because of the biannual
crossing of solar declination [127]. The northward displacement of the ITCZ following the seasonal
march of the SST and the westward extension of the NASH have also been identified as forcing
mechanisms of the MSD [55,128]. The variability of the CLLJ and associated direct circulations are a
key element in MSD development. Several studies have characterised the MSD over Central America,
the Caribbean islands, and Mexico, finding high spatio–temporal variability [126,129–131]. Large–scale
dynamics, dominated by low–level atmospheric patterns and orographic forcing associated with steep
topography, generate distinct MSD signatures in the region. The MSD is highly sensitive to the main
variability modes that affect the region. At higher frequencies, the MJO [132] is a key modulator of
the intra–seasonal variability of the MSD [133]. Changes in intra–seasonal variability are relevant
as they modulate the onset and offset of the MSD, having a significant impact on the lengths and
intensity of the rainy seasons. Information on the onset and offset of the MSD is critical for agriculture,
hydropower electricity generation, and water resources management. At interannual scales, the ENSO
modulates MSD variability through variations in the CLLJ (see Section 4). Although heavy rainfall is
a feature of the region, drier periods are equally important as they play a major role in agriculture,
energy, and regional economy in general. Understanding the dynamics of the transitioning of dry–wet
seasons, its variability, and long–term trends is fundamental for planning.
3.4.2. Tropical Cyclones
Tropical cyclones (TCs) represent an economic and societal threat for the western North Atlantic
basin, including the US Atlantic Coast, coastal Mexico, Central America, and the Caribbean [134].
Even when storm surges account for the largest number of casualties, many of the highest fatality events
in the Atlantic basin are rain–induced disasters on steep terrains in the Caribbean and Central America
linked with landslides. The indirect effect dominates the impact of TCs in Central America [135].
However, direct impacts also occur when the TC landfall is located in the isthmus. Although the landing
of TCs in Central America is infrequent, TCs have been recorded to affect Central America with landfalls
as southern as Nicaragua and Costa Rica [136–139]. The tropical North Atlantic (TNA) and the eastern
North Pacific (ENP) are regions of high tropical cyclogenesis. TCs generally develop over oceans with
SST > 26 ◦ C, from pre–existing atmospheric disturbances, and often move out of these regions into higher
latitudes. TC genesis may be a result of nearly classic baroclinic development [140], the interaction of
EWs or other low–level disturbances with tropical upper tropospheric disturbances [141–143].
The annual distribution of TCs is shown in Figure 5 for the Atlantic (A) and eastern tropical Pacific
(B), from which the interannual variability of the TC intensity has been highlighted. For the TNA basin,
the main development region is defined as the TNA south of 21◦ N and the Caribbean Sea. In this area,
cyclonic activity mainly originates from the African easterly waves (AEWs) that propagate from West
Africa towards the TNA. Winds in the mid and upper atmosphere may steer up cyclones to the north;
when TCs reach latitudes near 30◦ N, they often move northeast. On average, AEWs account for nearly
60% of the Atlantic basin tropical storms and non–major hurricanes, and nearly 85% of hurricanes of
strong intensity [144,145]. The Caribbean islands, the Caribbean coast of Central America, and the
Yucatan Peninsula experience the direct influence of TCs, particularly, the most severe systems as they
move along the storm track. These systems form at a low latitude, east of 100◦ W, and travel slowly
westward, where they reach their highest intensity. While the origins of ENP tropical waves continue
to be debated, they are thought to originate from reinvigorated AEWs that have propagated over theYou can also read