Solving PlaStic Pollution through accountability - Warning: Plastics are polluting nature, endangering wildlife and taxing natural systems. it is ...
←
→
Page content transcription
If your browser does not render page correctly, please read the page content below
REPORT
  INT    Solving Plastic pollution
2019      through accountability

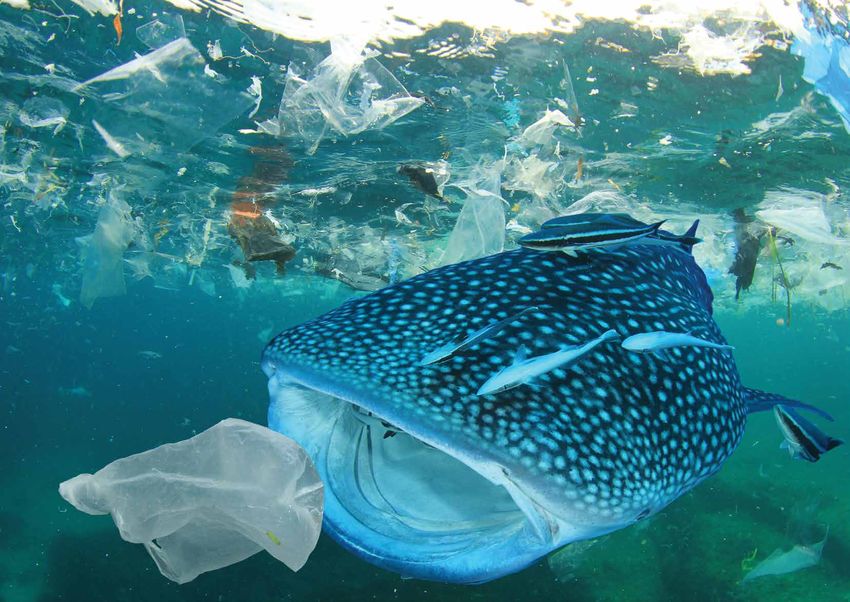
Warning: Plastics are polluting
nature, endangering wildlife and
taxing natural systems. It is entering
the food we eat and the air we breathe.
Contents
                                                                                                                             Call to Action ...................................................................... 6
                                ACKNOWLEDGEMENTS                                                                             Executive Summary .............................................................. 8
                                The report was written by Dalberg Advisors, and the team comprised of Wijnand de Wit,
                                Adam Hamilton, Rafaella Scheer, Thomas Stakes, Simon Allan.
                                                                                                                             Pollution from plastics – A threat to nature and society.......... 12
                                Special thanks to Alona Rivord, a conservationist and a campaigner.                          The root cause of the problem – A tragedy of the commons ........ 18
                                DALBERG ADVISORS                                                                             Business as usual – Pollution will double by 2030 ..................... 26
                                Dalberg Advisors is a strategy consulting firm that works to build a more inclusive
                                and sustainable world where all people, everywhere, can reach their fullest potential.       A systems approach to stop this tragedy of the commons ......... 32
                                We partner with and serve communities, governments, and companies providing an
                                innovative mix of services – advisory, investment, research, analytics, and design – to      Annex 1: Plastics 101 - what is this material?........................... 38
                                create impact at scale.
                                                                                                                             Annex 2: Modelling Methodology ........................................... 40
                                WWF
                                                                                                                             Glossary............................................................................ 42
                                WWF is one of the world’s largest and most experienced independent conservation
                                organizations, with over 5 million supporters and a global network active in more than
                                100 countries.
                                                                                                                             References......................................................................... 43
                                WWF’s mission is to stop the degradation of the planet’s natural environment and to
                                build a future in which humans live in harmony with nature, by conserving the world’s
                                biological diversity, ensuring that the use of renewable natural resources is sustainable,
                                and promoting the reduction of pollution and wasteful consumption.
                                Published in March 2019 by WWF – World Wide Fund For Nature
                                (Formerly World Wildlife Fund), Gland, Switzerland.

                                Any reproduction in full or in part must mention the title and credit the
                                above-mentioned publisher as the copyright owner.

                                © Text 2019 WWF

                                All rights reserved

                                Design: Ender Ergün
                                ISBN 978-2-940529-93-3

                                A REPORT for WWF by
© Shutterstock / Chones / WWF

                                WWF International             Dalberg
                                Avenue du Mont-Blanc          Rue de Chantepoulet 7
                                1196 Gland, Switzerland       1201 Geneva, Switzerland
                                www.panda.org                 www.Dalberg.com
© Shutterstock / Rich Carey / WWF

                                    Solving Plastic Pollution Through Accountability 5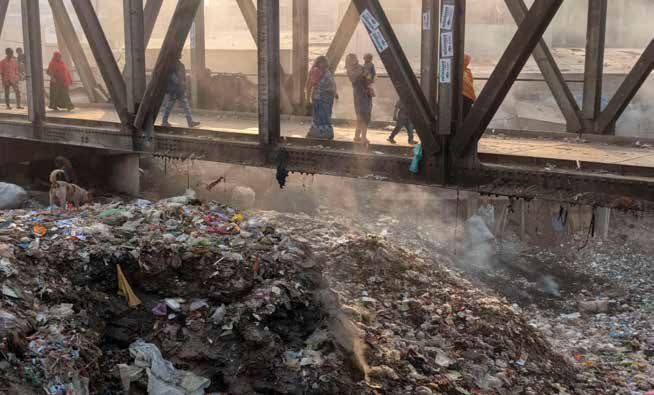
CALL TO ACTION
WWF’S CALL FOR WWF calls on all governments to: WWF calls on all companies and industries
involved in producing, promoting and
WWF calls on civil society groups to:
COLLECTIVE
● Agree to a legally binding international treaty ● Work together with industries and government
to eliminate plastic pollution from leaking into
selling plastic goods to: to identify systemic solutions that avoid negative
GLOBAL
the oceans, thereby significantly contributing to environmental and social consequences.
Sustainable Development Goal 14.1. ● Reduce excessive and unnecessary plastic to
● Provide the public with mechanisms that
prevent it from becoming mismanaged waste or plastic
● Establish national targets for plastic reduction, empower their voices as advocates.
pollution.
recycling and management in line with global treaty
● Hold accountable international institutions,
commitments, including transparent reporting ● Commit to sourcing recycled plastics or
national governments, and private sector
mechanisms that recognize the trans-boundary nature sustainable plastic alternatives for product
entities that fail to take action or to work in good faith
of the problem. packaging.
ACTION
in addressing the systemic drivers that perpetuate the
● Deploy appropriate policy instruments to ● Innovate and seek out sustainable alternatives plastic crisis.
incentivize the creation and use of recycled plastics to plastics that promote circular economy models and
over new plastics, and the innovation of viable do not have severe negative social or environmental
alternatives to plastics that have smaller environmental
footprints.
impacts.
WWF calls on the public to:
● Leverage individual and collective influence to
● Engage with government representatives to
● Collaborate with industries and civil society shift industries away from harmful economic models
ensure that they take action to reduce, recycle and
groups to ensure a systems-based approach that that endanger wildlife, pollute natural systems, and
manage plastic waste in a transparent and accountable
addresses plastic production, consumption, waste create long-term social and environmental problems.
manner.
management and recycling as a single system, and ● Invest in ecologically sound waste management
Plastic is not inherently bad; it is a man-made invention refrain from individual, fragmented or symbolic policy ● Use your power as consumers and call on
systems in end-use markets and countries where
that has generated significant benefits for society. actions. industries to demonstrate leadership through reducing
plastic waste is imported for disposal.
Unfortunately, the way industries and governments dependency on single-use and unnecessary plastics
● Invest in ecologically sound waste management ● Support the development of legislation and best
have managed plastic, and the way society has converted while investing in environmentally sound alternatives.
systems domestically and in countries where national practices to ensure a sector-wide shift and the effective
it into a disposable and single-use convenience,
plastic waste is exported for disposal, thereby locking ● Reduce your consumption of unnecessary plastics,
has transformed this innovation into a planetary implementation of government policies.
in long-term economic social and environmental reuse and recycle what you do use.
environmental disaster.
benefits.
Nearly half of all plastic products littering the world
● Legislate effective extended producer
today were created after 2000. This issue is only decades
responsibility as a policy mechanism for all plastic-
old, and yet over 75 per cent of all plastic ever produced
producing sectors to ensure the greater accountability
is already waste.
of companies in the collection, reduction, reuse,
Based on the findings from this study, WWF urges recycling and management of the plastic waste
governments, industries, and members of the public originating in their trade chains.
to acknowledge that the current global approach to
● Implement sufficient monitoring and
addressing the plastics crisis is failing. The absence
compliance measures for all policies related to the
of an effective systemic response—at either the
production, collection and management of waste by all
national or international levels—hinders progress,
stakeholders in the plastic system.
threatens sustainable economic growth, and has direct
consequences on the environment, species and people. ● Work at appropriate subnational levels and
invest in city approaches to establish robust
While the current trajectory for plastics growth
management plans and transparent accounting
shows that the crisis is expanding, we can change
By taking accountability of our actions,
mechanisms that prevent plastic leakage into
this with a single approach taken across all
water systems or other mismanaged waste disposal
sectors: accountability.
mechanisms.
and working together, we will solve the
planetary problem of plastic.
6 Solving Plastic Pollution Through Accountability Solving Plastic Pollution Through Accountability 7
EXECUTIVE
Since 2000, the world has produced as much Mismanaged waste is a direct result of underdeveloped waste management
plastic as all the preceding years combined. infrastructure. Effective plastic waste management performance is correlated to
Production has grown rapidly this century as plastic is the income status of a nation19. This is a major challenge in low and middle-income
SUMMARY
cheap, versatile and reliable1. These traits support the countries, leading to low collection rates and high rates of open dumping and
development of disposable plastic products, and almost uncontrolled landfilling. Collection rates are generally higher, but issues remain in
half of all plastic becomes waste in less than three high-income counties, such as low levels of recycling and preference for landfilling
years. Most of these throwaways are consumed in high and incinerating plastic waste20. Constraints on waste management capacity create
and upper-middle income countries. This issue is only challenges for end-users. Failure to properly sort or dispose of plastic leads to waste
decades old yet already over 75 per cent of all plastic ever being discarded directly into landfills or dumped into nature21. The world’s inability to
produced is waste2. manage plastic waste results in one-third of plastic, 100 million metric tons of plastic
waste, becoming land or marine pollution22.
Due to waste mismanagement, one-third of plastic waste is estimated
to have entered nature as land, freshwater or marine pollution3. Rapid Closing the loop of plastics is hindered by an unprofitable recycling
industry unable to scale, and by limited consumer choices for
X3
consumption practices generate huge amounts of plastic waste that the world is ill-
equipped to handle; 37 per cent of plastic waste is currently managed ineffectively. environmentally sound alternatives to plastic. Currently, only 20 per cent
Mismanaged plastic waste is a critical concern as it is more likely to become pollution of plastic waste is collected for recycling. In Europe, material loss during recycling
than waste managed through a controlled waste treatment facility. Mismanaged is almost half of total collected, much of the plastic collected for recycling cannot be
waste refers to plastic left uncollected, openly dumped, littered, or managed through recycled for health, safety, or qquality and contamination reasons23. Furthermore,
uncontrolled landfills4. The majority of this mismanaged plastic waste is believed to most secondary plastic materials created from recycled plastic are of inferior quality
have polluted land-based ecosystems, and 80 per cent of ocean plastics are estimated to
come from land-based sources5. CO2 emissions to virgin plastic, and therefore trade for a lower price. Yet, the scaling of recycling is
a real possibility by improving the quality issues stemming from high levels of mixed
and contaminated plastic waste, and by increasing economies of scale. Operating costs
Plastic has become ubiquitous in nature creating a serious challenge for the
Carbon dioxide for recycling ventures are prohibitively high due to waste collection and separation
emissions from
natural world, society and the global economy. The planet’s soil, freshwater and
costs, and a limited supply of recyclable plastic24. Environmentally-sound alternatives
oceans are contaminated with macro, micro and nano-plastics6. Each year, humans and
incineration of
to virgin plastics remain sparse, and limited mechanisms are in place to encourage
other animal species are ingesting more and more nano-plastic from food and drinking
upstream actors to support the development of alternatives25.
plastics can
water, with the full effects still unknown7. Plastic pollution kills wildlife, damages
natural ecosystems, and contributes to climate change8. Carbon dioxide emissions If business continues as usual, by 2030 the plastic system is expected to
are growing each year from increased production and incineration of waste plastic. triple by 2030 double the amount plastic pollution on the planet, with oceans the most
visibly affected. The systemic failures along the plastic trade chain make it cheaper to
Plastic production consumes four per cent of total oil and gas demand annually9. The
UN Environment Programme (UNEP) estimates the natural capital cost of plastic at discharge plastic into nature than to effectively manage plastic to the end-of-life stage.
US$8 billion per year, with fisheries, maritime trade and tourism directly and adversely Although existing initiatives to combat plastic pollution are in place in many regions,
impacted by plastic pollution. It is also estimated that there is four times more plastic they are not enough as the current plastics system is locked into polluting the planet26.
pollution on land than in the oceans, suggesting that the total economic impact of Annual ocean plastic leakage will remain above nine million metric tons per year
plastic pollution is actually much greater. Plastic also has severe human impacts. Local until 2030, because the growth in plastic consumption outstrips the growth in waste
communities are affected by airborne pollutants from the open burning of plastic, and management capacity. This plastic debris is a threat to wildlife – more than 270 species
from unregulated waste incineration and recycling, which is a common occurrence in have been harmed by entanglement in discarded fishing gear and other plastic – and
regions with underdeveloped waste management capacity10,11. 240 species have been recorded living with ingested plastic; this is both a marine health
and human health issue. Annual waste generation could increase by 41 per cent over
Plastic pollution comes at a cost that is not carried by all stakeholders
the next 15 years due to accelerated production of plastics driven by the falling costs of
that are profiting from plastic production and usage. The plastics life cycle
production27,28,29. Carbon dioxide emissions from plastic waste management could triple
does not have a global feedback loop to hold upstream stakeholders accountable for
by 2030 as other waste treatment infrastructure remains more economically attractive
their products after the point of sale12. Falling production costs have resulted in the
than recycling. Unmonitored, an incineration-lead waste-to-energy approach to the
accelerated production of virgin plastics13, reaching 396 million metric tons in 2016, and
plastic pollution problem risks creating other pollutant issues for nature and society
an associated drop in their sale price14. Yet, plastic producers are not held accountable
beyond carbon dioxide emissions. The likelihood of this outcome is a concern given
for the negative impacts of production, as the market price of virgin plastic today does
varied regional environmental regulations and incineration plant performance, coupled
not represent its full life cycle costs to nature and society15. In the United States, China
with incineration capacity predicted to grow by 7.5 per cent a year until 2023 in Asia30.
and Europe, petrochemical production is not deemed sufficiently energy intensive
and is exempt from carbon regulation16. Manufactures of products made out of virgin Plastic’s negative externalities are tied to a fragile global waste trade
plastic, known as plastic converters, have limited responsibility for the impacts of their system that is struggling to adapt to national trade policy reforms. In 2016,
actions on plastic waste and pollution; these factors are largely ignored during product four per cent of global plastic waste was exported, amounting to roughly 13 million
design17. Insufficient incentives exist to ensure plastic waste is managed properly, let metric tons, of which G7 countries were the source for nearly 50 per cent of this export
alone re-captured for recycling or reuse18. waste. China recently increased quality standards for plastic waste imports into the
8 Solving Plastic Pollution Through Accountability Solving Plastic Pollution Through Accountability 9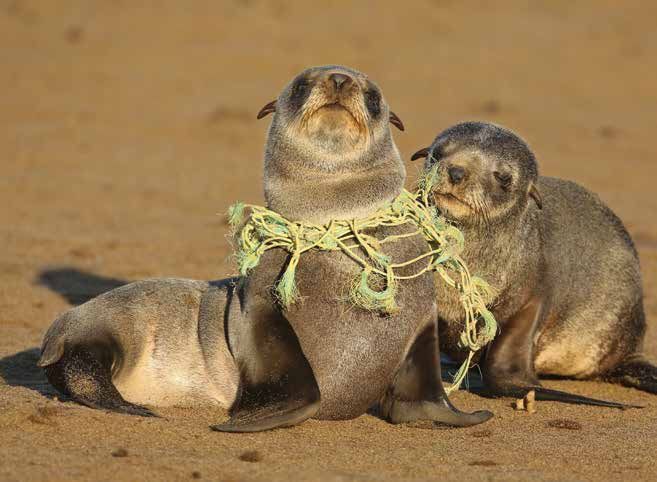
country resulting in these G7 nations unable to export to China due to their highly                                                                                  mismanaged. The final step to eliminate plastic pollution requires ending open
                                contaminated domestic waste31. Given that two-thirds of all plastic waste exports had                                                                                dumping and uncontrolled landfilling to stop a predicted 54 million metric tons of
                                previously arrived in China, further changes to trade patterns could have a significant                                                                              plastic from being mismanaged.
                                impact on plastic pollution. Without China’s waste management system, it is estimated
                                                                                                                                                                                                     All stakeholders in the plastic system must be aligned to the common goal
                                that 111 million metric tons of plastic waste would be displaced by 203032. Unless
                                                                                                                                                                                                     of ending plastic pollution and fixing the plastic value chain. This systemic
                                plastic exporters heighten their contamination standards, or countries invest in their
                                                                                                                                                                                                     solution can achieve this goal, but bold action from a broad range of stakeholders is
                                own recycling capacity, the international plastics trade will remain fragile, and will risk
                                                                                                                                                                                                     needed to implement strategic and tactical interventions. Beyond current initiatives, a
                                exacerbating the damage that plastics have on the environment.
                                                                                                                                                                                                     pathway to reach this common goal requires critical action.
                                Immediate action is needed to stop the uncontrolled growth of plastic
                                pollution, and coordinated initiatives are required to hold each stakeholder
                                accountable for resolving the plastics tragedy of the commons. In the
                                business as usual scenario, each actor remains unaccountable for ensuring that the
                                plastic value chain is sustainable. Current efforts to improve waste management
                                capacity across the planet are insufficient to stop a predicted 104 million metric tons of
                                plastic at risk of leakage into nature in 2030. The current trajectory for plastic pollution
                                results from: consumption patterns that support single-use business models for plastic
                                products; waste mismanagement leaking plastic into nature; and a supply chain

  104M
                                currently producing five times more virgin plastic than recycled plastic.

                                A systems approach, deploying tactical and strategic interventions across
                                the plastic life cycle, is needed to create a path to no plastic in nature. To
                                stop the growth of plastics, tactics should include building on and reinforcing existing

 metric TONS                    initiatives, such as banning problematic single-use plastics, and upgrading national
                                waste management plans. At the same time, to tackle underlying issues, a global

         Current
                                accountability mechanism should be created featuring a multilateral agreement with
                                clear on the ground plans, robust domestic laws, and commercial devices to distribute
      efforts to                responsibility appropriately across the plastic life cycle. Measures should be put in place

 improve waste                  to ensure the global price of plastic reflects its full life cycle cost to nature and society.
                                Additionally, consumers must be persuaded to change their behaviours and provided
    management                  with alternative choices and products that cause plastic pollution.

capacity across                 This approach could cut plastic waste generation by 57 per cent and reduce

  the planet are                virgin plastic production by nearly half, compared with business as usual.
                                Phasing out single-use plastics, those that have a one-year lifespan, has the potential
  insufficient to               lower plastic demand by up to 40 per cent by 2030. Reducing plastic consumption,
stop a predicted                coupled with growing secondary plastic material production, could half virgin plastic

      104 million
                                production by 2030. Phasing out single-use plastic usage lessens the plastic burden
                                placed on the waste system and is estimated to lower plastic waste generation to 188
  metric tons of                million metric tons, a 57 per cent reduction from the business as usual scenario.

  plastic at risk               Eliminating waste mismanagement and reusing plastic can create a plastic

 of leakage into                pollution-free system, and create over a million jobs in plastic recycling and
                                remanufacturing. As an alternative to the business as usual scenario, the no plastic             © Andrew Kasuku / Afp / Getty Images

  nature in 2030.               in nature scenario calls for developing capacity to recycle 60 per cent of plastic waste,
                                or about 113 million metric tons. Cleaner sorting of waste into specific types of plastic,
                                coupled with designing products for ease of reuse, would create a consistent volume of
                                high-quality plastic waste to support the development of increased recycling capacity.
                                Over a million new jobs could be created through recycling and remanufacturing
                                plastic33. This job creation potential is dependent on the scale of recycling growth in a
                                closed loop plastic system and on operating efficiencies within each plant. Improving                                                   Boys compete with their hand made boat by plastic waste during the official voyage launch of the dhow made by
                                waste collection rates to 100 per cent would enable all plastic waste to enter a formal                                                 recycled plastic at Lamu Island, northern coast of Kenya. Flipflopi, the worlds first 100% recycled plastic dhow,
                                waste management system stopping an estimate 50 million metric tons from being                                                          embarked on its 500 km maiden voyage from Lamu, Kenya to Tanzania's Zanzibar, visiting schools, communities and
                                                                                                                                                                        government officials, sharing solutions and changing mindsets along the way.

10 Solving Plastic Pollution Through Accountability                                                                                                                                                                                          Solving Plastic Pollution Through Accountability 11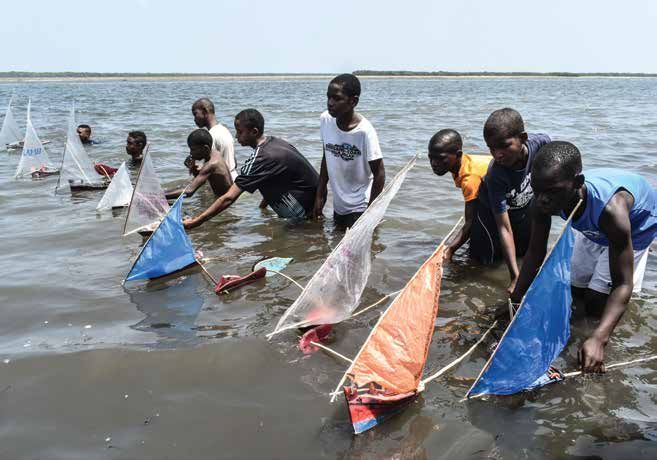
40%                                              6,000

                                                                                                                                                                    increase in plastic
                                                                                                                                                                    production
                                                                                                                                                                    by 2030
              Pollution from
                                                                                                                         396 million
                                                      Since 2000, the plastics industry has
                                                      produced as much plastic as all the

                   plastics –
                                                      preceding years combined. The production of                                                                                                                    5,000
                                                      virgin plastic has increased 200-fold since 1950,

   A threat to
                                                      and has grown at a rate of 4 per cent a year since                                    metric tons
                                                      200034. In 2016, the most recent year for which
                                                      data is available, production reached 396 million                   In 2016, production reached
                                                                                                                          396 million metric tons.

   nature and
                                                      metric tons. That is equivalent to 53 kilograms of
                                                      plastic for each person on the planet. Production
                                                      of plastic in 2016 resulted in approximately 2                      That is equivalent to
                                                      billion metric tons of carbon dioxide emissions,                    53 kilograms of plastic

       society
                                                      which accounts for almost 6 per cent of the                         for each person                                                                            4,000
                                                      year’s total global carbon dioxide emissions35.                     on the planet
                                                      If all predicted plastic production capacity is
                                                      constructed, current production could increase by
                                                      40 per cent by 203036.

                                                      1/3 Of PLASTIC
                                                                                                                                                                                                                     3,000

      75%                                                                   (100 mln metric tons)
                                                      AND 104 MLN METRIC TONS AT RISK OF
      of all plastic ever                             LEAKAGE INTO NATURE IN 2030                                                                                               PROJECTED
      produced is waste                               IN BUSINESS AS USUAL SCENARIO                                                                                                                                  2,000

                                                                                                                            Half of the virgin plastic
                                                                                                                         produced between 1950 and 2016

      80%
                                                                                                                            has occurred since 2000.

      of ocean plastics are
      estimated to come from
                                                                                                                                                                                                                     1,000

      land-based sources.

  Figure 1: Global plastic
  production from 1950 to
  2030(e), in million metric tons

                                                                                                                                                                                                                     0

    1950                                     1960              1970                        1980            1990   2000                                       2016                                             2030
12 Solving Plastic Pollution Through Accountability                                                                                                     Solving Plastic Pollution Through Accountability 13
  Source: Dalberg analysis, Jambeck & al (2017)
Almost half of all plastic is used to create throwaway products that have a dioxide into the atmosphere for every metric ton of incinerated plastic waste40. Only 20
lifespan of fewer than three years; most of these throwaways are consumed per cent of the planet’s plastic waste is currently collected for recycling. Even if plastic
in high and upper-middle income countries. Plastic’s low cost and versatility is collected for recycling there is no guarantee that it will be reprocessed into new
has led to innumerable applications across many industries. The packaging industry is material. For example, less than half of plastic waste collected for recycling in Europe is
the largest converter of virgin plastics into products and was responsible for converting actually recycled due to high levels of contamination41.
almost 40 per cent of total plastic produced in 201537. The construction and automotive
Mismanaged plastic waste is a critical concern because it is more likely
industries are the second and third largest converters of virgin plastic. Many packaging
to become pollution than waste managed through a controlled waste
products are known as single-use plastics, as they are designed to be used only once
treatment facility. Mismanaged waste refers to plastic left uncollected, openly
before disposal. Examples include shopping bags, food packaging and beverage bottles.
dumped into nature, littered, or managed through uncontrolled landfills.
Most these products are consumed in high income and upper-middle income countries.
The increasing use of plastic, and the world’s inability to manage plastic
Rapid consumption practices generate huge amounts of plastic waste that
waste, results in one-third of plastic waste becoming land or marine
the world is ill-equipped to handle; 37 per cent of plastic waste is currently
pollution. An estimated 87 per cent of the plastic that entered a mismanaged waste
managed ineffectively. Almost 310 million metric tons of plastic waste was
stream in 2016 was leaked into nature and became plastic pollution42. The majority
generated in 2016 or the equivalent of over 2,200 plastic water bottles for every human
of this mismanaged plastic waste, 90 per cent, is believed to have polluted land-based
on earth, with the level of plastic waste growing at more than 3 per cent per year since
nature, such as soil and freshwater bodies. The remaining ten per cent has, or is
201038. However, in 2016, only 63 per cent of plastic waste entered a controlled waste
expected to, reach the oceans43. Of the plastic waste that reaches the oceans, just one
treatment stream with a low risk of creating plastic pollution, as shown in Figure 2.
per cent is estimated to accumulate on the surface44; the rest is thought to be below the
The most prevalent plastic waste management systems are landfilling, surface or on the ocean floor45.
incineration, and dumping. In 2016, 39 per cent of plastic waste was sent directly
Figure 2: Overview of
to landfills where it requires over 400 years to decompose39. Industrial incineration
main waste management
streams for plastic
is used to treat 15 per cent of plastic waste, which releases 2.7 metric tons of carbon Plastic has become an ubiquitous material creating a serious
Management Description % of 2016 generated
challenge for the natural world, society and global economy
process plastic waste
Environmental Impacts
• Managed disposal of waste on land with little or
Controlled Entanglement: Wildlife entanglement has been recorded in over 270 different animal
no pre-treatment. Site meets requirements for gas 28
landfill
1
monitoring, site compacting and land covering species, including mammals, reptiles, birds and fish46. Entanglement in plastic debris
effectively managed
63% of waste was
often leads to acute and chronic injury or the death of affected animals. It is estimated
Managed waste
• Plastic collected from the waste stream and that a minimum of a thousand marine turtles die every year due to entanglement in
Recycling
reprocessed into a secondary material2 20 plastic waste, which includes lost or discarded fishing gear47.
Ingestion: Ingested plastic is damaging to the health of animals. Records have
• Combustion of plastic in a controlled and closed documented more than 240 different animal species ingesting plastic48. These animals
Industrial industrial process with exhaust gases adhering to 15 are often unable to pass the plastic through their digestive systems, resulting in internal
incineration environmental emission regulations abrasions, digestive blockages, and death49. Further, toxins from ingested plastic have
also been shown to harm breeding and impair immune systems. This is of particular
concern for endangered species with small populations that are exposed to multiple
• Discarded plastic directly on land, freshwater or marine stressors in addition to plastic ingestion50.
Open dumping areas. Alternatively, littering or any form of unregulated
ineffectively managed and at
risk of becoming pollution
& other 14 Habitat damage: Plastic waste has been found in soils, rivers and oceans where
plastic waste management such as open burning
Mis-managed waste
it can degrade or destroy wildlife habitats. Microplastic pollution has been shown to
37% of waste was
• Absence of control of the disposal operations of alter soil conditions, which can impact the health of fauna and increase the likelihood
Uncontrolled
or unspecified plastic and lack of management of the landfill site
12 of harmful chemical leaching in the soil51. Plastic waste is also accelerating coral
landfill3
degradation. Abandoned, lost, or discarded fishing gear can smother fragile reefs, and
the microbial colonies that form on plastic waste can lead to higher rates of disease in
• Unrecovered plastic from the end-user via a waste
Uncollected corals52.
collection system and does not enter a formal 11
waste
waste treatment process
Social Impacts
Notes: (1) We consider that all landfills on high Income countries are controlled based World Bank data from the “What a Waste 2.0” Report; (2) Not Plastic pollution has effects on air quality, water systems, and soil conditions. The most
accounting for plastic losses during the recovery process; (3) Unless explicitly specified as “controlled” or “sanitary”’ landfills, we consider landfills in common direct impacts are related to unregulated plastic waste management, human
upper middle, lower middle and low Income countries as uncontrolled or unspecified.
ingestion of micro and nano-plastics, and plastic contamination of soils.
Source: Dalberg analysis, Jambeck & al (2015), World Bank (2018), SITRA (2018), European Commission (2001)
14 Solving Plastic Pollution Through Accountability Solving Plastic Pollution Through Accountability 15$�
Unregulated plastic waste management: In 2016, 37 per cent of plastic waste Economic Impacts
was mismanaged through unregulated waste management processes, including open
The total economic impact of plastic pollution is not yet known, although most research
� £
incineration, open dumping, and uncontrolled recycling. These processes, particularly
so far has focused on the impact on oceans. The UN Environment Programme (UNEP)
open incineration, release toxic gases, halogens, as well as nitrous and sulphur oxides,
estimates the economic impact of plastic pollution on oceans at US$8 billion per year63.
all of which can affect air quality53. Open dumping also pollutes nearby aquifers, water
It is also estimated that there is four times more plastic pollution on land than in the
bodies, and settlements54. Additionally, plastic-related compounds associated with
oceans, suggesting that the total economic impact of plastic pollution is actually much
poorly regulated incineration or open burning have been shown to heighten respiratory
greater64.
ailments, increase the risk of heart disease, and damage the human nervous system55.
Communities located close to inadequately controlled waste management facilities are While our understanding of the total economic impact is still emerging, below we
particularly at risk56. highlight the existing impact on specific industries.
Human plastics ingestion: Although humans are highly likely to ingest micro Fisheries: Oceanic plastic pollution reduces both the supply of, and demand for,
and nano-plastics, the direct health impacts are unknown. Humans can ingest plastic seafood due to animal deaths and concerns that animals have ingested plastic. Plastic
by consuming foods contaminated with micro and nano-plastics. This is most likely pollution, including abandoned fishing gear, can also clog boat engines leading to
to occur via seafood, particularly shellfish, mussels and oysters57. There are many disruption of the fishing industry. Costs from the interruption of business due to
other sources of contamination. A recent study of bottled water found microplastic plastic pollution in the European Union were estimated at 0.9 per cent of total industry
contamination in 93 per cent of bottles, sourced from 11 different brands across nine revenues, which amounts to €61.7 million per year65.
countries58.
Maritime trade: Commercial shipping vessels are also extremely sensitive to
Soil and water contamination: Microplastics released during clothes washing collisions with plastic pollution, as damage to the vessel could endanger human lives.
and nano-plastics used in cosmetics products can accumulate in wastewater systems. The Asia-Pacific Economic Cooperation (APEC) estimated the cost of litter damage to
Wastewater treatment processes remove many of these plastic particles as a sewage commercial shipping at US$297 million per year66.
sludge byproduct59. This sludge is often used as field fertilizer causing several thousand
Tourism: Plastic pollution can reduce income and increase costs in the tourism
metric tons of microplastics to end up in soils each year60. Wastewater treatment plants,
industry. For example, plastic pollution has led to reduced tourist numbers in Hawaii67,
however, are currently unable to remove all plastic particles from wastewater before it is
the Maldives68 and Korea69. Further, removing this plastic pollution imposes additional
released back into the environment61 or municipal water systems62.
costs for governments and businesses. The French city of Nice, for instance, spends €2
million each year to keep municipal beaches clean70.
The full effects of microplastics on the natural world and
society are still unknown
Many knowledge gaps on the impacts of plastic pollution still exist including
the economic impact of land-based pollution and the effects of micro-plastic
ingestion on humans and other animal species. Further research is crucial to
fully understanding the risks associated with plastic pollution. The findings of the
World Health Organization’s recently announced review into the effects of the
microplastics in drinking water will be an important step toward understanding
the health risks of prolonged exposure and long-term ingestion of plastics71.
Despite limited knowledge of plastic ingestion on human health, the harmful
health effects of many additives used in plastic production are well documented.
BPA, phthalates, and some plastic flame retardants have been shown to
contain substances that, with sufficient exposure, can cause birth defects
and development disorders72. These findings led the USDA Food and Safety
Inspection Service to recommend to the public that several types of plastics
should not be heated73. Additionally, plastics released into the environment
absorb high levels of organic contaminants, potentially making them particularly
toxic when ingested74. Further research into the health effects of ingestion is
urgently needed.
16 Solving Plastic Pollution Through Accountability Solving Plastic Pollution Through Accountability 17The root cause Plastic pollution comes at a cost that is 1. Plastic production
not carried by the stakeholders that are Falling production costs have resulted in the accelerated production of
of the problem –
profiting from plastic production and virgin plastics, reaching 396 million metric tons in 2016, and an associated
usage. drop in their sale price. The cost of raw materials used to produce plastic, such
A tragedy
as natural gas and oil, have declined by almost half over the last decade77. U.S. liquid
The plastics life cycle currently comprises five key
natural gas (LNG) acts as catalyst for changes in the wider energy market 78. Due to
steps, as seen in Figure 3. Each step is driven by,
increasing cheap U.S. exports, LNG in Europe and China (the world’s largest plastic
and influences, key stakeholders such as producers,
producers) shifted toward a period of lower prices79. As a result of low raw material
of the
plastic converters, end users, governments, and
costs, producing virgin plastic has become increasingly profitable for the petrochemical
waste management actors*. Much like other forms of
industry. This contributes to a plastics system that favours virgin plastic over secondary
pollution, the design of this system does not hold these
recycled plastic, which is more expensive and laborious to produce.
actors accountable for the negative consequences of
commons
their actions75. The system’s lack of accountability has Plastic producers are not held accountable for the negative impacts of
contributed to the current situation of unsustainable production as the market price of virgin plastic today does not represent
plastics production and increasing plastic pollution76. its full life cycle costs to nature and society. The regulatory incentives currently
in place to curtail virgin plastic production are limited. For example, petrochemical
The lack of accountability in the system results
companies located in the U.S., China and Europe do not currently pay for the carbon
in one-third of all plastics waste generated, or
dioxide emissions resulting from virgin plastic production80. Emissions trading schemes
100 million metric tons of plastic waste, polluting
exist in Europe81 and more recently in China82, but petrochemical production is exempt
nature each year. Plastic pollution and carbon dioxide
from carbon emission caps. Unlike aluminium, steel and cardboard production, plastic
emissions are a trans-boundary issue, as their impacts are experienced globally. The
production is not deemed sufficiently energy intensive to require the purchasing of
following section details the failures at each stage in the plastics life cycle and illustrates
carbon allowances83.
how these failures lead to a system that leaks a third of all plastic waste into nature.
2. Plastic usage
Plastic converters, manufactures of products made out of virgin plastic,
* See Glossary for a more detailed explanation of each stakeholder and its role within the plastics life cycle
have limited responsibility for the downstream impacts of their actions
Figure 4: The five causing a prevalence of single-use plastic business models. The rate of plastic
Figure 3: Overview of the
segments of the plastic life consumption has grown by more than 25 per cent since 2010. Plastic products often
plastic life cycle
cycle, (million metric tons, have a complex blend of additional materials that reduce the costs of production84.
1 2 3 4 5 2016) However, this also reduces the recycling potential of these mixed material products
Plastic Plastic Waste Waste Secondary
Production Usage Collection Treatment Markets
1 2 3 4 5
Plastic Plastic Waste Second.
Prod. Usage Collection Waste Treatment Markets
• Manufacturing • Use of plastic • Recovering • Treatment of • Reuse of plastic
of virgin plastic from conversion disposed plastic sorted plastic within an economy
from fossil fuel of material into waste from end- waste through after reprocessing 78%
chemicals by specific products users and sorting various methods waste into a 431 20%
Description a process of until disposal of waste into various such as landfilling, secondary
polymerization or product as waste streams for incineration, material Secondary 35
polycondenzation by the end-user treatment recycling and 121 In Europe, less than 60% of
plastic waste collected is recycled.
dumping 396 Over 40% is lost in processes.
35
310 85
Virgin 275
• Petrochemical • Plastic converters1 • End customers • Local and national • Plastic recyclers 38
companies authorities 47
• End customers • Local or national • Plastic converters
• Oil & gas (individual, authorities • Regulatory bodies 43
Keystake 62
companies institutional, and • Waste • Plastic producers
holders commercial) management • Waste management Plastic Plastic Generated Uncollected Collected Controlled Unontrolled Incinerated2 Open Recycled
companies companies
production still in use waste waste waste landfills landfills1 dump1
• Plastic converters • Plastic converters
Recirculation of secondary
materials back into system
Notes: (1) Manufacturers of plastic products in all plastic markets (e.g., packaging, building and construction, transport) that convert virgin plastic
into a specific products for use within the economy. These plastic products can be combined with other non-plastic materials during the conversion Notes: (1) Plastic at risk of being openly burnt; (2) Controlled incineration in plants only; (3) Manufacturers of plastic products in all plastic markets
process. (e.g., packaging, building and construction, transport) by converting virgin plastic into a specific plastic item
Source: Dalberg analysis, Jambeck & al (2014), World Bank (2018), SITRA (2018) Source: Dalberg analysis, Jambeck & al (2014), World Bank (2018), SITRA (2018)
18 Solving Plastic Pollution Through Accountability Solving Plastic Pollution Through Accountability 19by introducing impurities and contaminants and increasing the sorting and cleaning Collection rates are generally higher, but issues remain in high-income
costs85. As result, more than 40 per cent of plastic waste collected for recycling cannot counties. Collection rates are above 95 per cent in most high-income countries, but
be profitability recycled, and is instead managed through incineration and landfilling86. rates are often lower in rural areas as waste collection systems are not modernized in
line with urban environments93. Unless waste management systems improve across
Plastic converters do not design resource-efficient products that enable
the globe, as the rate of waste generation continues to grow, the amount of uncollected
effective end-of-life plastic waste management. Decisions taken by plastic
waste and resulting plastic pollution is certain to rise.
converters directly affect the price competitiveness and quality of secondary recycled
plastic. This results in an abundance of high quality, low cost virgin plastic products. End-users face challenges properly sorting and disposing of plastic waste,
Downstream waste management companies unfairly carry the financial burden of which leads to waste being discarded directly to landfills or dumped into
the decisions made by plastic converters87. Due to design and material choices of nature. Communities in low and middle-income countries often need to travel many
converters, the cost of plastic waste management increases, and the quality of secondary kilometres from their homes to dispose of waste in a central container or collection
materials decreases88. point where it is picked up by their municipality94. End-users are often unaware of the
importance of effective separation and waste disposal, which often results in substantial
The plastics life cycle does not have a global feedback loop to hold upstream
littering, particularly in urban centres95.
stakeholders accountable for their products after the point of sale89. While
policies exist such as extended producer responsibility in some OECD countries, many 4. Waste treatment
regions with high rates of mismanaged plastic waste have yet to implement similar
Mismanaged waste is a direct cause of plastic pollution. While the
programs90. As of yet, there is no universal policy, governance mechanism, or regulatory
mismanagement of waste exists in most regions, it is greatest in low and middle-
body to ensure transparency and accountability of upstream actors, which limits the
income countries as a result of inadequate waste management infrastructure (see
ability to generate systemic change in the plastics life cycle.
Figure 6). In countries with limited recycling capacity and fewer effective end-of-life
3. Waste collection waste management systems, plastic waste is far more likely to end up in inadequately
controlled landfills or open dumps98. Without improvements to waste management
Uncollected plastic waste often becomes plastic pollution91. In 2016, 11 per
systems, the global volume of plastic pollution is set to increase rapidly.
cent of plastic waste generated went uncollected, the main causes being underdeveloped
waste management infrastructure and barriers that make it difficult for end-users to Scaling recycling capacity remains unprofitable and challenging due to the
sort and dispose of their waste. The ability of companies to effectively sort and manage risky business model. In 2016, less than a 20 per cent of plastic waste was recycled99.
plastic waste varies by country and is negatively impacted by the design decisions of In Europe, a continent with some of highest recycling rates, plastic recycling economics
upstream plastic converters. remain unprofitable. Operating costs are estimated to be €924 per metric ton to recycle
plastic, which is significantly less than the average selling price of secondary plastic
Underdeveloped waste management infrastructure is a major challenge in
material, €540 per metric ton100. Currently, landfilling and incineration are a more
low and middle-income countries, and it leads to low collection rates. There
widely utilized form of waste treatment than recycling across all income groups, as
is limited investment in waste management infrastructure in low and middle-income
seen in Figure 8. A landfill or an incineration plant earns revenue for the storage and
countries amid the many competing development priorities. Low-income countries
treatment of waste101. Whereas recycling plants earn an income almost exclusively
invest three times less into waste management systems than in high-income countries92.
from the sale of the recycled material they produce102. Landfill and incinerator business
In 2016, the average collection rate in low-income countries was below 50 per cent.
models are based on a steady supply of raw waste. Plastic recyclers, in contrast, depend
Figure 5: Share of plastic 309 55
waste generated and Figure 6: Share of plastic
6%
uncollected by income waste treatment by 8%
16% 4%
group, (% 2016; million income group 11% 6%
31% 12%
metric tons in bubbles) 2% 7%
20% 33%
16% 25%
41% 28%
35%
43% 24% 48% 84%
40% 1%
47% High income Upper middle income Lower middle income Low income
12% Modern waste Waste management treatments
management treatments with high leakage risks
Share of waste generated Share of uncollected waste
Waste collected for rcycling Waste in inadequality conrtolled landfills
High income Low income Lower middle income Upper middle income
Waste incinirafed Waste in open dump
Source: Dalberg analysis, Jambeck & al (2014), World Bank (2018), SITRA (2018) Waste inconrtolled landfills
20 Solving Plastic Pollution Through Accountability Solving Plastic Pollution Through Accountability 21Effective plastic waste management performance is correlated Figure 7: Country income status comparison by kilograms of plastic waste generated per person, mismanaged
plastic waste at risk of pollution, and plastic recycling rates (2016)
to the income status of a nation % weighted average recycling rate
High income countries produce ten times more waste per person than low income countries, as shown in Figure 7. 100
Over half the plastic waste in 2016 came from high income countries and over a third from upper-middle income
countries. However, high income countries have lower waste mismanagement rates, between five per cent and 10 80
per cent, compared to higher rates other regions. High income countries also export between 10 per cent and 25 per
cent of their waste, making their capacity to manage waste sensitive to global trade dynamics. Thus, these rates of 60
mismanagement in high income countries may be underreported as their data assumes all export waste is effectively High income
treated in the importer country30. 40
118 Upper middle income
Plastic pollution and carbon dioxide emissions are a transboundary issue, as their impacts are experienced globally, 30 Lower middle income
118
but it is the consumption habits of high-income countries that are driving plastic production. In 2016, carbon dioxide
11 17
emissions due to plastic consumption was four times higher per kilogram of plastic produced in Italy than in Senegal, 0
as seen in Figure 8. Reducing the consumption of virgin plastics in high-income countries is, therefore, an important Low income
step in reducing the carbon footprint of the global plastics life cycle. -20
-10 0 10 20 30 40 50 60 70 80 90 100
As lower middle and low-income countries continue to develop, their rates of plastic waste generation are expected
% portion of mismanaged waste* at risk of becoming pollution
to increase from 11 kilograms toward the 118 kilograms of plastic waste generated per person in high income
* Mismanaged plastic waste includes all uncollected plastic waste and waste disposed in an inadequately managed landfills or open dumps
countries. As a result, larger and larger volumes of global plastic waste will need to be disposed of through plastic Source: Dalberg Analysis, World Bank “What a Waste 2018” database; UN Basel Convention (2002); SITRA (2018); Plastics Europe (2017)
waste management systems. Despite middle to low-income countries producing less plastic waste than high income
countries, underdeveloped waste management infrastructure leads to higher rates of mismanaged waste. In 2016,
Figure 8: Deep dive into 1 kilogram of plastic waste in different countries
over 76 per cent of total plastic waste in low-income countries was mismanaged. Efforts are being made to improve
waste management infrastructure. In Sub-Saharan Africa there is a large focus on increasing collection coverage and 2 3 4 5
Waste Collected waste treatment Second.
providing suitable final disposal options96. However, challenges with planning, regulation and financing remain97. Plastic Usage Collection Markets
excluding recycling
A typical Produces 1kg ...emitting For each kg of ... of which... ...resulting in... For each kg of
citizen in of plastic from plastic waste, plastic waste...
waste in production up to...
0.4
0.7 0.2
0.6 0.1kg 0.3
Italy
0.3 0.9 0.2
0.6 0.3kg 0.1
Brasil
0.4
0.2 0.4 ̴ 1kg ˂ 0.1
Indonesia
© K.M. Asad / LightRocket via Getty Images
0.2
0.1 0.2 0.0 ̴ 1kg 0.0
Senegal
days kgs of CO2 kgs are kgs are kgs are being are collected for
per day to collected disposed inadequately mismanaged recycling
meet demand in landfills disposed and at risk of
waste2 entering nature3
Source: (1) Extrapolation based on figures for LDPE. Production of 1 kg of LDPE requires the equivalent of about 2 kg of oil (raw material and
Plastic waste is burning at the side of Burigonga River in Kamrangirchar, Bangladesh. energy). (2) Disposed in inadequately controlled landfills or in open dumps; (3) Excludes plastic waste arising from littering and assumes all exported
waste is correctly treated in importer country
22 Solving Plastic Pollution Through Accountability Solving Plastic Pollution Through Accountability 23on largely unreliable supplies of separated waste. Recycling businesses also exposed to bottles in Tanzania110. Current estimates of Tanzanian plastic waste mismanagement are
material losses during the recycling process, and the low quality and low selling price above 90 per cent111. Compared to glass, plastic does not have a circular deposit recovery
of the secondary material they produce103. The profitability of recycling is affected by system112. This corporate decision is expected to cause higher plastic consumption,
changes to any of these parameters, which are currently beyond the control of recycling to increase the amount of pollution generated, and to disrupt the glass circular value
businesses themselves. chain.
Recycling operating costs are prohibitively high due to high collection Without systemic change to the plastic life cycle, the current plastic
and separation costs, and a limited supply of recyclable plastic. Collecting pollution crisis risks spiralling out of control. The plastics industry has
and sorting is a time consuming and labour-intensive process due to the high levels produced more plastics since 2000 than all the preceding years combined. Over 75 per
of mixed and contaminated plastic waste. Together, collecting and sorting constitute cent of this plastic is already waste. In fact, a third of this plastic waste is estimated to
approximately 40 per cent of recycling costs104. In many cases, the inclusion of different have become plastic pollution due mismanaged waste management processes. As result,
materials or harmful substances to virgin plastic products means that the plastic waste plastic has contaminated the planet’s soils, freshwater bodies and oceans. Additionally,
cannot be recycled for health, safety, or quality control reasons105. humans are ingesting more plastic from their food and drinking water, and carbon
dioxide emissions from plastic production and incineration are growing each year. To
5. Secondary markets
reverse this tragedy of the commons, the plastic life cycle needs urgent systemic change.
Secondary plastic materials are of an inferior quality than virgin plastic,
and therefore trade for a lower price. Due to its lower quality, recycled plastic
has more limited reuse applications, reducing its demand, its price, and therefore the
revenues of recycling companies. Secondary recycled plastic can trade for as little as a
third of the price of the virgin plastic106.
There are limited mechanisms in place to encourage upstream actors to
support the development of environmentally sound alternatives to virgin
plastics107. Secondary materials, unlike virgin plastics, carry the cost and consequences
of poor upstream product design and weak waste management infrastructure. However,
there are currently a lack of incentives in many regions to improve the costs, technical
capabilities, and quality of secondary materials and other alternatives108.
The failures of the current plastic system make it cheaper to discharge
plastic into nature than to effectively managing plastic to the end-of-life
stage. Since these economics are true for all actors in many locations around the world,
the current plastics system is locked into polluting the planet109. In this broken system,
decisions taken by upstream stakeholders, like multinational corporations, can have
Figure 9: Summary of profound deleterious effects on the scale of global plastic pollution. For example, in
failures across the plastic 2015, a leading global beverage company changed its packaging from glass to plastic
system driving plastic
pollution
1 2 3 4 5
Lifecycle Plastic Plastic Waste Waste Secondary
Production Usage Collection Treatment Markets
System Price of plastic Cheap plastic Low collection Low recycling Inferior quality
excludes negative results in rates and limited rates and and low value
Failures
consequences to prevalence waste sorting in high levels of secondary material
nature and society of single-use many regions mismanaged
business models waste treatment
© Jamie Lamb / Getty Images
Outcome
One third
of plastic waste becomes
plastic pollution
Seal pup choking on plastic fishing line.
24 Solving Plastic Pollution Through Accountability Solving Plastic Pollution Through Accountability 25Business as usual –
The plastic system is expected to double plastic Annual waste generation could increase by 41 per cent over the next 15
Pollution
pollution by 2030, with oceans the most visible years due to accelerated production of plastics driven by the falling costs of
affected by this pollution. Within the next 15 years, production. With business continuing as usual, plastic waste generation is to expected
the current plastic life cycle is expected to result in increase by 128 million metric tons, and plastic consumption will continue to grow at
almost double the amount of plastic accumulated in the a recent rate of above three per cent. Most plastic is made from byproducts of natural
will double
ocean between 1950 and 2015. Ocean plastic pollution gas exploration or crude oil refinement, and plastic production capacity is expected
could reach 300 million metric tons by 2030, based on to increase given supply surplus over the coming years from additional Liquefied
current population growth forecasts, GDP per capita Natural Gas capacity in the US114. On its current trajectory, China could consume 90
projections, and current plastic waste generation per per cent more crude oil in the production of petrochemicals by 2030 than in 2015115.
by 2030
capita. This is enough waste to make the equivalent Additionally, UK multinational chemical company INEOS is planning the first major
of 11 trillion 500ml plastic bottles.* Annex 2 provides investments in European chemicals capacity in over 20 years by expanding two
more detail on the methodology used for this projection. ethylene facilities and constructing a new propylene production plant116. If all predicted
Furthermore, land-based pollution could be much plastic production capacity is constructed, it may lock in an expansion of virgin plastic
higher by 2030 given that recent evidence suggests production for decades117. Driven by the growth in consumption, reliance on virgin
there is potentially four times more plastic in terrestrial plastic remains analogous to today as shown in Figure 11.
ecosystems than in the oceans113.
Carbon dioxide emissions from plastic waste management could triple by
Annual ocean plastic leakage will remain above nine million metric tons 2030 as other waste treatment infrastructure remains more economically
per year until 2030 because the growth in plastic consumption outstrips attractive than recycling. Over 350 million metric tons of carbon dioxide could
the growth in waste management capacity. The plastic system is producing waste be emitted in 2030 by continuing to pursue a waste-to-energy (WtE) incineration
faster than it can be managed. If business continues as usual, improvements to waste approach for dealing with plastic waste. Global incineration capacity may continue to
management capacity are unlikely to stop plastic leakage into nature. The growth of total grow faster than recycling given the lower risk “pay as you store” waste management
plastic waste from uncontrolled consumption counteracts the net improvements in waste business model and the current financial support mechanisms for WtE plants118.
management capacity, resulting in a small reduction in mismanaged plastic as seen in
Unmonitored, an incineration lead WtE solution to the plastic pollution
Figure 10. In absolute terms, mismanaged waste is expected to decrease from 115 million
problem risks creating other pollutant issues for nature and society
metric tons to 104 million metric tons over the next 15 years. As a result, plastic leakage
beyond carbon dioxide emissions. Furthermore, additional health and safety
Figure 10: Plastic leakage will remain similar to current levels. Over nine million metric tons of plastic - equivalent
concerns for local communities are raised by pursing this path, given varied regional
consequences from plastic to around 1.4 million 500ml plastic bottles leaking into the ocean every minute.
environmental regulations and incineration plant performance. Asia is expected to be
growth in the business as the fastest growing region for incineration capacity until 2023, with annual growth of
* See Glossary. Mass of plastic pollution was converted into equivalent number of a standard 500ml PET plastic bottle, with a mass of
Figure 11: Projection of
usual scenario, (million 7.5 per cent11. Incineration capacity in China has doubled since 2012, with 28 plants
12.7 grams. Calculation based on 90,000 seating capacity football stadium with volume of 4,000,000m3. 1m3 is equal to 1,000 litres. plastic life cycle 2030,
metric tons, 2030) in operation, and capacity growth is expected due to increasing waste generation
(Million metric tons, BAU
scenario)
2016 waste generation Uncollected waste Recycled
438 186 Waste growth by 2030 Uncontrolled landfills Incinerated2
1 2 3 4 5
2016 waste treatment Open dump1 Plastic Plastic Waste Second.
capacity Waste Treatment
Prod. Usage Collection Markets
+41% 128
78% 2016 2030
CO2 emissions
may triple by 2030 30 624 186
148 given current growth Secondary 35 27%
rates of incineration
55 capacity 163 438 50
388 77
310
Net waste 396 34
140
93 treatment capacity
Virgin
104 improvements are 310 20
20 insufficient to stop 254 117
plastic leakage due
34
to expected growth of
50 waste generation Plastic Plastic Generated Uncollected Collected Controlled Unontrolled Incinerated2 Open Recycled
production still in use waste waste waste landfills landfills1 dump1
Generated waste Existing waste Net growth in Mismanaged waste
in 2030 treatment capacity waste treatment in 2030
from 2016 capacity by 2030 Recirculation of secondary materials back into system
Notes: (1) Plastic at risk of being openly burnt; (2) Controlled incineration in plants only Notes: (1) Plastic at risk of being openly burnt; (2) Controlled incineration in plants only
Source: Dalberg analysis, Jambeck & al (2014), World Bank (2018) Source: Dalberg analysis, Jambeck & al (2014), World Bank (2018)
26 Solving Plastic Pollution Through Accountability Solving Plastic Pollution Through Accountability 27You can also read


