Deconstructing Commercial Wearable Technology: Contributions toward Accurate and Free-Living Monitoring of Sleep
←
→
Page content transcription
If your browser does not render page correctly, please read the page content below
sensors
Review
Deconstructing Commercial Wearable Technology:
Contributions toward Accurate and Free-Living Monitoring
of Sleep
Lauren E. Rentz            , Hana K. Ulman and Scott M. Galster *

                                          Human Performance Innovation Center, Rockefeller Neuroscience Institute, West Virginia University,
                                          Morgantown, WV 26505, USA; Lauren.Rentz@hsc.wvu.edu (L.E.R.); HKUlman@hsc.wvu.edu (H.K.U.)
                                          * Correspondence: Scott.Galster@hsc.wvu.edu

                                          Abstract: Despite prolific demands and sales, commercial sleep assessment is primarily limited by
                                          the inability to “measure” sleep itself; rather, secondary physiological signals are captured, combined,
                                          and subsequently classified as sleep or a specific sleep state. Using markedly different approaches
                                          compared with gold-standard polysomnography, wearable companies purporting to measure sleep
                                          have rapidly developed during recent decades. These devices are advertised to monitor sleep
                                          via sensors such as accelerometers, electrocardiography, photoplethysmography, and temperature,
                                          alone or in combination, to estimate sleep stage based upon physiological patterns. However, without
                                          regulatory oversight, this market has historically manufactured products of poor accuracy, and rarely
                                          with third-party validation. Specifically, these devices vary in their capacities to capture a signal
                                          of interest, process the signal, perform physiological calculations, and ultimately classify a state
                                          (sleep vs. wake) or sleep stage during a given time domain. Device performance depends largely

                                   on success in all the aforementioned requirements. Thus, this review provides context surrounding
Citation: Rentz, L.E.; Ulman, H.K.;       the complex hardware and software developed by wearable device companies in their attempts to
Galster, S.M. Deconstructing              estimate sleep-related phenomena, and outlines considerations and contributing factors for overall
Commercial Wearable Technology:           device success.
Contributions toward Accurate and
Free-Living Monitoring of Sleep.          Keywords: sleep; wearable device; wearable sensors; physiological monitoring; accuracy; consumer
Sensors 2021, 21, 5071. https://          product; activity tracker; smartwatch
doi.org/10.3390/s21155071

Academic Editor: Nicola Carbonaro

                                          1. Introduction
Received: 11 June 2021
Accepted: 23 July 2021
                                               Despite spending nearly a third of our lives in a restful state, the vast majority of
Published: 27 July 2021
                                          individuals have limited knowledge surrounding sleep. Although why we sleep is still a
                                          question for many scientists, there is an abundance of research demonstrating the dangers
Publisher’s Note: MDPI stays neutral
                                          associated with a lack of sleep, whether that be quality or quantity. Having implications
with regard to jurisdictional claims in
                                          regarding nearly all aspects of human performance and being deemed as a contributing
published maps and institutional affil-   factor for the development of many diseases, quantifying trends surrounding sleep are
iations.                                  invaluable for personalized health and wellness monitoring.
                                               The sleep medicine field has long sought a solution for the significant gap between
                                          the exceedingly limited, but accurate, polysomnographic methods and the ability to easily
                                          monitor free-living and longitudinal sleep patterns. The advent and proliferation of
                                          commercially available sleep technologies has acquiesced an alternative to measure sleep
Copyright: © 2021 by the authors.
Licensee MDPI, Basel, Switzerland.
                                          with increased accessibility and fewer limitations. These non-prescription devices that
This article is an open access article
                                          claim to monitor, track, and report sleep related metrics are comprised of wearables,
distributed under the terms and           nearables, and phone-based applications [1]. Sleep wearables offer a user-friendly, cost-
conditions of the Creative Commons        effective solution to unobtrusively monitor sleep with enhanced comfort and convenience
Attribution (CC BY) license (https://     as compared to traditional sleep monitoring techniques [2]. These wearable devices have
creativecommons.org/licenses/by/          become increasingly popular in recent years due to the ease of data collection that they
4.0/).                                    intend to offer.

Sensors 2021, 21, 5071. https://doi.org/10.3390/s21155071                                                  https://www.mdpi.com/journal/sensors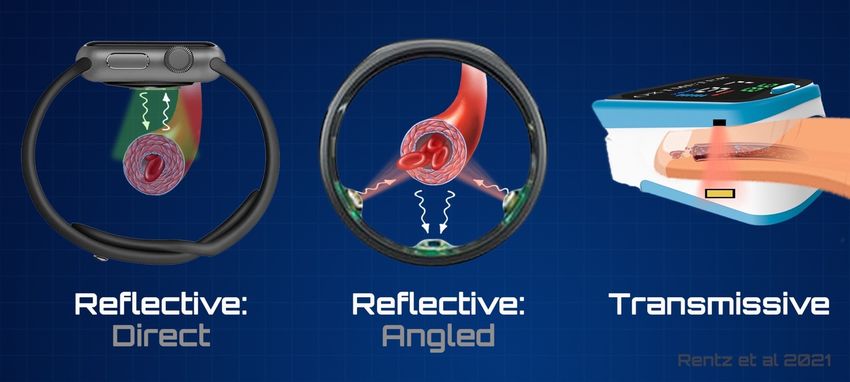
Sensors 2021, 21, 5071                                                                                            2 of 26

                                The ease in usability offered by these devices substantially comes at the cost of accu-
                         racy; when considering the meticulous and thorough nature of polysomnography (PSG),
                         it is impractical to suggest that a device costing less than a few hundred dollars could be a
                         comparable alternative. Device consumers of all interested markets often fail to understand
                         the intricacy and complexity of capturing sleep. Therefore, it is critical that end-users from
                         all backgrounds understand the inherent capability of a device and its capacity to measure
                         the intended metric(s) of interest.
                                The present review aims to enhance awareness and knowledge surrounding the
                         utility of commercially available wearable devices to accurately estimate sleep related
                         phenomena. Beginning with the physiology that is characteristic of the various states
                         of consciousness, traditional methods of behavioral measures are delineated, along with
                         the current methods deployed via sensors that are adopted by commercial wearables.
                         In considering the applications of behavior captured by accelerometry, electrocardiography,
                         and photoplethysmography, it is vital to understand that many of the signals captured are
                         secondary in nature, and are assumed to correlate with specific behavioral (sleep) outcomes.
                         This review highlights how secondary signals are used to estimate sleep related phenomena
                         and how the combination of various signals contributes to the prediction of differing
                         sleep states, clarifying the common sources of error and the variables that contribute
                         to variations in accuracy across commercial products. Different sensor combinations,
                         including their individual specifications, namely, plethysmography, in combination with
                         signal acquisition and algorithmic functionality, help support the variation in efficacy
                         that is reported by third-party validations. Finally, the applications and considerations
                         of commercial wearables are evaluated for the use of sleep wearables by the consumer,
                         researcher, and medical professional based upon the convergence of aims from the end-user
                         and the technology, alike.

                         2. Sleep as a Physiologic Measure
                               Across states of alertness, the body functions with varying physiological patterns;
                         namely, the brain operates at different frequencies, the tone of skeletal muscle varies,
                         and the cardiovascular system executes at differing speeds and forces, all of which are
                         dependent on the current state of an individual and the corresponding physiological
                         function that the body aims to achieve. The same goes for sleep stages; as an individual
                         transitions from one sleep stage to another, the physiological signals elicited by the body
                         fluctuate. The status of these physiological measures provide insight regarding the state of
                         an individual and are often used for sleep staging determinations.
                               During wakefulness, the body omits a compilation of physiological patterns that collec-
                         tively and distinctly suggest if an individual is awake. The body acts with a relatively high
                         degree of movement and muscle tone to support the execution of different tasks. Similarly,
                         the eyes produce a high degree of movement, occurring as a general function of an active
                         visual system. The brain functions predominantly at a frequency of around 16–25 Hz, pro-
                         ducing mostly rhythmic beta waves with the presence of some alpha waves [3]. This pattern
                         of electrical activity in the brain is common for minimal attentiveness.
                               As the waking body begins to tire and prepare for a restful state, these signals slightly
                         shift; brain activity slows, becoming predominantly rhythmic alpha waves, to reflect the
                         relaxed state accentuated by the closing of the eyes [4]. Concurrently, as the individual gets
                         into bed, movement and muscle tone become slightly reduced as the body prepares to enter
                         sleep. Also consistent with getting into bed is a slight reduction in blood pressure (BP),
                         which results from the naturally occurring orthostatic response to laying horizontally [5],
                         as well as the drop associated with sleep onset [6].
                               Similar to wake, each stage of sleep has a unique combination of these physiological
                         measures. Figure 1 outlines in more detail each of the precise physiological signal trends
                         emitted by the body at different states, which each vary in difficulty of measurability.
x FOR PEER REVIEW
Sensors 2021, 21, 5071 3 of 26
Figure 1. Systematic occurrences during wake and sleep. The figure demonstrates the minor physiological differences
Figure 1. Systematic occurrences during wake and sleep. The figure demonstrates the minor physiological differences
between wake and each of the sleep stages. Normal structural progression, displayed in the hypnogram at the top of the
between wake and each of the sleep stages. Normal structural progression, displayed in the hypnogram at the top of
figure provides context surrounding the frequent shifts between states, and the subsequent reliance for accurately captur-
the
ing figure provides
physiological context
trends. surrounding
Prominent the frequent
physiological shifts
trends between
often states, and
characteristic the subsequent
of these individual reliance for accurately
states, which are each
capturing physiological
traditionally measured viatrends. Prominent
separate physiological
methods, trendsincluding
are comparable often characteristic of these
brain activity, individual
cardiac patternsstates,
(heartwhich are
rate and
each
bloodtraditionally measured via
pressure), respirations, separate
eye methods,
movement, are comparable
and muscle tone. REM including braindepicted
physiology activity,iscardiac patterns (heartof
most representative rate and
phasic
REM. (BP,
blood bloodrespirations,
pressure), pressure; HR, heart
eye rate; Hz,and
movement, hertz; N1, non-rapid
muscle tone. REMeye movement
physiology stage 1;
depicted is N2, non-rapid
most eye movement
representative of phasic
stage 2; N3, non-rapid eye movement stage 3; REM, rapid eye movement).
REM. (BP, blood pressure; HR, heart rate; Hz, hertz; N1, non-rapid eye movement stage 1; N2, non-rapid eye movement
stage 2; N3, non-rapid eye movement stage 3; REM, rapid eye movement).
A hypnogram, as seen in Figure 1, is the archetypical depiction of an individuals’
sleepAstages
hypnogram, as seen
throughout theinnight.
FigureA1,typical
is the archetypical depiction ofthrough
sleep cycle progresses an individuals’
NREM (non- sleep
stages throughout the night. A typical sleep cycle progresses through
rapid eye movement) sleep before entering a period of REM (rapid eye movement), which NREM (non-rapid
eye
is movement)
often followedsleep before
by a brief entering aSleep
awakening. period of REM
cycles (rapidlast
ordinarily eye90 movement),
min on average which andis
often
are followed
repeated in by a briefnature
a cyclic awakening. Sleep the
throughout cycles ordinarily
night, changinglastin90structure
min on average and
as the night
are repeated
progresses in aLight
[4,7]. cyclicsleep,
nature throughout
which the night,
is a summative termchanging
used to in structure refer
collectively as thetonight
both
progresses
the first (N1) [4,7].
andLight
secondsleep,
(N2)which
stagesis of
a summative term usedin
NREM, is transitory tonature
collectively
in that refer to both
it often in-
the first (N1) and second (N2) stages of NREM, is transitory in
terpolates the transition between wake, N3, and REM. Light sleep has the lowest sensory nature in that it often
interpolates
threshold in the transition
which the brainbetween
utilizeswake, N3, and
this stage REM. Light
to perceive sleep has
the highest the lowest
aggregate sensory
of sensory
threshold in which the brain utilizes this stage to perceive the highest
stimuli from the environment whilst sleeping. Contrarily, deep sleep collectively refers to aggregate of sensory
stimuli
the stage from
threetheand
environment
previouslywhilst
namedsleeping.
stage four Contrarily,
of NREMdeep sleep. sleep
Deepcollectively
sleep occurs refers
in
to the stage
greater three and
durations previously
in sleep cycles named
during stage four
the first of NREM
half sleep. with
of the night, Deeponlysleepbrief
occursREM in
greater
sleep durationsthis
durations; in sleep cycles
balance during the first
progressively shiftshalf of the night,
throughout thewith
night, only brief REM
gradually sleep
produc-
durations; this balance progressively shifts throughout the
ing sleep cycles with shorter deep sleep durations and longer bouts of REM [4]. night, gradually producing
sleepItcycles withfor
is typical shorter deep
the body tosleep
enterdurations
stage one and longersleep
of NREM bouts of REM
(N1) [4]. sleep onset.
following
While this is not always the case, in most healthy adults this lightest stage will sleep
It is typical for the body to enter stage one of NREM sleep (N1) following onset.
commence
While this is not always the case, in most healthy adults this lightest
the restful state. Many of the physiologic signals elicited are only minimally different to stage will commence
the restful state. Many of the physiologic signals elicited are only minimally differentSensors 2021, 21, 5071 4 of 26
to those of wake; muscle tone, heart rate (HR), blood pressure, and respiration rate (RR)
present a slight reduction during N1 as compared to wake, and tend to stabilize and
become more consistent [3,4]. Brain activity additionally exhibits a decline in frequency,
containing fewer rhythmic alpha waves with a frequency of 8–13 Hz, shifting toward a
greater composition of theta waves occurring around 3–7 Hz, which indicates a transition to
an even slower state [7,8]. Though subtle, the most distinct physiological change occurring
with sleep onset, is a gradual reduction in core body temperature of about 0.5 degrees
Celsius, which reflects the decrease in temperature regulation [9].
Stage two of NREM sleep (N2), which commonly follows sleep onset and N1, presents
only minute distinctions from lighter states via the physiological patterns elicited. Trends
in muscle tone and RR are very similar to that of N1; however, spikes in HR and BP occur
very briefly in response to the occurrence of eccentric brain activity that is predominantly
unique to N2 [4]. Low amplitude mixed frequency brain waves continue, similar to
those of N1, but additionally present with sleep spindles and K-complexes, which are
instantaneous bursts of high and low activity respectively, lasting less than one second in
duration [4,7]. In addition to the unique brain activity, these sleep spindles and K complexes
are subsequently followed by abrupt increases in HR and BP. The presence of these unique
periods with otherwise downward trending HRs, are a few of the physiological trends that
suggest the occurrence of N2.
Stage three of NREM sleep (N3), which includes the stage four NREM determination
previously used, is termed “deep sleep.” The highest sensory threshold occurs during
this stage, which is reflected by the low degree of muscle tone and movement, and the
occurrence of the slowest brain waves [3,8]. The brain exhibits very slow activity with high
voltage during N3, displaying a large presence of delta waves with a frequency around
0.5–2 Hz. Further, HR, BP, and RR remain consistent, but are reduced from that of wake.
Muscle tone, however, is greatly reduced and eye activity presents the fewest movements
in this stage [3,7,8]. Following N3, it is common to re-enter N2 and eventually N1 before
beginning REM; however, there are many situations in which behavior deviates from
this pattern.
Substantially the most variable stage, REM or paradoxical sleep, is most strongly
characterized by its suppression of muscle tone throughout the body coupled with a
significant number of rapid movements of the eyes. Though these physiological trends are
indicative of phasic REM periods, the microstructure of REM sleep also involves periods of
tonic REM, which elicits notably different physiological signals [10]. Brain activity during
REM is predominantly mixed frequency waves of low voltage, primarily manifesting as
theta waves in the 3–8 Hz range in much of the brain, aside from faster beta waves of
15–35 Hz in regions of the frontal lobe [11]. Because phasic and tonic components of REM
sleep involve significant autonomic activation of the sympathetic and parasympathetic
systems, respectfully, cardiac and respiratory patterns are of high variation. During tonic
REM, HR is typically low and similar to that of NREM, whereas phasic REM results in
HR increases with much variation, which has been theorized to coincide with dreaming
activity [12]. Of note, peripheral BP tends to decrease during both tonic and phasic REM
by result of the increased shunting of blood flow to the brain [13].
3. Traditional Methods of Sleep Assessment
Human sleep experiments are traditionally conducted in laboratory-based settings
using polysomnography (PSG), which continuously monitors cardiorespiratory and neuro-
physiological changes in the body to characterize sleep related phenomena [14]. PSG is a
multi-parametric evaluation that utilizes electroencephalography (EEG), electromyography
(EMG), and electrooculography (EOG) measures to assess the electrical activity of the
brain, degree of muscle tone (generally of the chin and limbs), and eye movement, respec-
tively [15]. Concurrently, cardiac activity is measured via electrocardiographic (ECG) leads
placed on the chest, blood oxygen levels through pulse oximetry, and respiration patterns.
This industry accepted, “gold standard” group of physiological measures plays a crucialSensors 2021, 21, 5071 5 of 26
role in obtaining the most accurate information required for differentiation of wakefulness
from sleep, sleep stage classification, and the diagnosis of sleep-related disorders [14].
Following collection, data captured from each of the individual signals is individually
appraised in 30 s segments, termed epochs, that are then manually categorized by tech-
nicians according to standardized criteria. There are currently two different criteria for
stage classification; standards from the American Academy of Sleep Medicine (AASM),
which is more widely used, and criteria from Rechtscaffen and Kales. AASM scoring
classifies epochs as either wake, N1, N2, N3, or REM, where N signifies the three stages of
non-rapid eye movement sleep (NREM) and REM represents rapid eye movement sleep
(REM) [16]. Criteria from Rechtschaffen and Kales classifies epochs as either wake, S1, S2,
S3, S4, or REM, where S signifies stages one through four of NREM sleep [17]. Due to the
nature of manual classification, there are reportedly large variations in interrater reliability
(IRR), with interrater agreements sometimes as low as 70% [18–21]. Measures to mitigate
error often include repeated analysis of the data epochs by different technicians in which
results are then aggregated.
Though most accurate, PSG is an arduous and expensive endeavor and must be con-
ducted in a controlled, laboratory environment in the presence of skilled technicians. In an
attempt to simplify the complexity of sleep monitoring via PSG, actigraphy has become
a popular alternative, providing an indirect measure of sleep by assessing movement
through a wearable, wrist-based device. Unlike most PSG assessments, actigraphy can
measure sleep in the comfort of an individual’s own home, reducing the “first night affect,”
and providing the opportunity to assess normative sleep patterns. Although considered
a reliable method for sleep research, actigraphy is limited to only wake vs. sleep clas-
sifications [2,22]. Further, actigraphy is associated with high error rates and commonly
overestimates sleep in many individuals [2,23]. This method is known to substantiate
artifacts related to breathing movements, postural blocking of arm movement, low activity
tasks, and external movement [22,24].
Well-documented sleep logs can help to ascertain artifact from signal; users are often
asked to keep a well-documented sleep log to ensure sufficient removal of the unwanted
data. This task is not only a burden for the researcher and consumer, but it also presents
a new opportunity for error [22]. Subjective reports of sleep lack significant insight on
physiology, and of the measures that individuals are able to report on, research still often
demonstrates poor degrees of accuracy [25,26]. The technology to accurately quantify
sleep undoubtedly exists, but the associated limitations largely affect the accessibility and
applications for evaluation of sleep.
Both PSG and actigraphy are used in research and clinical settings; however, the ap-
plicability of these methods on a larger scale is limited by the level of expertise and cost
associated with operating such specialized equipment and software used to perform sleep
analysis. Through the advent and proliferation of sensor capabilities, advanced computing
power of mobile devices, analysis techniques, and storage capacity, bimodal sleep technolo-
gies are emerging on the market as an attempted solution to bridge the gap in limitations
and allow for sleep analysis in a free-living environment.
4. Device Capabilities and Methods of Measure
Wearable devices that purport to assess sleep often utilize a combinatorial approach;
this technique incorporates one or more embedded sensors to obtain various measures that
estimate physiological signals, which are further used in attempts to classify sleep-related
physiology [27]. Common sensor types that are often embedded in emerging wearables
include accelerometers, electrocardiographs, gyroscopes, photoplethysmographs (PPG),
and thermal sensors. The aforementioned sensors each provide valuable insight regarding
physiological parameters that vary in their capacity to estimate sleep related phenomena.
Table 1 contains common commercially available sleep wearables and include the em-
bedded mechanisms they use to collect these parameters. These devices often incorporate
multiple sensor types, that when combined, have the opportunity for improved accuracy ofSensors 2021, 21, 5071 6 of 26
sleep classification. It is important to note that though many of these devices utilize similar
types of technology, the sensors themselves are likely to be manufactured with varying
specifications and capacities to measure the output of interest. An in-depth evaluation of
each of the sensors are described in the following sections.
Table 1. This table includes device specifications for common commercially available wearable technologies that claim to
assess sleep. Information regarding each device has been obtained via its respective company resources, where available
for release, including specifications of the photoplethysmographic sensor, if applicable, for the device. It is important to
note that while a sensor may be embedded in a device, it does not ascertain that it is used in sleep evaluation; sensors
denoted by an asterisk (*) have been confirmed by company resources to not participate in sleep quantification efforts.
Reflective arrangements of PPG sensor components listed as reflective are direct unless otherwise specified. (ECG,
electrocardiography; gen., generation; LED, light emitting diode; N/A, not applicable; NTC, negative temperature coefficient;
PPG, photoplethysmography).
PPG Specifications
Device Location Sensors
Type Light Source(s) Arrangement
Accelerometer
Amazon Halo Wrist PPG Contact Green LED Reflective
Temperature Sensor
Accelerometer
ECG Infrared
Apple Watch Series 6 Wrist Contact Green LED Reflective
Gyroscope
Red LED
PPG
Fatigue Science Readiband Wrist Accelerometer (3-axis) N/A N/A N/A
Accelerometer (3-axis) Infrared
Fitbit Ionic Wrist Contact Reflective
PPG Red LED
Accelerometer (3-axis)
ECG Infrared
Fitbit Sense Wrist Gyroscope Contact Green LED Reflective
PPG Red LED
Temperature Sensor
Accelerometer
Garmin Vivosmart 4 Wrist Contact Green LED Reflective
PPG
Accelerometer (3-axis)
OURA Gyroscope * Reflective
Finger Contact Infrared
(2nd gen.) PPG (angled)
Temperature Sensor (NTC)
Accelerometer
Polar A370 Wrist Contact Green LED Reflective
PPG
Accelerometer (3-axis) Green LED
Polar Grit X Wrist ECG/Electrical conductance Contact Red LED Reflective
PPG Yellow LED
Accelerometer (3-axis)
Capacitive Touch Sensor *
Whoop 3.0 Wrist Gyroscope (3-axis) Contact Green LED Reflective
PPG
Temperature Sensor *
4.1. Accelerometers and Gyroscopes
Accelerometers measure movement in terms of changes in velocity, providing input
on the frequency, duration, and intensity of motion [28,29]; they are the most commonly
used method in wearable device motion-sensing and are the primary sensor used in actig-
raphy devices [27,29]. Gyroscopes are devices that can effectively measure the changes in
angular velocity, or orientation, to determine the direction at which the object or person is
turning [30]. Accelerometers and gyroscopes are often used in unison as the outputs of each
device can be used to compliment the other in understanding changes related to movement.
The mechanical innerworkings of accelerometers and gyroscopes are beyond the
scope of this paper; however, it is important to note that the number of axes may varySensors 2021, 21, 5071 7 of 26
among devices. For instance, both accelerometers and gyroscopes can have a one-, two-,
or three-dimensional axis (x,y,z) that each pertain to movements of different directions [30].
The distinction among the number of axes plays an important role in distinguishing linear
or angular acceleration from orientation. For example, a 3-axis accelerometer can sense the
orientation of a stationary object relative to the Earth’s surface, but it is unable to distinguish
the acceleration of an object from the acceleration of gravity [30,31]. Meanwhile, gyroscopes
use the Earth’s gravitational pull in order to calculate the orientation or angular position
of an object in space, or the tilt and turn of an object; however, unlike accelerometers,
gyroscopes are unable to measure the direction of acceleration [30]. Therefore, the most
promising results implement a combinatorial approach of embedding both an accelerometer
and gyroscope into a wearable device [30,31].
Because of the relatively simplistic nature of accelerometers, these devices are sus-
ceptible to error and can incorrectly classify low activity tasks [24]. With specific regards
to measuring sleep, accelerometers can be affected by other movements made in the bed,
such as a partner rolling over or a pet jumping into bed. Additionally, accelerometers are
subject to inaccurate recordings in patients with neuromuscular impairments that may
cause tremors in the hand or body [32]. Nonetheless, when combined with other physio-
logical sensors, accelerometers can provide crucial context when classifying the activity of
an individual, especially when in relation to sleep and wakefulness.
4.2. Electrocardiography
Multi-lead electrocardiograph (ECG) outputs have been deemed the prominent sec-
ondary signal to assess sleep staging, secondary to EEG [15]. ECG measures the electrical
activity of the heart using electrodes that are placed on the surface of the skin [33]. ECG de-
vices use the conductance generated by the cardiovascular system to produce the PQRST
waveform characteristic of depolarization and repolarization of the various heart chambers;
from this wave, beat to beat heart rate and heart rate variability (HRV) related metrics can
be derived using the inter-beat-interval (IBI) [34,35]. IBI data represent the time interval (in
milliseconds) between two successive R peaks.
ECG devices can vary in the number of leads that are attached to the device. Conven-
tionally, assessment of cardiac functionality is obtained in a clinical setting using 12+ lead
ECG [36], where electrodes are placed in close proximity to the heart to ensure that the
signal to noise ratio remains minimal and constant [37]. The sampling frequencies of
multi-lead, clinical grade ECGs typically range from 250 to 500 Hz or higher [23,38,39],
though wearable devices often have much lower sampling rates to preserve battery life.
Multi-lead ECG devices, however, are not practical for the consumer population due to the
critical relative placement of electrodes and the technical expertise needed to interpret the
generated signal; thus, single lead ECG-based sensors have been embedded into wearable
devices, requiring minimal area of skin contact and reducing the opportunity for user
error. Despite the ease and utility of a single channel lead, there are known implications of
recording from only one source. Notably, single channel ECG are known to underestimate
the durations of the waveform complex [40].
Ultimately, the quality of the ECG signal is influenced by a multitude of factors,
whether it be the sampling frequency, number of leads, or how the signal is interpreted. Fol-
lowing signal acquisition, the ECG signal must undergo a series of signal processing steps
that include filtering, transformation, waveform recognition, feature extraction, and diag-
nostic classification [40]. However, the aforementioned method to effectively characterize
subsequent peaks from one another varies from one source to the next. Signal processing
of an ECG signal is often necessary as the devices are susceptible to artifact that presents
as baseline wander due to chest movement induced by respiration, issues with electrode
impedance, technical failures, or ectopic beats (e.g., arrhythmias) that result in missing or
double beats, further troubled by low sampling frequencies [2]. Various noise cleaning and
artifact detection algorithms have been proposed that utilize filtering techniques to remove
baseline wander, in combination with adaptative and moving thresholds to effectivelySensors 2021, 21, 5071 8 of 26
eliminate unwanted artifacts. Often, these noise-reduction algorithms are proprietary in
nature, leaving it unbeknownst to the end-user what is going on in the background.
4.3. Plethysmography
Photo, meaning “light”, and plethysmograph, meaning “measurement of changes in
volume,” directly translates to mean the measure of volumetric changes through use of light.
Photoplethysmography (PPG) is a common technology utilized in wearable devices that
aims to detect volumetric changes in distal arterial blood flow [41] by quantifying the
amount of light transmitted or reflected back to the photodetector [42,43]. The output of
the device is a pulsatile waveform that is sinusoidal (smoothened, periodical oscillations)
in nature, opposed to the distinctive R peaks found in an ECG.
Analysis of this waveform occurs using two distinct comparisons of the reflected signal
over time: alternating current (AC) and direct current (DC). The AC primarily measures
the highs and lows of vessel volume, reflective of alternating between systolic and diastolic
pressures respectively [44]. The DC focuses on the variation in the strength of reflected light
between repeated highs and lows; which can vary from influence of other physiological
occurrences, such as respirations. PPG sensors vary in their form, which generally coincide
with their intended use. Contact PPG in which the sensor has direct contact with the skin
is most often used in wearable devices but vary in the components and arrangement of
the sensor.
4.3.1. Components of Sensors
PPG sensors can contain different light sources that vary in their wavelength and
subsequent capacity to penetrate the skin. Namely, wearable devices generally either utilize
a green light emitting diode (LED) or a combination of red LED and infrared, ranging
around 520–560 nm and 800+ nm, respectively. The differences in wavelengths have
varying implications that could affect signal quality and accurate reporting. It is generally
postulated that the higher the wavelength of light, the deeper it is able to infiltrate the
tissue. For instance, higher wavelengths used in red or infrared light sources are less
susceptible to variations in error due to skin color [45,46]. The shorter the wavelength,
the more readily the light is absorbed by melanin; this phenomenon is a consequence of the
optical water window. Namely, tissue is primarily composed of water, which more readily
absorbs light in the ultraviolet or longer infrared spectrum [42]. Albeit, there exists a small
window where red and near infrared wavelengths are able to pass through tissue with
greater ease. Thus, green LED light sources present greater susceptibilities for error from
variations in skin color, as the wavelength is more readily absorbed by melanin pigments
in the skin, resulting in high variations in the amount of light able to return to the sensor,
independent of blood vessel properties [42,45,46].
Despite the shortcomings of green LED in individuals with darker complexions,
green light is more adept at measuring heart rate by consequence of the wavelength [31,45].
Because the green LED does not penetrate the skin as deeply, its signal is less position
dependent, primarily targeting superficial vessels [44]. Contrarily, red and infrared LEDs
surpass the capabilities of the green LED when measuring HRV parameters [47]; because
the light is able to penetrate deeper into the skin, it is able to interact with larger arterial
vessels that are positioned deeper in the tissue, which demonstrate greater volumetric
fluctuations with each heartbeat [44,48]. Furthermore, the differences in coloration have a
known impact in the absence or presence of motion, with red and infrared outperforming
green wavelengths during rest, such as during sleep, but often green outperforms the
higher wavelengths during periods of higher activity or motion.
It should be noted that sampling frequency has known implications on signal quality
and overall device performance, which is the case for PPG sensors as well as the other
sensors discussed herein. Both green and red LED/infrared light sources perform with
greater accuracy at a higher sampling frequency; higher sampling frequencies are ableSensors 2021, 21, 5071 9 of 26
to more effectively detect changes in the absorbed or reflected wavelengths as the blood
volume and pressure changes over time [31,49].
Signal quality influenced by ambient light is another notable factor, as all PPG sensors
use some form of a light source and photodetector. Like ECG based devices, contact
PPG sensors should always lay flush against the skin, with sufficient pressure to capture
readings, without applying too much pressure that could restrict blood flow in underlying
tissues [50]. Thus, if a device is attached loosely to the skin, the amount of light transmitted
or reflected back to the photodetector may not be truly indicative of the signal at hand.
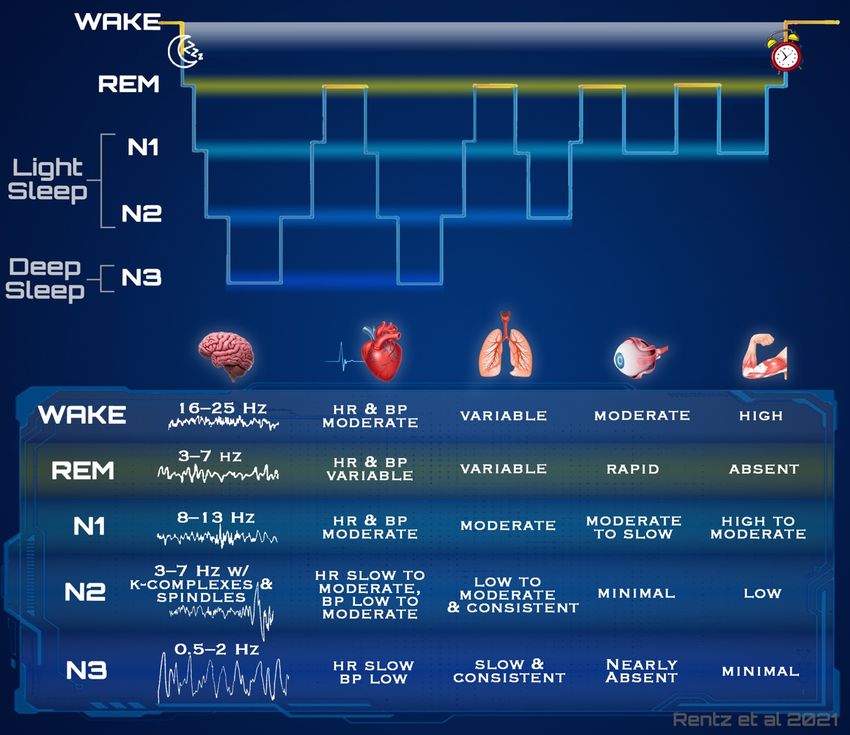
4.3.2. Arrangement of Sensors
There are two basic arrangements of PPG sensor components that comprise the
wearable PPG device market; transmissive and reflective [44]. As shown in Figure 2,
transmissive sensors use a light emitting source that is detected by a photodetector located
on the opposite side of a tissue. This type of sensor is limited to measurement of certain
Sensors 2021, 21, x FOR PEER REVIEW 10 of 26
anatomical locations, such as at the fingertips or earlobes, which are thin enough for the
signal to penetrate. In contrast, reflective sensors detect the amount of light that is reflected
or back scattered from the tissue to the adjacent photodetector. Unlike transmissive sensors,
Due to
reflective the positionalhave
configurations dependency of PPG devices
less constraints (most commonly
on the placement placed at
of the sensor; the most
resultingly,
reflective
distal partsPPG offers
of the bodya more convenient
such as the wrist,configuration for the
ankle, or finger), end-users ashighly
signal is these devices can
susceptible
bemotion
to easily placed around
artifacts, whichthe
canwrist, or affect
greatly on anatomical locations
data accuracy with thicker
[47,51,52]. Namely, tissues.
motionAsar-a
resultdisrupts
tifact of its reflective properties
the quality of theand its more
signal fromsuperficial targets,
blood vessel green LED
volumetric is more
trends, widely
especially
utilized in a reflective arrangement, are rarely seen in transmissive PPG; however,
during bouts of high intensity activities. This particular issue should have little impact on infrared
and red
sleep LEDsclassifications,
staging are often utilized in both
unless arrangements.
the device Device
was designed to manufacturers
cater to converginghaveaims
also
started
such as designing devices with
exercise monitoring, numerous
which will be light sourcesin
discussed ofmore
varying wavelengths,
detail as seenTo
in later sections. in
the Polar
obtain Grit X, understanding
a cleaner, that they
more representative eachnoise
signal, demonstrate
cleaning benefits
algorithmsandare
limitations under
often incorpo-
different
rated intoconditions.
the overall system architecture.
Figure 2. Arrangements
Figure 2. Arrangements of Photoplethysmography (PPG)
of Photoplethysmography (PPG) Sensor
Sensor Components.
Components. The The two
two primary
primary arrangements
arrangements of of PPG
PPG
sensors, Reflective and Transmissive, as they pertain to the position of the light source and sensor in relation to target
sensors, Reflective and Transmissive, as they pertain to the position of the light source and sensor in relation to target blood
blood vessels. Reflective arrangements are further segregated based upon the relative positioning of the light source and
vessels. Reflective arrangements are further segregated based upon the relative positioning of the light source and sensor as
sensor as either direct or angled.
either direct or angled.
4.4. Temperature Sensors
Many commercial devices utilizing PPG sensors are arranged in a manner that re-
quiresMeasures of body
the reflecting temperature
signal to returncan be estimated
to almost from
the exact skin temperature
location using a from;
that it was emitted vari-
ety
thisofdirect
sensors that may
reflection include
places infrared
a high thermopiles,
dependency thermistors,
on proper sensorthermoelectric
placement to effects,
ensure
or measure
that via optical
it is positioned methods
above [53]. These
the target bloodsensors
vessel. vary in their
Primarily capacity
seen to estimate
in wrist-based body
devices,
temperature, as some methods are more vulnerable to variations in ambient temperature.
The direction at which a sensor faces and the degree of contact can make a sensor more
susceptible to environmental influences.
Temperature sensors vary largely in the data in which they collect. In general, these
sensors provide indirect measures of temperature based upon characteristics of an adja-
cent tissue. Sensors containing thermistors, which can include negative or positive tem-Sensors 2021, 21, 5071 10 of 26
this arrangement presents the opportunity for error resulting from slight variations in
anatomy. Risk of sensor misplacement can be mitigated through slight alterations in com-
ponent arrangement; by separating the light source from the photodetector and including
multiple light sources, the likelihood of interacting with the target vessel increases as a
result of reduced positional dependency. This angled reflective arrangement is demon-
strated in Figure 2. Angled arrangements, however, are often avoided due to the required
customizability of the product to gross anatomy (i.e., wrist or finger circumference); for
more universal applications, wrist-based devices are typically designed to fit all sensor
components on the watch back, allowing for easier exchange of watchbands based on
customer preference.
Due to the positional dependency of PPG devices (most commonly placed at the most
distal parts of the body such as the wrist, ankle, or finger), the signal is highly susceptible to
motion artifacts, which can greatly affect data accuracy [47,51,52]. Namely, motion artifact
disrupts the quality of the signal from blood vessel volumetric trends, especially during
bouts of high intensity activities. This particular issue should have little impact on sleep
staging classifications, unless the device was designed to cater to converging aims such as
exercise monitoring, which will be discussed in more detail in later sections. To obtain a
cleaner, more representative signal, noise cleaning algorithms are often incorporated into
the overall system architecture.
4.4. Temperature Sensors
Measures of body temperature can be estimated from skin temperature using a vari-
ety of sensors that may include infrared thermopiles, thermistors, thermoelectric effects,
or measure via optical methods [53]. These sensors vary in their capacity to estimate body
temperature, as some methods are more vulnerable to variations in ambient temperature.
The direction at which a sensor faces and the degree of contact can make a sensor more
susceptible to environmental influences.
Temperature sensors vary largely in the data in which they collect. In general,
these sensors provide indirect measures of temperature based upon characteristics of
an adjacent tissue. Sensors containing thermistors, which can include negative or posi-
tive temperature coefficients (NTC and PTC, respectively), measure a value of material
resistance for conductivity [54]. Thermoelectric sensors utilize a measure of voltage that is
carried through a material or tissue, which will vary based upon the temperature of the
tissue. Other optical and infrared thermopile sensors measure the interaction between
infrared light and the tissue of interest, basing temperature estimations from different
response properties.
5. Application of Sensors for Sleep Estimation
Arguably the most significant limitation of “measuring sleep” is simply the inability
to measure the key variable (sleep); instead, sleep can only be estimated through quantifi-
cation of the physiological elicitations that are characteristic of a given state. Sensors of
wearable devices are able to capture some of the physiological trends that occur during
sleep, either directly from primary signals or indirectly through interpretation of collected
signals. Though some physiology is virtually impossible to measure through typical
limb-mounted devices, sensors determining concurrent behavior of the muscular, nervous,
cardiac, and respiratory systems are among common methods deployed in attempts to
estimate sleep.
5.1. Sensor Utility in Capturing Physiology
A broad understanding of neuromotor activity can be achieved from data collected
from accelerometers and gyroscopes. Movement is captured often in terms of acceleration
(change in velocity over time) and can be used to quantify activity intensity. Postural
dependencies (standing vs. lying down) can be determined by gyroscopes or the combi-
nation of accelerometer data with time to derive velocity and displacement. Collectively,Sensors 2021, 21, 5071 11 of 26
these measured patterns in movement are suggested to coincide with muscle tone and
motor stimulation. During sleep, human motion typically occurs at a rate of 1–25 Hz,
which can then be expressed in activity counts [55]. It is thought that movement above
a specific threshold is indicative of wake due to the high muscle tone and freedom of
motor activity at this state. The main limitation with accelerometers and gyroscopes is
the assumption that a “lack of movement” is sleep, thus implying that motionless wake
intervals are likely to be incorrectly classified as sleep. This leads to overestimations in total
sleep time and sleep efficiency, as well as underestimations in sleep onset latency (SOL)
and wake time after sleep onset (WASO) [56].
Cardiac behavior is often evaluated using one of two methods: directly through elec-
trical waveforms from ECG, or indirectly through the pulse pressure waveform (PPW)
from PPG. ECG waveforms are composed of PQRST waves that are indicative of electrical
stimulation for the opening and closing of chambers and valves within the heart [34,35].
When collected using a single lead from a distal location, such as the wrist, the most notable
depiction is of the R peaks, which can be seen in Figure 3. This maximum voltage value
indicates stimulation for contraction of the heart’s ventricles and is the most distinct marker
suggestive of a heartbeat [34]. General rate of R peak occurrence from the ECG signal
provides a measure of HR. Similarly, relative variation in the time between consecutive
R peaks for a given time frame contributes to calculation of HRV variables. This direct
measure of conductivity waveform allows for considerable accuracy surrounding HRV;
these variables can provide insight as to the balance between sympathetic and parasym-
Sensors 2021, 21, x FOR PEER REVIEW
pathetic autonomic activity, offering a valuable set of measures when determining sleep 12 of 26
trends [57–59].
Figure3.3.AAcomparison
Figure comparisonof ofcardiovascular
cardiovascularsignals
signalsininwearable
wearabledevices.
devices.The
Theelectrocardiogram
electrocardiogram(ECG)
(ECG)
waveform is shown relative to the volumetric waveform obtained via photoplethysmography
waveform is shown relative to the volumetric waveform obtained via photoplethysmography (PPG).
(PPG). Of note, the volumetric changes that are demonstrated in the PPG waveform captured at a
Of note, the volumetric changes that are demonstrated in the PPG waveform captured at a distal
distal anatomical location travel slower than the electrical impulses that are captured by ECG, re-
anatomical
sulting in alocation travelofslower
slight delay than
features, the electrical
though impulses thatto
highly proportional are captured
that of ECG.by ECG, resulting in
a slight delay of features, though highly proportional to that of ECG.
PPG waveforms can also provide insight on physiology and bio-signals beyond HR
The other method of observation surrounding activity of the cardiac system is through
and HRV; in combination with the AC component, the DC component can be used to
the PPW measured via PPG. Through utilization of sensor components, PPG measures
estimate patterns in RR and peripheral resistance [50,60], both of which can vary with
the resultant strength of the reflected light and estimates the variations in blood volume
sleep arousals. As respirations occur, the highs and lows of the reflected light signal
from a vessel carrying blood away from the heart. These vessels expand as a result of the
strength vary, which becomes superimposed on the shape of the AC component. The
increased pressures from heart contraction, producing a waveform that is also depicted
more subtle fluctuations in signal strength can provide insight on the inflation and defla-
in Figure 3 as it compares to the output of ECG. The pulsatile AC component is used to
tion of the lungs [44,60,61]. RR is particularly useful in discriminating between sleep
stages, with more stable and regular RR amplitude and frequency patterns indicative of
non-REM, particularly deep sleep.
Temperature sensors are not as widely utilized in classifying sleep due to their high
susceptibility to be influenced by external and internal factors. Collectively, these sensorsSensors 2021, 21, 5071 12 of 26
measure pulse rate as a surrogate for HR and HRV related metrics, which are calculated
from the peaks in the PPW, similar to the IBI calculation from ECG R-R intervals [44,60].
PPG waveforms can also provide insight on physiology and bio-signals beyond HR
and HRV; in combination with the AC component, the DC component can be used to
estimate patterns in RR and peripheral resistance [50,60], both of which can vary with
sleep arousals. As respirations occur, the highs and lows of the reflected light signal
strength vary, which becomes superimposed on the shape of the AC component. The more
subtle fluctuations in signal strength can provide insight on the inflation and deflation
of the lungs [44,60,61]. RR is particularly useful in discriminating between sleep stages,
with more stable and regular RR amplitude and frequency patterns indicative of non-REM,
particularly deep sleep.
Temperature sensors are not as widely utilized in classifying sleep due to their high
susceptibility to be influenced by external and internal factors. Collectively, these sensors
may aim to measure overall peripheral body temperature or skin temperature. While theo-
rized to relate to core body temperature, known to decrease with the occurrence of sleep
onset, trends in peripheral temperature are more indicative of neural thermoregulatory con-
trol via vasoconstriction and vasodilation of the blood vessels in the hands and feet [9,62].
Though core body temperatures tend to vary by less than 1 ◦ C throughout the night, skin or
peripheral temperature variations can span as drastically as 2–3 ◦ C [62]. With this, there are
converging theories surrounding the relationship between the temperature of the periph-
ery, where these sensors are located, and core body temperature during sleep. Theories
speculate as to whether the two are consistently reflective of the same trend or whether
peripheral thermoregulation can act in a converging manner to contribute to core body
temperature fluctuations [9,62,63]. Additionally, internal factors such as fever or menstrual
cycles are known to cause variations in body temperature, deeming this a difficult variable
for wearable devices to rely on. The added complexity surrounding temperature sensors
relative to their insight in quantifying sleep often results in their exclusion from devices
altogether; if included, these sensors are most commonly used as a variable contributing to
the determination of sleep onset or sleep quality based on individualized normative values.
5.2. Device Claims vs. Methodologial Capabilities
As behavior modulates during sleep, all equipped sensors for a device will con-
currently collect any physiological measures in which they are capable of quantifying.
As Figure 1 demonstrated previously, there is much overlap in the signals capable of
measurement via the sensors explained herein. Thus, it is the behavioral insight that
is obtained from various perspectives that allow for state classification, or further sleep
staging. Comparatively, wearable devices estimate only a portion of these physiological
signals, making it a significant challenge to confidently classify a stage to each epoch.
Traditionally, wearable devices have struggled with identifying the precise timing for
which an individual transitions from a relaxed, wakeful state into sleep [64]. Patterns for
HR, HRV, and RR are of high similarity based upon relaxation and increased parasym-
pathetic tone; however, previous research has focused specifically on physiology during
this period, finding that quantifiable differences exist in HRV parameters immediately
surrounding sleep onset based upon subtypes in sleep behavior [65]. Further, little move-
ment often occurs during this transition, making determinations of sleep onset difficult,
which has been well demonstrated across validation studies [64,66,67]. Though for years
actigraphy has been deemed an acceptable method for differentiating sleep vs. wake,
wakeful periods of high relaxation and no movement have been commonly known to
be incorrectly classified as sleep [68]. Without EEG and EMG signals to aid in this deter-
mination, a combination of relative HR, HRV, and RR parameters must suffice for sleep
onset classifications. In devices equipped with temperature sensors, the decrease in body
temperature associated with sleep onset can provide valuable information to augment
this designation.Sensors 2021, 21, 5071 13 of 26
Following the initial onset of sleep, fluctuations in movement, HR, HRV, and RR
parameters can provide notable value for sleep stage differentiation, though with different
methodology as compared to the feature identification and epoch classification of tradi-
tional PSG. EEG provides, unarguably, the greatest insight on a given sleep stage, including
those of NREM; sleep spindles and K complexes, signature features of stage 2, as well
as the characteristic slow waves of stage 3, are not identifiable through most commercial
wearables utilizing the sensors explained herein. During sleep, these cortical oscillations
are of high relation to autonomic tone at a given point, demonstrating strong relationships
with the balance of sympathetic and parasympathetic activity [69]. Despite the abrupt
increases in HR and BP that accompany spontaneous cortical activity such as sleep spindles,
these patterns are not reported to be the focus of associated feature extraction in automated
scoring; without EEG to affirm the occurrence of a sleep spindle, this altered waveform
displayed in sensor signals could be caused by numerous factors. Rather, peaks in the
pulsatory waveform are used for extensive HRV calculations, which are not traditionally
calculated for PSG scoring [57–59,70–73]. Calculations such as low frequency (LF), very low
frequency (VLF), and high frequency (HF) are often used to quantify time sensitive vari-
ations in pulsatile wave characteristics. Thus, these cardiac patterns will be reflected in
composite HRV parameters, which have been found to aid in the differentiation of light
from slow wave sleep [57]. These HRV parameters are suggested to be significant indica-
tors of sympathetic activity (primarily LF and VLF) and vagal-nerve, or parasympathetic,
activity (primarily HF) [74]. Similarly, respiratory patterns are derived from variations in
waveform shape (i.e., the DC component of the PPW), and provide context on respiratory
rate, breath cycle, and breath variability, which are also key indicators of autonomic bal-
ance [58,75,76]. The lack in EEG and EMG signals, traditionally vital contributors to NREM
staging during PSG, demonstrate the requirement for a different approach to physiological
sleep stage classification.
Of most difficulty, epoch classification as REM sleep using the physiological param-
eters captured via wearable devices is challenged by the scarcity of identifying features
for the stage. Specifically, wearables lack sensors capable of providing insight regarding
muscular atonia and rapid eye movements, which are signature attributes of REM sleep tra-
ditionally captured via EMG and EOG, respectively. Instead, the lack of muscle tone is tied
to the lack of movement captured by accelerometers, though the limitations of this assump-
tion are widely recognized in validation studies as being insufficient [68]. Wearable signals
also lack demonstration of sawtooth EEG waves, further limiting context on this otherwise
easily distinguishable stage when assessed via PSG. The only resulting physiological trends
that can provide discernment on the existence of REM behavior are trends in HR, HRV,
and RR that wearables often quantify via PPG. As discussed previously, these measures
can demonstrate much variability during REM sleep, unlike other stages; notable spikes
in HR and RR can occur just as frequently as mellow lows [58,70,71,77], suggesting these
epochs of the often called “paradoxical sleep” can easily be confused with wake and light
sleep, respectively [10]. Without other data types to ascertain these assumptions that are
based primarily on cardiac and respiratory trends, confidently classifying a given epoch as
REM is of high difficulty.
6. System Architecture for Classifying Sleep
Sleep monitoring systems have assuredly progressed throughout the ages, due to the
rapid growth of the Internet of things, which includes the development of more sophisti-
cated sensors and software, and advancements in the storage of big data. Although the
advancements in technology make automated sleep classification systems more achievable,
the classification of sleep and its respective stages remains an arduous and challenging task.
Namely, sleep is a culmination of complex physiological and psychophysiological variables
that cannot be directly captured or quantified. As mentioned previously, sleep is “captured”
using secondary signals that aim to provide some level of understanding surrounding an
individual’s state of wakefulness. Capturing the physiological metric(s) of interest is onlySensors 2021, 21, 5071 14 of 26
the first step in an overall architecture that intends to classify an instance as sleep vs. wake,
or as a sleep stage.
Behavioral patterns associated with changes in sleep stage modulate specific physio-
logic patterns that can be detected by wearable sensors just as they can be via traditional
monitoring methods utilized in PSG. An algorithm, or series of problem-solving operations
can be used to determine how the patterns or combinations of patterns are related in their
ability to classify a specific state or stage. The patterns can be recognized and manipu-
lated by mathematical equations that find commonalities between the ingested bio-signals
(e.g., increase in HR and acceleration could suggest a wakeful state) and subsequently
apply them to a categorical classifier (e.g., sleep vs. wake, or wake vs. light vs. deep vs.
REM). Studies have demonstrated that parameters associated with respiration, heart rate,
and movement are most adept at sleep stage recognition [78]. Specifically, a recent study
published by Altini and Kinnunen (2021) demonstrated that device accuracy for four stage
detection increased from 57% to 79% when using accelerometer, temperature, HRV, and cir-
cadian features rather than just accelerometry alone [77]. Similarly, studies published by
Fonseca et al. (2017) and Walch et al. (2019) also found sleep algorithm accuracy to increase
following the addition of PPG data, as compared to accelerometer data alone [70,79].
Traditionally, sleep monitoring in the free-living environment was driven by actig-
raphy devices that used accelerometers to link changes in motion to differentiate sleep
and wakefulness, with reported accuracies typically varying from 80% to 95% [80,81]. Cur-
rently, there are several validated and publicly available algorithms that provide a binary
classification of sleep or wake (1 for sleep, 0 for wake), such as the Cole–Kripke or Sadeh
algorithms [29,82,83]. The new generation of sleep monitoring utilizes a combinatorial ap-
proach of multiple sensor types to distinguish changes in sleep macrostructure, specifically
sleep staging, via the collection of multiple bio-signals. Multiple measurements provide an
added layer of redundancy that improves the quality of algorithm classification, as some
signals may overlook a particular bit of information that may subsequently be captured by
another. Additionally, some signals do not generalize well for some users. For instance,
accelerometers largely overestimate sleep in those that do not move a lot, while underes-
timating sleep in restless sleepers or those sleeping with a partner or pets. This initially
led to further alterations of movement thresholds for some algorithms, like separation into
“sensitive” and “normal” modes as done previously by Fitbit [84]. The combination of
multiple signal types undeniably requires more robust methods to effectively collate and
manipulate signal types from various sensors of varying sampling frequencies, resolution,
and quality.
Algorithm accuracy is largely driven by signal quality; therefore, noise cleaning
algorithms aim to remove unwanted artifacts (associated with movement, technical failures,
ectopic beats, etc.) that disrupt the overall signal quality. Following the acquisition of
the signals of interest, signal processing schemes are often embedded within the device’s
firmware, noted by the real-time display of metrics such as HR, on the user interface of
the device. The types of techniques used to clean signals vary based on the type of sensor
and signal that they aim to capture; further, these noise-cleaning algorithms vary alongside
sensor specifications and sampling frequencies and are often proprietary.
Sleep classification algorithms utilize machine learning techniques to effectively
“learn” from a given dataset and make informed decisions surrounding sleep or wake,
or further into sleep staging. Typically, sleep algorithms utilize supervised techniques
using pre-labeled PSG data collected in a clinical setting [2,24]. It should be noted that
this is an onerous undertaking, as these algorithms require a large amount of training
data to produce accurate results; otherwise, a small sample size translates to a lack of
inter-individual generalizability and subsequent over-fitting of the model. Training models
are fundamentally influenced by inter-technician PSG scoring and inconsistencies in noise
cleaning algorithms between different manufacturing companies, often leading to dimin-
ished overall accuracy [2]. Prior to model execution, an extensive amount of pre-processing
must be implemented to ensure proper synchronization and temporal alignment of PSGYou can also read