2021 Report on UCEDD-University Relationships and Agreements
←
→
Page content transcription
If your browser does not render page correctly, please read the page content below

2021 Report on
UCEDD-University Relationships
      and Agreements
    Jamie Koenig, Association of University Centers on Disabilities

 This document was published by the Association of University Centers on Disabilities and funded by the
  Administration on Intellectual and Developmental Disabilities through technical assistance contract #
HHSP233201600066C. The contents of this document do not necessarily reflect the views or policies of the
 Administration on Intellectual and Developmental Disabilities, Administration on Community Living, US
                  Department of Health and Human Services or the US Government.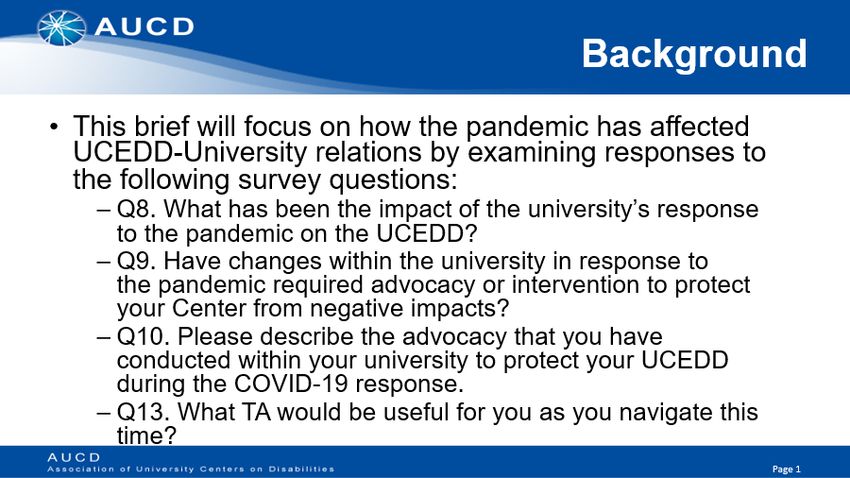
Table of Contents
Summary ....................................................................................................................................................... 2
Background ................................................................................................................................................... 3
Methodology................................................................................................................................................. 3
       Table 1: Distribution of Responses Relative to Administrative Homes ................................................ 3
UCEDD Faculty & Staff .................................................................................................................................. 4
       Table 2: Level of Faculty Integration in the University ......................................................................... 5
University Services and UCEDD Needs ......................................................................................................... 5
       Table 3: Extent that University Services Meet UCEDD Needs .............................................................. 6
UCEDD Finances ............................................................................................................................................ 6
       Table 4: Strengths in the University-UCEDD Relationship .................................................................... 7
The Relationship with the University ............................................................................................................ 7
   Strengths ................................................................................................................................................... 7
       Relationship .......................................................................................................................................... 7
   University Demonstrations of Support ..................................................................................................... 7
   Cultivating Partnerships and Champions .................................................................................................. 8
       Table 5: Strategies Used to Cultivate Partnerships and Champions (34 Responses) ........................... 8
   Marketing the UCEDD ............................................................................................................................... 9
       Table 6: Strategies Used to Market the Value of the UCEDD ............................................................... 9
   Challenges ................................................................................................................................................. 9
University-UCEDD Agreements ................................................................................................................... 10
       Table 7: Current Status of Agreement ................................................................................................ 10
Themes and Observations of the MOUs ..................................................................................................... 10
       Table 8: Administrative Home and Type of Agreement ..................................................................... 10
Differences Across University Homes ......................................................................................................... 11
       Table 9: Financial Provisions by Administrative Home ....................................................................... 11
Notable Items that Appear in a Small Number of Agreements .................................................................. 11
       Table 10: Selected Statements of Beliefs, Principles, and Values ...................................................... 12
Renegotiating the Agreement..................................................................................................................... 12
Conclusion ................................................................................................................................................... 13
Appendices.................................................................................................................................................. 14

                                                                                                                                                                1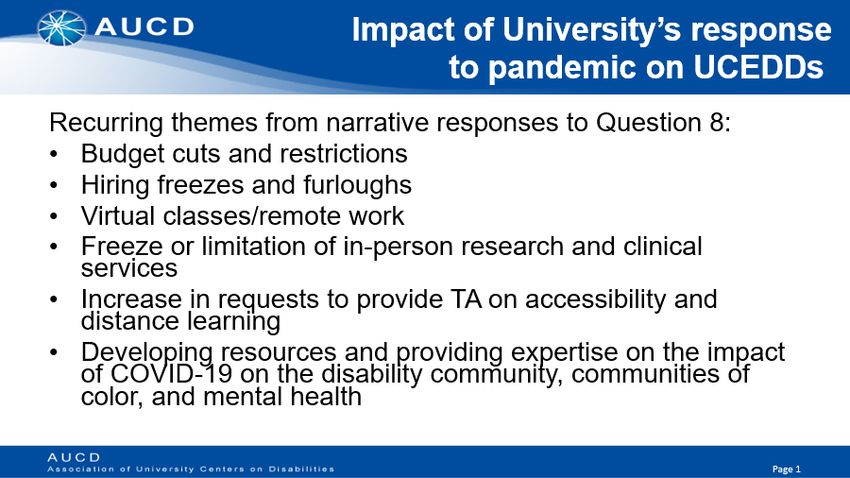
Summary
This report is a follow up to a 2008 report that analyzed the agreements between University Centers for
Excellence in Developmental Disabilities (UCEDDs) and their home or partner universities. In addition to
updating the analyses of that report, this report incorporates additional data to better understand this
relationship across the UCEDD network. For this purpose, a survey about university-UCEDD
relationships, both before and during the COVID-19 pandemic was disseminated to UCEDD directors in
August 2020 and agreements were requested from all UCEDDs. Analysis of survey responses and
common components of the written agreements, both required and not, contributed to a better
understanding of the university-UCEDD relationship. This report explores frequent themes and content
areas of UCEDD agreements with their host universities, as required by grant renewal applications. This
report is intended to provide information and ideas to UCEDD directors in managing their center’s
relationship with their university. As part of this, the collected agreements have been put in a library so
that the UCEDD Resource Center (URC) can share examples, with permission, when requested.

The timing of this report is significant, given, that 42 UCEDDs will be applying to renew their core grants
in 2022. Since 2015, the UCEDD Funding Opportunity Announcement (FOA) has required documentation
of “a written agreement (MOU) or charter with the University which specifies the:

    1. UCEDD designation as an official, independent university component;
    2. The relationships between the UCEDD and other university components;
    3. The University’s commitment (including financial and other resources) to the UCEDD and the
       UCEDD’s commitment to the university; and
    4. That the UCEDD Director reports directly to a university administrator who will represent the
       interests of the UCEDD within the university.”

Different language was used in previous FOAs to describe the requirements for written and signed
agreements.

The agreement is intended to help establish the UCEDD’s organizational capacity to meet the goals for
the UCEDD core grant and the Developmental Disabilities Assistance and Bill of Rights Act of 2000 (DD
Act). This law mandates that UCEDDs “shall be interdisciplinary education, research, and public service
units of universities […] of public or not-for-profit entities associated with universities” (Sec. 153(a)(1)).
The annual FOA contains additional requirements for the application to better establish the relationship
between the University and the UCEDD. These aspects could be included in the MOU or other parts of
the application and include items about organizational structure, leveraging resources, including diverse
individuals, the qualifications of the UCEDD director, the qualifications of the faculty and staff, the
Consumer Advisory Committee, collaborative relationships with DD Network partners, and participation
in community networks. The 2021 FOA and an archive of FOAs since 2015 are available on the URC
website.

In the MOU and survey analysis, some themes emerged. Formal UCEDD-University agreements tended
to prioritize administrative components of their relationships, over addressing issues of UCEDD mission
and function. Additionally, UCEDDs frequently identified financial support as a key way universities
showed support (15/34). These supports, however, appear insufficient as almost a third (11/35) of
respondents cited financial challenges in their relationship with the University.

                                                                                                             2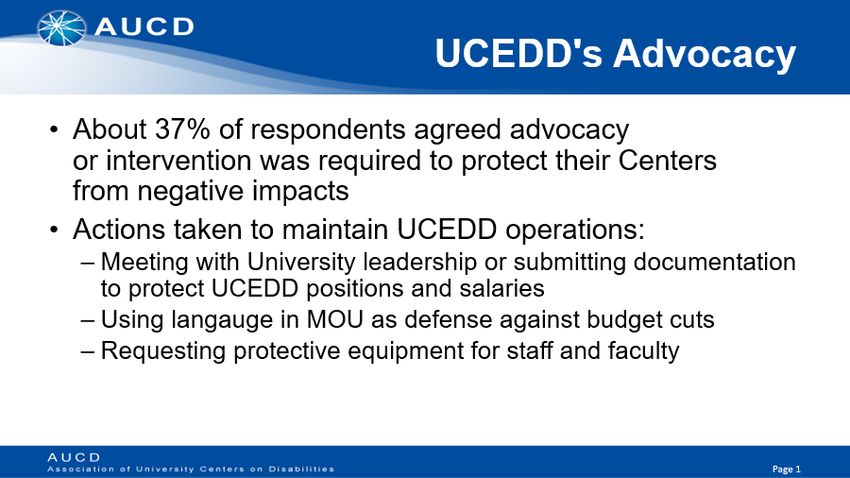
Background
The Association of University Centers on Disabilities (AUCD) supports 67 UCEDDs, 52 Leadership
Education in Neurodevelopmental Disabilities (LEND) Programs, and 14 Developmental Disability
Research Centers (IDDRCs).

The largest of the three networks is that of the UCEDDs, which receive core funding administered by the
Office of Intellectual and Developmental Disabilities (OIDD) within the Administration for Community
Living (ACL), US Department of Health and Human Services. Currently, OIDD funds 671 UCEDD grants.
One grant funds the Pacific Basin UCEDD (PBUCE), which has sites in two pacific territories. In this way,
the UCEDD network covers every US state and Territory. The core functions that each UCEDD is
responsible for performing as defined by the DD Act (Sec. 153(a)(2)) are:
         (A) Provision of interdisciplinary pre-service preparation and continuing education of students
         and fellows…
         (B) Provision of community services—
                  (i) that provide training or technical assistance for individuals with developmental
                  disabilities, their families, professionals, paraprofessionals, policymakers, students, and
                  other members of the community; and
                  (ii) that may provide services, supports, and assistance for the persons described in
                  clause (i) through demonstration and model activities.
         (C) Conduct of research, which may include basic or applied research, evaluation, and the
         analysis of public policy in areas that affect or could affect, either positively or negatively,
         individuals with developmental disabilities and their families.
         (D) Dissemination of information related to activities undertaken to address the purpose of this
         title...
To implement the core functions, UCEDDs leverage their core funding from OIDD to expand their reach
and partner with other federal, state, and local resources.

Methodology                                   Table 1: Distribution of Responses relative to Administrative
For this report, AUCD sent email              Homes
requests to all UCEDD Directors in              Administrative Home          Full             MOU         Survey
August 2020 and February 2021 to                                             Network          Sample      Respondents
request the completion of a                     Hospitals                    30.9%            41.3%       33.3%
University Support survey and                   Administrative Office        26.5%            19.6%       30.8%
submission of the UCEDD’s written               School of Education          22.1%            17.4%       23.1%
agreement with the associated                   School of Health             11.8%            15.2%       10.3%
university or institution of higher             School of Human              4.4%             4.3%        2.6%
learning. Ultimately, 48 (70.5%)                Services
UCEDDs filled out the survey, and 46            Other/Not Clear              4.4%             2.2%        0%
responded to the call for MOUs

1
  For the purposes of this report, 68 is used as the number of UCEDDs as PBUCE has two sites each with their own
local relationship to their host institutions of higher learning. The denominator reflects the existence of 68 distinct
agreements between a UCEDD and college or university.

                                                                                                                      3
(67.6%). Two respondents reported not currently having formal MOUs in place. The analysis thus looks
at the 44 formal agreements shared.

As a whole, UCEDDs that submitted MOUS had administrative homes reflective of the network
distribution (see Table 1); the proportion located in medical centers (41.3%), administrative offices
(19.6%), schools of education (17.4%), or another department (21.7%) reasonably approximated that of
the entire network.

Qualitative analysis was completed on the shared MOUs. The entire sample was analyzed for themes.
Additional elements were tracked based on the DD Act, FOA, Regulations, and 2008 Report. Some
common elements not meeting these criteria were also tracked. Each document was analyzed and
coded for these elements.

The survey was designed in consultation with the UCEDD Resource Center’s Project Advisory Committee
(PAC) members and addressed COVID-19-related changes in the university as well as long-standing
practices and relationships between the UCEDD and University. (See Appendix F for the full set of survey
questions.) There were 44 distinct respondents to the survey and are representatively distributed across
administrative homes (see Table 1).

This survey was disseminated during the height of the COVID-19 pandemic response, and thus,
responses reflected the pandemic’s significant impact on UCEDD and University relationships. This
report attempts to address more permanent components of these relationships by focusing on MOUs
and longer-term questions, to better understand long-term relational structures. However, all survey
responses were impacted by the immediate context. Analysis of the COVID-19 questions was presented
to UCEDD Directors in September 2020. See Appendix F for the full set of survey questions.

All 25 survey questions were optional, so the number of responses varies across questions; 4 questions
addressed the COVID-19 pandemic and the remaining 21 addressed university-UCEDD relations more
broadly. The survey included multiple question formats, open-ended responses and Likert scales ranging
1-5, with 1 being ‘Not at All’ and 5 being ‘Thoroughly’. Basic quantitative analysis was done on the Likert
scale questions to get means and medians across all respondents. With open-ended responses, themes
were identified, and qualitative coding was conducted on all questions to sort and categorize responses.

UCEDD Faculty & Staff
Based on survey responses, UCEDD staff sizes varied greatly. The 33 UCEDDs2 that reported FTE (Full
Time Equivalence) had a mean of 63 FTE and a median of 36 FTE. The range of 277 (6-283) and standard
deviation of 70.1 reflect the strong right skew. Despite the mean of 63 FTE, over two-thirds of
respondents (24) were below both the mean and 50 FTE. Two UCEDD directors explicitly cited empty
positions and difficulty filling them at the time of the survey, suggesting that figures could be
suppressed. When describing the distribution of UCEDD employees between faculty and staff, a
significant majority (78.4%, 29/37) reported being more than 50% staff. Only 5 (13.5%) of the 37
responding UCEDDs reported being over half faculty and 3 (8.1%) stated about an even split between
staff and faculty. The pattern of being predominantly staff persisted across UCEDDs regardless of

2
    Analysis is based on 33 responses. A 34th response was given but did not specify FTE: “80 full and part time staff.”

                                                                                                                       4
Carnegie Classification, budget size, or administrative home. (See Appendix C, Table 3; Appendix D,
Table 3; and Appendix E, Table 3.)

For faculty members, 36 UCEDDs reported which appointment types existed within their center. Most
prevalent was a research appointment (66.7%, 24/36), however, clinical (52.8%, 19/36) was also quite
common. Twenty (55.6%, 20/36) respondents indicated they had tenured faculty, while 12 (33.3%)
indicated that there were tenure track faculty. Non-tenured faculty were reported by 19 (52.8%)
respondents. See Appendix A, Table 13 for the full breakdown of appointment types and tenure status.

When asked “At what level are the faculty at the UCEDD integrated into your university?” with response
options:

    a. Relational Integration (working closely and collaboratively with others in academic units)
    b. Administrative Integration (holding specific roles and responsibilities within the academic units)
    c. Financial Integration (funded by academic units)

Respondents on average indicated that they were more integrated on a relational level than on
administrative or financial levels (see Table 2).

Table 2: Level of Faculty Integration in the University
                                           To a             To a
                   Not at     Not        Moderate        Significant     Thoroughly
                   all (1)   Much (2)    Degree (3)      Degree (4)          (5)          Mean     Median
   Relational         1        4            13               15               5            3.5       4
 Administrative       7        9            15                2               5           2.71       3
   Financial         12        12            3                9               2           2.39       2

The pattern of being most integrated relationally and least integrated financially persists across all
Carnegie classifications, budget sizes, and studied administrative homes. (See Appendix C, Table 2;
Appendix D, Table 2; and Appendix E, Table 2 for full details.)

Faculty responsibilities to the university vary significantly between UCEDDs. Of the 38 survey
respondents who reported on university responsibilities for faculty, 2 (5.2%) respondents reported that
there were no expectations, over half (68.4%, 26/38) cited requirements to serve on committees. About
a third of respondents (34.2%, 13/38) reported duties related to teaching and curriculum, as well as an
expectation for collaboration. (See Appendix B, Table 1 for full breakdown and Appendix G, Table 3 for
full responses.) Notably, beyond being required to serve on committees, 38.2% of respondents (13/34)
reported that serving on committees, either required or optional, was an effective strategy for
cultivating partnerships and champions. Furthermore, 62.7% (10/16) of survey participants reported
collaboration more broadly as an effective strategy to advance the UCEDD’s mission and reputation.
(See Appendix B, Table 11 for full breakdown and Appendix G, Table 11 for full responses.)

University Services and UCEDD Needs
The survey asked how well various university services met UCEDD needs. Below, Table 3 indicates that 7
of the 8 university services included in the survey moderately or significantly met UCEDD needs.

                                                                                                            5
Respondents most frequently reported that HR/Personnel Management (3.87/5), General Counsel
(3.71/5) and Tech Support (3.68/5) significantly or thoroughly met their needs.

Table 3: Extent that Various University Services Meet UCEDD Needs
                     Not at      Not        To a            To a         Thoroughly     Mean     Median
                     All (1)    Much      Moderate       Significant         (5)
                                 (2)      Degree (3)     Degree (4)
 Fiscal/Grant        2         5         11             13              7               3.47     4
 Management
 Government          2         9         13             4               9               3.24     3
 Affairs
 General Counsel     3         5         7              8               15              3.71     4
 Tech Support        1         5         10             11              11              3.68     4
 Communications      3         10        14             6               5               3.00     3
 Evaluation          14        10        8              1               4               2.22     2
 Human               1         1         11             14              11              3.87     4
 Resources or
 Personnel
 Management
 Accommodations      4         7         11             6               7               3.14     3

Only Evaluation Support was deemed to not at least moderately meet UCEDD needs (2.22/5). Based on
the qualitative survey responses, the dearth of evaluation support appears to be a minor concern for
responding directors; only 3 (10%, 3/30) UCEDDs mentioned insufficient evaluation supports in their
discussion of available University services (see Appendix B, Table C for full breakdown and Appendix G,
Table 6 for full responses). Refer to Appendix C, Table 6; Appendix D, Table 6, and Appendix E, Table 6 to
see how these needs are addressed across Carnegie Classifications, budget sizes, and administrative
home.

UCEDD Finances
Fifteen (15) of 37 responses (40.5%) reported that UCEDDs were expected to be self-sufficient or did not
receive monetary support from their universities. Other than that, financial expectations largely varied
across universities. Analysis of qualitative survey responses revealed few common expectations for fiscal
and grant management, which were to leverage funds as federally required (13.5%, 5/37), use the
standard budgeting practices of the University (10.8%, 4/37), and direct money to the university through
indirects, clinical revenue, and contracts (10.8%, 4/37). See Appendix B, Table 5 for complete responses.

Financial support from the university most frequently came in the form of facility and infrastructure
support (73.5%, 25/34). These supports included paying for space, custodial services, and technology.

At least half of respondents indicated a return on indirect funds (50%, 17/34) or salary support (52.9%,
18/34) from the university. Among those who specified an amount for the return of indirect costs, rates

                                                                                                          6
ranged from 9% to 80%, with one outlier removed3. The mean return of the 13 who reported a specific
percentage was 41%4, and the standard deviation was 2.6%.
The Relationship with the Table 4: Strengths in the University-UCEDD
University Relationship
Integration with University & 10
Strengths Support
When discussing strengths, the most Recognition/Value 9
frequent response was about having Autonomy 3
effective integration with the university Specific Programs or Capacities 3
and its support structures (28.6%, 10/35). Relationship
Financial 2
Nine (9) UCEDDs (25.8%) cited the
university’s recognition and promotion of
the center’s work as another major strength. Financial supports and the autonomy for the UCEDD to
make its own decisions were minimally reported, at 3 (8.6%) and 2 (5.7%) responses, respectively. See
Appendix G, Table 7 for complete responses.
Aligning the mission and goals of the center with
University Demonstrations of Support
The university demonstrates its support for the that of the university, schools, and academic
UCEDDs in a variety of ways, most commonly departments. Showcasing the talent and the
through financial support and public interdisciplinary expertise, and our track record
recognition. Over half of respondents (52.9%, of convening partners and stakeholders around
18/34) noted supportive public recognition critical issues. We have been a very desirable
from their UCEDD. While 15 reported financial
partner over the past year.
support as a demonstration of support, 11 of
35 (31.4%) respondents elsewhere reported
their biggest challenges with the university were financial. These responses have some overlap,
reflecting how some UCEDDs have an ambivalent financial relationship with their host institutions. See
Appendix G, Table 4 for complete responses.
Given the current UCEDD Network priority of advancing diversity, equity, and inclusion initiatives within
centers, it is promising that 5 centers of 34 responding centers (14.7%) reported that their university
sought the UCEDD’s contribution for campus-wide efforts on similar initiatives. These technical
assistance requests from universities suggest that the network is well-positioned to make an impact on
this work, both within the UCEDD and for the broader higher education community.
Five UCEDDs shared that they are contributing to campus-wide initiatives promoting
diversity, equity, and inclusion.
3
One response of .33% was excluded due to concerns that it was a typographical error.
4
One response gave a range: “9-15%.” For the purpose of the mean, the median 12% was used.
7Cultivating Partnerships and Champions
Twenty-one (21) of 34 respondents
(61.8%) indicated that effective Table 5: Strategies Used to Cultivate Partnerships and
collaboration is the most important way Champions (34 Responses)
to create partnerships and find Collaboration 21
champions. Of the 21 citing Committee & Other Group Participation 13
collaboration, over half (61.9%, 13/21) Advancing University Priorities 8
indicated that committee or other group Personal Relationships & Networking 7
participation was an important way to Hight Quality Work & Grants 7
enhance university relationships, Other 3
including when it exceeded minimum
university requirements. Other notable strategies included participating in cross-department projects
and getting more faculty involved in the UCEDD’s work to advance its position. Seven (7) responses
(20.6%) indicated that developing personal relations and networking was critical for fostering this
collaboration.
To attract partners, 7 credited the high quality of their UCEDD’s work and grants for naturally attracting
interested partners within the university. By doing excellent work, potential partners take initiative with
outreach, rather than the UCEDD needing to initiate a relationship.
Demonstrating how UCEDD work furthered university priorities
was a key strategy for 8 respondents. While not necessarily We have had significant success
targeted at specific individuals, the support and alignment in raising awareness of the ways
indicated creates goodwill from the university administration and our CED, Health Sciences Center
can positively impact on the UCEDD in the future.
(HSC), and larger University
The most mentioned champions for UCEDDs were Deans or could collaborate. Each year or
Associate Deans, with 19 of 36 (52.8%) respondents mentioning 5-year period, we come in with a
them. Also common, with about one third of respondents list of those ideas for discussion.
reporting them, were department heads (30.6%, 11/36), provosts
or associate/vice provosts (30.6%, 11/36), and other faculty that
did not fit into any of the major categories (33.3%, 12/36). A third (33.3%, 12/36) of responses also
included champions labeled ‘other,’ such as General Counsel, key members of the University Board of
Trustees, and operational units on campus like residence life, financial services, and student health.
Notably, 4 of 36 (11.1%) UCEDDs included various campus-wide programs and offices around diversity
and disability as major champions. Given the UCEDD networks current focus on equity, diversity, and
inclusion, these offices could be good potential champions for UCEDDs looking for more productive
partnerships and champions.
One UCEDD reported not having any “real champions.” See Appendix B, Table 12 and Appendix G, Table
9 for additional information about UCEDD champions across the network.
8Marketing the UCEDD
When asked about strategies to market the value and visibility of the UCEDD, there was frequent
mention of marketing the UCEDD both within the University environment and in the broader
community. Interestingly, however, no one communication
method was mentioned by a majority of UCEDDs; 14 of 35 (40%) Table 6: Strategies Used to
responses ended up classified as ‘Misc. Communication’ because Market the Value of the UCEDD
there was little commonality. Some entries were vague, i.e., Misc. Communication 14
“communication tools,” while others were specific methods, Strategic Partnerships 10
including radio programs, lunchtime topical seminars, academic Social Media 7
publications, knowledge translation, and visual summaries. Some In House Comms Team 7
of these responses also mentioned work to tighten or improve University News Sources 5
communication plans, but no details were given. Social media Nothing to Note 4
was specifically mentioned by 7 of 35 (20%) UCEDDs, but only Newsletters 3
Press Releases 3
one platform was mentioned once (Facebook), and no other
Other 2
specifics were given.
The broad range of employed communication strategies could be reflective of the fact that only 7 of the
35 responses reported an in-house communications team or person within the UCEDD. Quite a few
others mentioned relying on the university communications team, which resulted in inconsistent
attention and promotion for some UCEDDs.
The strategy most mentioned for marketing the
value and visibility of the UCEDD was leveraging The strengths include our portfolio of externally
strategic partnerships (29.4%, 10/34). These funded projects is valued at the college and
partners included other departments,
university levels. Increasingly we are being accessed
individuals in the community, and key state
to provide supports related to equity, diversity, and
disability and minority-serving institutions. Full
responses about marketing strategies can be inclusion. Challenges include the incentive-based
found in Appendix G, Table 11. budgeting model... Another major challenge is how
separate our work and personnel are from most
Challenges academic programs. We can end up working in
There were 35 responses to the survey parallel rather than in an integrated way.
question asking respondents to explain the
strengths and weakness of the UCEDD
relationship with the University. Most addressed challenges that were particular or unique to their
setting. Of those more widely applicable, financial challenges (31.4%, 11/35) and difficulties navigating
the university bureaucracy or system (22.9%, 8/35) were most common.
On top of this, 4 (11.4%) explained how the university did not understand the UCEDD’s work, which
complicated advancing the work and mission of the UCEDD. This deficit in understanding is doubly
problematic given that many UCEDDs rely on the University Communications team to generate publicity.
While not mentioned under challenges, 4 out of 35 (11.4%) UCEDDs reported having no formal strategy
to market the UCEDD when discussing how they market the visibility of the UCEDD. This suggests that
inability to get public recognition and support due to lack of communication supports is another
9difficulty faced by some centers. See Appendix B, Table 8 and Appendix G, Table 7 for more complete
information.
University-UCEDD Agreements
The request for agreements received 46 responses, however 2 of those reported having no existing
formal agreement. As such, agreements between UCEDDs and Universities were collected from 44 of 68
centers. Of these, 37 (84.1%) were designated as Memorandum of Understanding (MOU),
Memorandum of Agreement (MOA), or Agreement. Charters (13.5%, 5) and Assurances (2.7%, 1) were
also submitted. Submitted agreements came from multiple administrative homes, and the distribution
of university administrative home was representative of the entire network. See Table 1 for full results.
The survey asked about the current
statuses of these agreements with Table 7: Current Status of Agreement
their universities. The majority of the In the process of reviewing and revising agreement 3
30 responses (76.7%, 23/30) No changes being made, but some change desired 4
reported that no changes were being No changes being made, none desired 23
made and that none were desired.
Slightly over half (56.8%, 25/44) of the received agreements were open-ended, with no specific end
date, though some of these specifically stated that the agreement is valid until the parties choose to
review and update it.
Table 8: Administrative Home and Type of Agreement
Administrative Home
University
Hospitals, Schools Schools of
of Medicine, or University Health or Schools of
Type of Depts. Of Administrative Schools of Public Human
Agreement Pediatrics Offices Education Health Services Other Total
Agreement, 18 5 7 5 2 1 37
MOA or
MOU
Charter 1 4 5
Assurances 1 1
No Formal 2 2
Agreement
Total: 19 9 8 7 2 1 46
Themes and Observations of the MOUs
Agreements were primarily focused on the administrative relationship of the University and UCEDD.
Content about UCEDD's mission and purpose or OIDD funding requirements was less prevalent. Of the 9
items that showed up in at least 50% of agreements, 6 were focused on administrative and personnel
10issues. The 40% of agreements that discuss the individual UCEDD work and mission provided broad
overviews rather than specifying any areas of focus within the IDD field.
University support of space and facilities was included in 35 of 40 agreements (79.5%); 40% (14/35) of
those specify and guarantee accessibility. An uncommon inclusion was the commitment to pursue data-
driven strategies (6.8%, 3/44). The MOUs do not elaborate what these strategies include.
Differences Across University Homes
Given the small number of some homes, it is not possible to fully compare across administrative homes
or draw significant conclusions (See Appendix I for tests of statistical significance). This report will,
however, touch upon a few differences, despite the lack of statistical significance. This section only looks
at UCEDDs housed in administrative offices, hospitals/med schools, schools of education, and schools of
health. Other categories were excluded due to low response rate.
While 84.1% (37/44) of submitted agreements were MOUs, MOAs, or agreements, only 55.6% (5) of the
9 responding UCEDDs housed in administrative offices fell into that category. The remaining 4 UCEDDs
housed in administrative offices have charters in place, accounting for 80% of the 5 submitted charters.
Schools of Health appear less likely to include specifications about the center’s autonomy, with only 1 of
6 mentioning it (16.7%). This is compared to 36.8% (7/19) of hospital/med school agreements, 55.6%
(5/9) of administrative office agreements, and 62.5% (5/8) of school of education agreements.
For financial provisions, administrative offices are least likely to say that grant funds supplement rather
than supplant existing funding but most likely to specify a return or reduction of indirect costs to the
UCEDD (See Table 9
Below). However, few of
Table 9: Financial Provisions by Administrative Home
these differences were
statistically significant (See Grant Funds Supplement, Return or Reduction
Not Supplant on Indirect Costs
Appendix I, Tables 1 and 2
Administrative Offices 0 (0.0%) 6 (66.7%)
for t-values and p-values).
Hospitals/Med Schools 4 (21.1%) 1 (5.3%)
Lastly, agreements with Schools of Education 3 (37.5%) 2 (25.0%)
Schools of Health were Schools of Health 3 (50.0%) 1 (16.7%)
least likely (40%, 2/5) to
specify that university
personnel policies applied to and covered UCEDD staff and faculty. This provision was included in 77.8%
(7/9) of administrative office agreements, 68.4% (13/19) of hospital/med school agreements, and 87.5%
(7/8) of school of education agreements.
Notable Items that Appear in a Small Number of Agreements
A few notable items showed up in one or two agreements and demonstrate how these agreements can
be used to obtain assurances beyond the standard requirements. Notably, in the survey, one center
reported that “the only challenge is the difficulty for people to access the UCEDD because we are on a
large campus with a lot of students and limited parking spaces near the building.” Another center’s
agreement with their university offers a way to address this. In that agreement and its guarantee of
11accessibility, the university promises to “provide at least four (4) parking spaces for community
members utilizing [Center] services.”
Other interesting items that showed up in a small number of agreements included:
• Provision for ownership of all research and data: the center “will maintain the right of usage of
all research data and products developed through funds leveraged by […] faculty until they are
no longer deemed essential to the UCEDD core functions.”
• A process for dispute resolution: "A. Any disputes with respect to this MOU will be presented to
the President for resolution within a timely manner. B. In any event there is a conflict of interest
with the President, the President Advisory Council will resolve the dispute within a timely
manner."
• AUCD membership: "The [administrative home] will disburse the cost of the membership fee
and will encourage the continued participation of the [UCEDD] in the Association of University
Centers for Excellence, as mandated by the Developmental Disabilities Act of 2000."
• Education programming: “The University Shall: 1. Assume full responsibility for planning and
execution of educational programs including programming, administration, curriculum content,
faculty appointment, faculty administration, and the requirements for matriculation, promotion,
and graduation." This agreement, and a few others, provide specific details about
responsibilities around program requirements for both the university and UCEDD.
• Extra assurance of community feedback: "Before the application was submitted, [the UCEDD]
provided its Community Advisory Council and the public and the State DD Council and
Protection and Advocacy system an opportunity to comment on the application."
• Detailed statements of beliefs, principles, and values.
Table 10: Selected Statements of Beliefs, Principles, and Values
“We believe that:
• All people are capable of learning. […]
• To the maximum extent possible, persons with disabilities should be integrated into, rather
than isolated from, the communities in which they reside.
• Effective services are characterized by a balance of living, teaching, and support elements
that enable each individual to exercise his or her fundamental rights. […]
• Components of service delivery include at least the following: A safe environment; support
and instruction, as necessary; recreation; leisure activities; nutritious and good tasting food;
health care; clean and appropriate clothing; the dignity of risk; freedom to make choices;
community inclusion and participation; integration; social support; friends; and the
opportunity for happiness.”
Renegotiating the Agreement
The survey questions addressing negotiations around the MOU had the fewest responses, at 8 and 9,
compared to 30-38 responses for all other open-ended questions. This significant gap could indicate that
UCEDDs have had few opportunities or reasons to negotiate with their Universities about the MOU. This
approach is supported by the fact that strategies for revision were offered by all UCEDDs who reported
12previous major revisions. No responses were received from those who had not previously undergone
significant revision. Based on outside discussions with UCEDD Directors, however, it is also possible that
these response rates reflect uncertainty about how to approach these negotiations and not knowing
what technical assistance from AUCD would be helpful.
The technical assistance requested to help with agreement revision was most notably for help enforcing
the MOU and understanding the university’s legal responsibility (50%, 4/8). For example, one
respondent said the only change “needed is for the university to abide by its agreement” and another
wished for “an understanding of the University’s legal responsibility to the UCEDD.” Strategies already
found effective for revision were using federal/state requirements (44%, 4/9) and effective
communication (55.6%, 5/9). The 4 UCEDDs (44.4%) who used federal/state requirements discussed
“[leveraging] the UCEDD reapplication as a time point to get agreements in writing” and “citing the DD
Act regulations within the MOU and aligning with institution policies.”
Conclusion
Clear patterns exist across the UCEDD network, including having high staff to faculty ratios, strong HR
and personnel support from the University, and a desire for more intentional marketing strategies.
University support varies considerably across the UCEDD network, both what happens in practice and
what is established in the UCEDD-University agreement. While no one agreement covers all aspects of
the relationship, there is a clear effort across the network to be compliant with the requirements
established in the FOAs (See Appendix H).
The diverse experiences of UCEDDs across the network offer guidance and lessons for directors and
UCEDDs evaluating their relationships with the University. Shared MOUs offer innovative methods to
address specific concerns, like reserved parking and community involvement in decision-making.
Contact Information
Requests for additional information on this topic including requests for example MOUs should be
directed to Jamie Koenig (jkoenig@aucd.org), Program Specialist for AUCD’s UCEDD Resource Center.
13Appendices Table of Contents
Appendix A: Tables from MOU Analysis (n=44) ....................................................................................... 17
Table 1: 10 Most Common Items ........................................................................................................ 17
Table 2: Administrative Support and Structure .................................................................................. 17
Table 3: UCEDD Function .................................................................................................................... 17
Table 4: Funding .................................................................................................................................. 18
Table 5: Representation, Rights, and Access for People with Disabilities .......................................... 18
Appendix B: Tables from Qualitative Analysis ........................................................................................ 19
Table 1: Type of Responsibilities UCEDD Faculty & Staff Must Contribute to the University (n=38) . 19
Table 2: What TA Would Help with Revising Your Agreement (n=8).................................................. 19
Table 3: What Strategies Have You Found Effective in Revising Your MOU? (n=9) ........................... 19
Table 4: Please Provide a Narrative Description of the Financial Types of Support Noted Above
(n=34) .................................................................................................................................................. 19
Table 5: Financial Expectations that the University Has for the UCEDD (n=37) ................................. 19
Table 6: Narrative Description of the Types of Services Available to the UCEDD from the University
(n=30) .................................................................................................................................................. 19
Table 7: Strengths in the UCEDD Relationship with the University (n=35)......................................... 20
Table 8: Challenges in Your Relationship with Your University (n=35) ............................................... 20
Table 9: Ways the University Has Demonstrated that the UCEDD Matters to the University Mission
(n=34) .................................................................................................................................................. 20
Table 10: Strategies Used to Cultivate Partnerships and Champions (n=34) ..................................... 20
Table 11: Strategies Used to Market the Value and Visibility of the UCEDD (n=35) .......................... 20
Table 12: Key Champions within the University (n=36) ...................................................................... 20
Table 13: Types of Faculty Appointment Held by UCEDD Faculty (n=38) ........................................... 21
Appendix C: Tables for Analysis by Carnegie Classification .................................................................... 22
Table 1: Distribution of Carnegie Classifications................................................................................. 22
Table 2: At what level are the faculty at the UCEDD integrated into your university? Mean (Median)
............................................................................................................................................................ 22
Table 3: What is your ratio of faculty and staff at your UCEDD? ........................................................ 22
Table 4: Average FTE by Carnegie Classification ................................................................................. 22
Table 5: Please select which of the following types of financial support you receive from the
University. ........................................................................................................................................... 22
Table 6: To what extent are your UCEDDs needs in the following areas met by university services?
Mean (Median) ................................................................................................................................... 23
Appendix D: Tables for Analysis by Budget Size ..................................................................................... 24
14Table 1: Distribution of Budget Sizes .................................................................................................. 24
Table 2: At what level are the faculty at the UCEDD integrated into your university? Mean (Median)
............................................................................................................................................................ 24
Table 3: What is your ratio of faculty and staff at your UCEDD? ........................................................ 24
Table 4: Average FTE by Budget Size .................................................................................................. 24
Table 5: Please select which of the following types of financial support you receive from the
University. ........................................................................................................................................... 24
Table 6: To what extent are your UCEDDs needs in the following areas met by university services?
Mean (Median) ................................................................................................................................... 25
Appendix E: Tables for Analysis by Administrative Home ...................................................................... 25
Table 1: Distribution of Administrative Homes .................................................................................. 25
Table 2: At what level are the faculty at the UCEDD integrated into your university? ...................... 25
Table 3: What is your ratio of faculty and staff at your UCEDD? ........................................................ 26
Table 4: Average FTE by Administrative Home ................................................................................... 26
Table 5: Please select which of the following types of financial support you receive from the
University. ........................................................................................................................................... 26
Table 6: To what extent are your UCEDDs needs in the following areas met by university services?
............................................................................................................................................................ 27
Appendix F: Survey Questions ................................................................................................................ 28
Appendix G: Open Ended Responses ...................................................................................................... 30
Table 1: What TA would help you in revising your agreement? ......................................................... 30
Table 2: What strategies have you found effective in revising your MOU? ....................................... 30
Table 3: Please describe the type of responsibilities UCEDD faculty and staff must contribute to the
university (i.e. participation on university committees, collaboration with other university
departments or other university community activities). .................................................................... 30
Table 4: Please provide a narrative description of the types of support you noted above. .............. 32
Table 5: What are the financial expectations that the University has of the UCEDD? ....................... 35
Table 6: Please provide a narrative description of the types of services available to you from your
university (including what other University services are used by your UCEDD in addition to those
above). ................................................................................................................................................ 36
Table 7: Explain the strengths and challenges in your relationship with your University. ................. 38
Table 8: In what ways has the University shown that the UCEDD matters to the university mission?
............................................................................................................................................................ 41
Table 9: Who are your UCEDDs key champions within the University? ............................................. 43
Table 10: What strategies have you used to cultivate partnerships and champions? ....................... 45
Table 11: What strategies have you used to market the value and visibility of the UCEDD? ............ 47
15Appendix H: Legal Regulations and Requirements ................................................................................. 50
Appendix I: Statistical Significance.......................................................................................................... 51
Table 1: MOU Specifies Funds Supplement Rather than Supplant..................................................... 51
Table 2: MOU Specifies Return or Reduction of Indirect Costs .......................................................... 51
Table 3: MOU Specifies University Support for Space/Facilities ........................................................ 51
Table 4: MOU Specifies Center Autonomy ......................................................................................... 51
Appendix J: Presentation on COVID-19 Survey Questions ..................................................................... 52
16Appendix A: Tables from MOU Analysis (n=44)
Table 1: 10 Most Common Items
Number Sharing Percent Sharing
Content Content Content Area
40 88.6% Specifies Core Functions
39 88.6% Explicitly States University Support for UCEDD
35 79.5% University specifies financial or other resources for the
10 Most Common Items
UCEDD
35 79.5% University provides facilities
34 77.3% UCEDD is responsible to a university administrator
31 70.5% Establishes Consumer Advisory Council (CAC)
31 70.5% UCEDD Staff Covered by University Personnel Policies
25 56.8% Purpose of the UCEDD Network
25 56.8% Addresses Faculty or tenure for UCEDD staff
19 43.2% Specifies Autonomy of UCEDD
Table 2: Administrative Support and Structure
Number Percent
Administrative Support and Structure
Sharing Sharing
Content Content Content Area
39 88.6% States University Support for the UCEDD
35 79.5% University specifies financial or other resources for the UCEDD
35 79.5% University provides facilities
34 77.3% UCEDD is responsible to a university administrator
31 70.5% UCEDD staff covered by university personnel policies
25 56.8% Addresses faculty or tenure for UCEDD staff
19 43.2% Specifies autonomy and organizational structure of the UCEDD
13 29.5% Advisory committee other than CAC*
12 27.3% Director Credentials
7 16.2% UCEDD Director Selection Process
*Non-CAC advisory committees included here as they are typically made up of university staff and
officials
Table 3: UCEDD Function
Number Percent
Sharing Sharing
Content Content Content Area
39 88.6% Specifies the four core functions
UCEDD Function
25 56.8% Purpose of the UCEDD network
17 38.6% Mission of individual UCEDD
15 34.1% Provides TA to the university related to disability
7 15.9% Disseminate info to state policymakers/legislature
2 4.5% Specifies data-driven strategic planning
17Table 4: Funding
Number Percent
Sharing Sharing
Content Content Content Area
Funding
15 34.1% Leverage additional public and private funds
11 25.0% Specifies return or reduction of indirect costs
9 20.5% Grant funds to supplement and not supplant other funds
Table 5: Representation, Rights, and Access for People with Disabilities
Number of Percent of
Agreements Agreements
Participation
Sharing Content Sharing Content Content Area
Disability
31 70.5% Establishes consumer advisory council
14 31.8% States UCEDD space must be accessible
3 6.8% Protects rights of people involved in program activities
18Appendix B: Tables from Qualitative Analysis
Table 1: Type of Responsibilities UCEDD Faculty & Staff Must Contribute to the University (n=38)
Committee Teaching &
Service Participation Collaboration Curriculum Research None Other
4 26 14 13 6 2 5
Table 2: What TA Would Help with Revising Your Agreement (n=8)
Help Enforcing MOU & Understanding University’s
Legal Responsibility Seeing Other MOUs Other
4 2 2
Table 3: What Strategies Have You Found Effective in Revising Your MOU? (n=9)
Using Federal/State Requirements Effective Communication
4 5
Table 4: Please Provide a Narrative Description of the Financial Types of Support Noted Above
(n=34)
Return on Indirect Salary Support General Funds Facility/Infrastructure Support Other
17 18 6 25 4
Table 5: Financial Expectations that the University Has for the UCEDD (n=37)
Expected Budgeting
Pay Own Way Leverage Funds Practices Money to the University Other
15 5 4 4 8
Table 6: Narrative Description of the Types of Services Available to the UCEDD from the
University (n=30)
Fiscal & Grant Oversight 9
Tech Support 7
HR Benefits 7
Lacks of Support 6
Library & Research Services 6
Other 6
Physical Space 5
Communications 5
General Counsel 5
Integrated – all available services 4
Evaluation 2
19Table 7: Strengths in the UCEDD Relationship with the University (n=35)
Specific Programs or Integration with University
Recognition/Value Capacities & Support Autonomy Financial
9 3 10 3 2
Table 8: Challenges in Your Relationship with Your University (n=35)
Financial Accessibility Division from University System or Not Understood by Other
Other Programs Bureaucracy University
11 2 2 8 4 2
Table 9: Ways the University Has Demonstrated that the UCEDD Matters to the University
Mission (n=34)
Public Recognition 18
Financial Support 15
Diversity Efforts 5
Support Services 3
No Support Shown at the University Level 2
Used for Program Advancement 2
Allowed Autonomy or Self-Direction 2
Other 2
Table 10: Strategies Used to Cultivate Partnerships and Champions (n=34)
Collaboration 21
Committee & Other Group Participation 13
Advancing University Priorities 8
Personal Relationships & Networking 7
Hight Quality Work & Grants 7
Other 3
Table 11: Strategies Used to Market the Value and Visibility of the UCEDD (n=35)
Misc. Communication 14
Strategic Partnerships 10
Social Media 7
In House Comms Team 7
University News Sources 5
Nothing to Note 4
Newsletters 3
Press Releases 3
Other 2
Table 12: Key Champions within the University (n=36)
Dean or Associate Dean 19
20Other Faculty (that don’t fit elsewhere) 12
Other 12
Department Heads 11
Provost or Associate/Vice Provost 11
Directors of Other Programs 7
Vice President 7
President and/or CEO 5
Programs for Diversity and/or Disability 4
Miscellaneous Administrators 3
None 1
Table 13: Types of Faculty Appointment Held by UCEDD Faculty (n=38)
Research 24
Clinical 19
Instructional 11
Outreach 6
Tenure 20
Non-Tenure 19
Tenure Track 12
Associate 22
Assistant 20
Adjunct 15
Emeritus 10
Other 10
21Appendix C: Tables for Analysis by Carnegie Classification
Table 1: Distribution of Carnegie Classifications
Carnegie Classification Number in Sample Number in Network
Doctoral – High Research 5 7
Doctoral – Very High Research 29 45
Master’s – Larger Programs 2 2
Master’s – Medium Programs 1 2
Mixed Bacc/Assoc 2 2
Spec 4y/med 4 9
Table 2: At what level are the faculty at the UCEDD integrated into your university? Mean
(Median)
Carnegie Classification Relational Administrative Financial
Doctoral – High 3.2 (3) 2.4 (3) 2 (2)
Research
Doctoral – Very High 3.7 (4) 2.96 (3) 2.6 (2)
Research
Spec 4y/med 3.25 (3.5) 2 (2) 1.25 (1)
Table 3: What is your ratio of faculty and staff at your UCEDD?
Carnegie Classification Mostly Faculty Mostly Staff About an even split
Doctoral – High 0 4 1
Research
Doctoral – Very High 3 18 1
Research
Spec 4y/med 0 3 1
Table 4: Average FTE by Carnegie Classification
Carnegie Classification Mean FTE (Median)
Doctoral – High Research 39.4 (40.5)
Doctoral – Very High Research 86.9 (39)
Spec 4y/med 27.9 (29.25)
Table 5: Please select which of the following types of financial support you receive from the
University.
Carnegie General Return on Rent Salary Cost of Equipment, technology,
Classification Indirect Operations or other material goods
Doctoral – 1 4 3 3 0 0
High
Research
22Doctoral – 14 10 10 14 6 8
Very High
Research
Spec 4y/med 2 3 2 3 0 2
Table 6: To what extent are your UCEDDs needs in the following areas met by university
services? Mean (Median)
Human Resources
Accommodations
Communications
General Counsel
management
management
Tech Support
Classification
or personnel
Government
Fiscal/grant
Evaluation
Carnegie
Affairs
Doctoral – High 3.6 2.6
3.2 (4) 2.4 (2) 3.6 (4) 2.2 (2) 1.2 (1) 4 (4)
Research (3) (2)
Doctoral – Very 3.7 3.4
3.4 (3) 3.8 (4) 3.1 (3) 2.3 (2) 3.7 (4) 3 (3)
High Research (3.5) (4)
Spec 4y/med 4.75 3.75
4 (4.5) 3 (3) 4 (4) 3 (3) 3 (2.5) 4.25 (4.5)
(5) (4)
23You can also read