9GLOBAL INSURANCE 1 GIMAR - International Association of ...
←
→
Page content transcription
If your browser does not render page correctly, please read the page content below
GLOBAL

           2019
INSURANCE
   MARKET
   REPORT
      [GIMAR]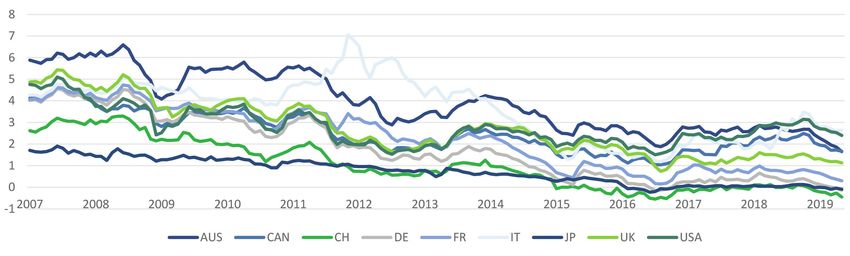
About the IAIS
The International Association of Insurance Supervisors (IAIS) is a voluntary membership organisation of insurance
supervisors and regulators from more than 200 jurisdictions. Since its establishment in 1994, its mission has
been to promote effective and globally consistent supervision of the insurance industry in order to develop and
maintain fair, safe and stable insurance markets for the benefit and protection of policyholders and to contribute
to global financial stability.

The IAIS is the international standard setting body responsible for developing principles, standards and other
supporting material for the supervision of the insurance sector and assisting in their implementation. It also
provides a forum for members to share their experiences and understanding of insurance supervision and
insurance markets.

The IAIS coordinates its work with other international financial policymakers, supervisors and regulators, and
assists in shaping financial systems globally. It is a member of the Financial Stability Board and the Standards
Advisory Council of the International Accounting Standards Board, and a partner in the Access to Insurance
Initiative. In recognition of its collective expertise, the IAIS is routinely called on by the G20 leaders and other
international standard setting bodies for input on insurance issues and the regulation and supervision of the
global financial sector.

This document is available on the IAIS website (www.iaisweb.org).
© International Association of Insurance Supervisors (IAIS), 2020.
All rights reserved. Brief excerpts may be reproduced or translated provided the source is stated.

Editing, design and layout by Clarity Global Strategic Communications.
CONTENTS
Acronyms and Abbreviations								1
Executive Summary 									2
About This Report									3
Chapter 1 – Macroeconomic and Financial Environment					 4
   1.1 International Economic Growth and Inflation					  4
   1.2 Financial Markets								5
Chapter 2 – Global Insurance Market Developments						 8
   2.1 Non-life Insurance								9
   2.2 Life Insurance									10
   2.3 Reinsurance									11
Chapter 3 – Special Topics								13
   3.1 Cyber-underwriting: Regulatory Considerations					13
      3.1.1 Introduction									13
      3.1.2 Market Overview								13
      3.1.3 Risk Management and Regulatory Considerations				  15
      3.1.4 Market Access and Potential Barriers to Entry					 18
      3.1.5 Conclusion									18
  3.2     The Risks of Interest Rate Spikes When Moving Out of a Low Interest Rate Environment 19
        3.2.1 Introduction: The Different Aspects of Interest Rate Risk for an Insurer		       19
        3.2.2 Moving Out of a Low Interest Rate Environment					                               22
        3.2.3 Conclusions									31
  3.3     Current Challenges in the Life Insurance Industry					 32
        3.3.1 Unit-linked Insurance Products						32
        3.3.2 Jurisdictional Developments							33
        3.3.3 Private Equity								41
        3.3.4 Conclusions 								42
Chapter 4 – Global Reinsurance Market Survey						 43
   4.1 Reinsurance Premiums								43
   4.2 Risk Transfer between Regions							45
   4.3 Assets										47
   4.4 Profitability									47
   4.5 Capital Adequacy								49
   4.6 Assets and Liabilities Allocation							50
   4.7 Liquidity									53
   4.8 Summary of Main Findings							54
References										55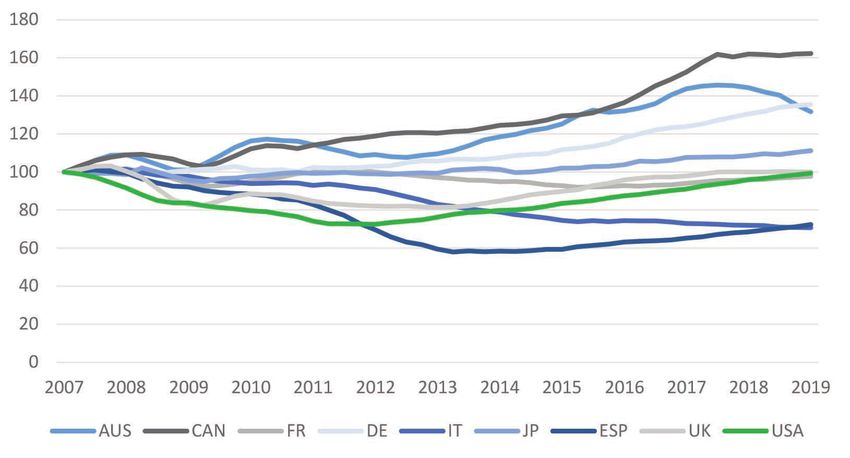
Acronyms and Abbreviations
    ACPR        French Prudential Supervision and Resolution Authority
    BaFin       German Federal Financial Supervisory Authority
    BIS         Bank for International Settlements
    BMA         Bermuda Monetary Authority
    EIOPA       European Insurance and Occupational Pensions Authority
    ESRB        European Systemic Risk Board
    EU          European Union
    FINMA       Swiss Financial Market Supervisory Authority
    FSA         Japan Financial Supervisory Authority
    FSC/FSS     Korean Financial Services Commission/Supervisory Service
    GDP         Gross domestic product
    GIMAR       Global Insurance Market Report
    IAIS        International Association of Insurance Supervisors
    IMF         International Monetary Fund
    InsurTech   Insurance technology
    IT          Information technology
    IVASS       Italian Institute for the Supervision of Insurance
    NAIC        National Association of Insurance Commissioners
    NBB         National Bank of Belgium
    OECD        Organisation for Economic Co-operation and Development
    PRA         Prudential Regulation Authority, Bank of England
    UK          United Kingdom
    ULIP        Unit-linked insurance product
    US          United States
    USD         United States dollar
    VIX         Volatility index
    ZZR         Zinszusatzreserve

1
EXECUTIVE
                                                                                                                SUMMARY
                                                                                                                    2

T
       his edition of the Global Insurance Market         Several insurers are also shifting their focus
       Report (GIMAR) discusses the global                towards asset management or were taken over by
       (re)insurance1 sector in 2019 from a               asset managers, while some markets have seen
supervisory perspective, focusing on recent               more insurers owned by private equity funds.
performance and risks. The (re)insurance sector
operates in a challenging global financial setting        Cyber-insurance is a new and rapidly growing
that is highly prone to vulnerabilities. Persistent       line of insurance business. This report illustrates
trade tensions and slower economic growth may             how market participants price this risk in the
lead to the repricing of risks. This in turn may          absence of historical data sets and points to
amplify low-yield vulnerabilities that have built up      the main challenges of managing the risks
over previous years.                                      involved in this type of business. It also covers
                                                          the main regulatory considerations for cyber-
Growth in non-life (re)insurance is mainly                insurance. This report discusses these issues
driven by emerging markets. The market and                in four chapters:
its profitability remained fairly stable in 2018
compared to previous years. Property rates                » Chapter 1 analyses the overall
have increased every quarter since the series               macroeconomic and financial environment.
of natural catastrophes that took place in 2017.
Losses, especially those stemming from natural            » Chapter 2 focuses on global (re)insurance
catastrophes, are at a period low. The expansion            market developments.
of alternative capital slowed down in 2019,
although it retained a high relative share of overall     » Chapter 3 covers the measurement of cyber-
reinsurance capital.                                        risk, the movement out of low interest rates
                                                            and the risk of interest rate spikes, and the
The life insurance industry has operated in a low           current challenges facing the life insurance
interest rate environment for a decade.2 This               industry.
strains profitability, but abrupt rate increases also
pose a risk. Sudden spikes could not only affect          » Chapter 4 summarises the results of the
leverage and liquidity profiles but also lead to policy     IAIS survey of the global reinsurance market,
lapses and surrenders (full policy cancellations).          covering 47 reinsurers in nine jurisdictions in
                                                            North America, Europe and Asia, and links the
The life insurance sector is experiencing several           financial position of reinsurers to the broader
challenges. Sales of guaranteed rate products are           financial economy.
struggling to grow because yields are low. As a
result, in some jurisdictions, unit-linked business is
the main driver of growth in life insurance.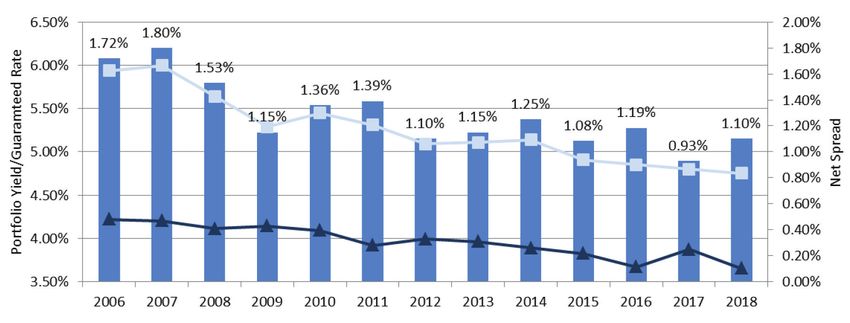
ABOUT THIS
REPORT

             This is the seventh issue of the GIMAR.

    3
             This report assesses developments relevant to the
             (re)insurance industry and identifies key risks and vulnerabilities
             for the industry to promote awareness among IAIS Members,
             stakeholders and interested parties.

             By assessing developments and risks across the whole
             financial system, the GIMAR plays an important role in the
             IAIS macroprudential policy and surveillance framework.
             Importantly, a global macroprudential view complements
             microprudential insurance supervision, which focuses on the
             soundness of individual financial institutions.

             This report was prepared by the IAIS Macroprudential Policy
             and Surveillance Working Group and draws on IAIS data on
             (re)insurers and contributions from several jurisdictions. It is
             not part of the IAIS’ supervisory or supporting material, and is
             not intended to reflect the official views of IAIS Members. The
             report was drafted between August 2019 and January 2020
             and is based on data available during that period.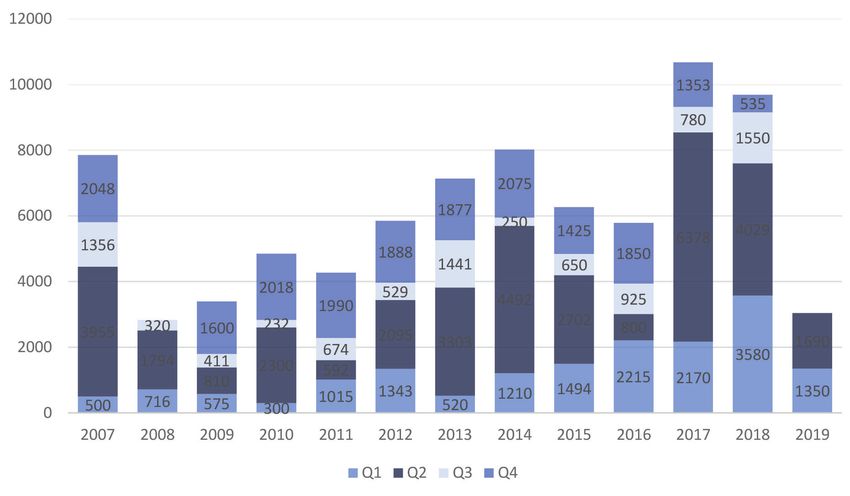
CHAPTER 1
MACROECONOMIC
AND FINANCIAL
ENVIRONMENT
T
he economic growth in markets at the in corporate and domestic long-term spending
beginning of 2018 began to slow down and sluggish global trade.
in the second half of the year, driven by
a decrease in worldwide output. This trend In its July 2019 World Economic Outlook,6 the
continued in the first half of 2019. The Bank IMF observed a softening in the lower-bound
for International Settlements (BIS) reports target of core inflation in the United States (US),
4
shrinking global trade, manufacturing and and inflation well below the lower-bound
investments as the main causes, although target in the euro area and Japan. This is
the negative effects are partially offset by consistent with subdued growth in final
consumption.3 Due to its interconnectedness demand. Market-based inflation expectations,
within the global financial system, China’s measured by 10-year government bond
debt-reduction strategy (deleveraging) is break-even yields, dropped by about 36 basis
also a factor in these trends. points over the past year in the US, to 2.10%
in July 2019. In Germany, they reached a
1.1 INTERNATIONAL ECONOMIC GROWTH 40-month minimum of 0.72% in June 2019,
AND INFLATION while Japan’s rates dropped to 0.16% in
The International Monetary Fund (IMF) October July 2019, compared with 0.53% in July
2019 World Economic Outlook4 forecasts 2018. Comparatively, market-based inflation
global growth of 3% in 2019 and 3.4% in 2020. expectations’ yields in the United Kingdom (UK)
These figures are 0.3 percentage points have risen by 30 basis points over the past 12
and 0.2 percentage points lower, respectively, months, remaining well above 3%.
than the April 2019 forecast,5 based on a drop
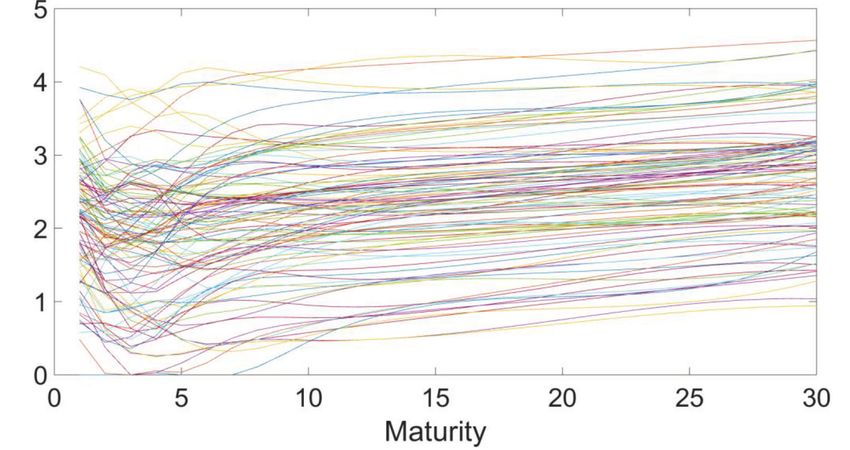
Figure 1.1a: Market-based inflation expectations, break-even rates of 10-year bonds (%, June 2009 – July 20197)
Source: Bloomberg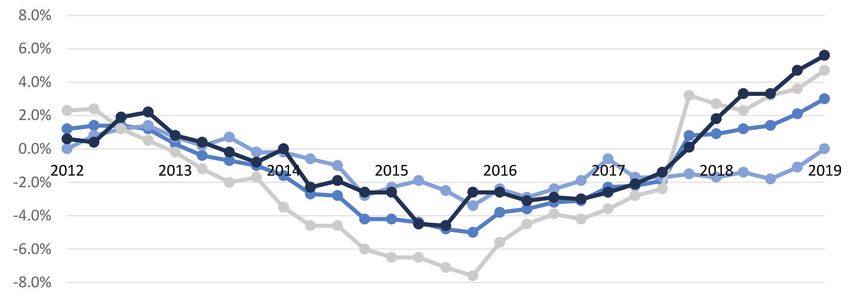
Figure 1.1b: Market-based inflation expectations for selected emerging market economies,
      break-even rates of 10-year bonds (%, February 2014 – July 2019)

      Source: Bloomberg

    In its Annual Economic Report, the BIS explains         2.25% to 2%, as a precautionary measure against
    the low levels of inflation amid rising wages           ongoing global trade tensions, subdued global
    by suggesting that in mature markets, like the          growth and volatility in the euro area.9 In addition,
    US, Japan and Germany, higher wages are                 both the European Central Bank10 and the Bank
    slow to translate into higher price inflation.          of Japan11 announced that they will carry on with
    This may be due to globalisation and the                their expansionary monetary policy through their
    relocation of production to developing                  asset-purchase programmes. Several commercial
    economies, unions’ diminished ability to                banks have started to offer negative interest rates
    capture the benefits of productivity, as well           to their wealthier clients in order to pass on part
    as technological advancements.                          of the low and negative interest rates offered
                                                            by central banks. A “low-for-long” interest rate
    Similar trends can be observed in emerging              environment12 is setting in, with some jurisdictions
    markets with declining inflation expectations           observing negative rates for various maturities.
    over the past year.
                                                            In the 2019 Annual Economic Report, the BIS
    1.2      FINANCIAL MARKETS                              discusses how volatility in financial markets
    Globally, monetary policy has focused on                reappeared towards the end of 2018. The US
    reducing interest rates to address global trade         stock market declined, mainly due to lower
    tensions and declining economic growth.                 growth expectations and earnings uncertainty.
    However, financial markets remain vulnerable to a       Previous expectations of further monetary
    sudden tightening of financial conditions,              policy tightening may have also contributed
    materialising through a sharp repricing of risk,        to these trends.
    escalating trade tensions or ongoing slow growth.
    These triggers could unearth vulnerabilities that       Generally speaking, with notable exceptions that
    built up during the low-yield environment since         can be observed in the figures below, housing
    the 2007–2008 financial crisis.8 In its 2019 Global     prices maintained their upward momentum of
    Financial Stability Report, the IMF estimated           previous years. Trends appear to be fairly stable
    that corporate debt has increased. Notably, the         and are mainly shaped by the downward pressure
    stock of BBB-rated bonds has quadrupled and             created by the further decrease in long-term
    speculative-grade debt has doubled in the US            interest rates. As a result, several supervisors
    and the euro area since the financial crisis. This      and international organisations, such as the
    may lead to credit risk repricing, which in turn will   European Systemic Risk Board (ESRB),13 have
    affect lending and borrowing capacity.                  warned against a potential overheating of certain
                                                            residential real estate markets and the risks of
    On 31 July 2019, the Federal Reserve cut its            high or rising household indebtedness.
    interest rate for the first time since 2008, from
5
Figure 1.2a: Long-term interest rates (%, January 2007 – May 2019)
Source: Organisation for Economic Co-operation and Development (OECD)
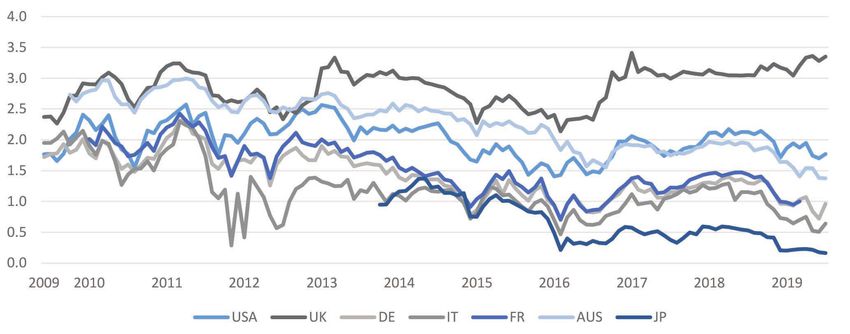
Figure 1.2b: Long-term interest rates – negative territory snapshot (%, January 2015 – May 2019)
Source: OECD
Figure 1.2c: Volatility in the financial markets (July 2007 – July 2019)
Source: Bloomberg
6
Figure 1.2d: Real house price indices in selected advanced economies (Q1 2007 – Q1 2019, Index 2007:
    Q1=100)

    Source: OECD

    Figure 1.2e: Real house price indices in selected emerging economies (Q3 2010 – Q4 2018, Index 2010:
    Q3=100)

    Source: OECD

7
CHAPTER 2
GLOBAL
INSURANCE
MARKET
DEVELOPMENTS
T
he global insurance market operates in The Swiss Re Institute14 forecasts that emerging
the larger macroeconomic environment markets will further consolidate their share of
and is subject to an environment where global direct insurance premiums to 34% by
interest rates remain low over the long term. 2029. In 2018, global direct premiums reached
Such a low-for-long environment may not only their highest level yet at $5,193 billion, or
directly hurt the profitability and solvency of 6.1% of global gross domestic product (GDP).
insurers, but also increase the probability of a Although this is a historical maximum, growth
8
reassessment of risk premia (spreads), resulting has since slowed as a result of a contraction in
in an abrupt spike in interest rates. The interest life markets in China, Europe and Latin America.
rate risk to which an insurer is exposed is linked Technological developments could continue
to its asset-liability mismatch risk, especially in to put downward pressure on pricing and may
companies offering long-term guaranteed rates disrupt markets even further.
on their products. Previous editions of the
GIMAR have highlighted these challenges. In The gross written premiums at year-end 2018
this year’s report, a more detailed analysis of for several selected jurisdictions are set out in
the challenges linked to an environment of Figure 2a. The figure shows life and non-life
suddenly increasing rates can be found in premiums as a proportion of total gross written
Chapter 3. premiums. The life sector is dominant in many
jurisdictions, while in Switzerland, for example,
the non-life insurance industry drives the market.
Figure 2a: Selected jurisdictions’ gross written premiums (USD billion, year-end 2018)
Sources: NBB, FINMA, BaFin, ACPR, IVASS, FSA, FSS, Bank of Russia, PRA, NAICFigure 2.1a: Global insurance market renewal rates (Q1 2012 – Q1 2019)
Source: Marsh: “Global Insurance Market Index – First Quarter 2019”
Figure 2.1b: Non-life profitability of selected jurisdictions – combined ratio
Sources: NBB, FINMA, BaFin, ACPR, IVASS, FSA, FSS, Bank of Russia, PRA, NAIC
2.1 NON-LIFE INSURANCE rates, with a 3% average rise in the first quarter
The non-life insurance market is expected to of 2019. This trend has been mainly supported
grow by 3% each year between 2018 and by developments in property insurance and
2020, driven by a growth rate of 8% in emerging directors’ and officers’ liability insurance. Prices
markets and 2% in advanced economies.15 in the non-life insurance market fluctuated within
a narrow range. Property rates have consistently
In its Global Insurance Market Index: First increased in all regions since the fourth
Quarter 2019 outlook, Marsh reports a sixth quarter of 2017, following the extreme natural
consecutive quarter of increasing commercial catastrophes that occurred that year.
9In its sigma research publication (no. 3/2019), the life insurance premiums in emerging markets are
Swiss Re Institute discusses the events of 2018, expected to increase by 9% in 2019–20, with
in which half of total economic losses from natural those in advanced economies remaining stable.
and man-made disasters were insured ($81 billion
out of $161 billion). The most severe event was the Given the low interest rate environment, the
California Camp Fire, which made 2018 the year life insurance market will struggle to retain
with the fourth highest one-year aggregate industry profitability. Traditional life products with fixed
payout (above the $71 billion 10-year average). guaranteed rates may remain unattractive
and policyholders may direct their savings to
The non-life market remains soft, although it other markets and risk profiles, even though
is showing weak signs of recovery. This puts the opposite trend is being observed in some
further downward pressure on its profitability, with jurisdictions, such as Italy and France.
returns barely covering the cost of capital. Natural
catastrophes made 2017 and 2018 the highest Life insurers may respond to these challenges by
consecutive two-year period of insured losses innovating under the current regulatory regime
($219 billion) in recorded history.16 Increasing or offering products with lower or no guaranteed
climate risks have led insurers and supervisors benefits at all. As discussed in Chapter 1 and in
to develop tools to understand the natural the 2018 GIMAR, life insurers will need to prepare
catastrophe protection gap. Disasters driven by to operate in a low-for-long environment and
rising temperatures have a considerable impact protect themselves against interest rate spikes
on the global economy, with less developed that could lead to lapses and surrenders. Given
regions being the most vulnerable.17 the current macroeconomic environment, a shift
towards riskier investments, such as equities, real
The combined ratio18 for selected jurisdictions estate and collateralised assets, may need to be
between 2016 and 2018 can be seen below. monitoried by insurance supervisors.
2.2 LIFE INSURANCE Supervisors track the difference between net
The Swiss Re Institute’s Global Economic and investment yields and guaranteed crediting
Insurance Outlook 2020 calculates a 1.6% rates for the life industry. In the US, the margin
increase in real terms in the global life insurance widened last year, with the overall net spread
market throughout 2018. This growth is slightly (the difference between the portfolio rate and the
lower than in previous periods, mainly as a result guaranteed rate) increasing from 93 basis points
of a life premiums contraction in China. However, in 2017 to 110 basis points in 2018.
Figure 2.2a: US life insurance market net spreads19 (2006–2018)
Source: NAIC
10Data from selected European jurisdictions show As Figure 2.2b shows, German life insurers’
that interest rate margins remain low, with net profits and losses are split into components:
spreads in 2018 of 41 basis points in Belgium, 76 capital/interest rate gains, risk/mortality gains
basis points in Switzerland, 121 basis points in and other profits. As the method to derive the
Italy and 223 basis points in France. A full analysis Zinszusatzreserve (ZZR) has changed slightly, the
of underwriting profits would also need to take into expenses to build up the ZZR reduced in 2018.20
account the undertakings’ reserve levels. As a result, the profits from capital gains increased.
Figure 2.2b: Profits and losses in the German life insurance market (EUR million, 2010–2018)
Source: BaFin
2.3 REINSURANCE21 2018 figure (16.6%). The growth of alternative
The global reinsurance market remains well reinsurance capital in recent years is partly
capitalised. Losses incurred have not increased explained by investors searching for higher yields
rates significantly. Reinsurers are still operating in in the capital markets.
a soft market, with ongoing consolidation (albeit
at a smaller scale than in the past). These and In its sigma no. 3/2019 report, the Swiss Re
other findings are discussed further in the IAIS Institute estimates that primary insurers ceded
Global Reinsurance Market Survey presented in $260 billion in 2018.23 This represents 5% of
Chapter 4 of this report. all direct premiums written. Catastrophe bonds
and insurance-linked securities issuances have
As observed in Figure 2.3a, global reinsurance remained strong at $3.3 billion in the fourth
capital recovered in the first three quarters of quarter of 2019 – $1.1 billion above the 10-year
2019, mainly driven by an increase in traditional average for the quarter and $1.4 billion above the
capital. This trend was supported by the level observed during the same quarter of 2018.24
lower levels of natural catastrophe losses and
an upswing in capital markets.22 The proportion At the end of 2019, property catastrophe bond
of alternative capital reached 14.9% of total issuance dropped by $2.7 billion below the
reinsurance capital in the first three quarters of level reached in 2018. However, the total limit
2019, slightly above the percentage attained outstanding reached an all-time high of
for the whole of 2017 (14.7%) but below the $41 billion. This trend could be the result of
11Figure 2.3a: Global reinsurance capital (USD billion, 2006 – Q3 2019)
Source: AON Benfield Reinsurance Market Outlook, January 2020
Figure 2.3b: Property catastrophe bond issuance (USD million, 2007 – Q2 2019)
Source: AON Benfield Reinsurance Market Outlook, September 2019
trapped capital – where collateral is temporarily while the ability to release reserves decreased in
“trapped” to act as a buffer against losses. line with lower solvency positions. Taking these
Renewals during 2018 and the beginning of 2019 developments into consideration, the European
have seen moderate rate increases, particularly in Insurance and Occupational Pensions Authority
regions and lines of business affected by natural (EIOPA) emphasises the need for risk-adequate
catastrophes. Competitive pressures are still high, prices for reinsurers.25
12CHAPTER 3
SPECIAL
TOPICS
13 3.1 CYBER-UNDERWRITING: » Cyber-insurance is an insurance product
REGULATORY CONSIDERATIONS primarily created to transfer risk, but has
3.1.1 Introduction evolved into a product that also helps
This section provides an overview of the policyholders reduce the impact of their
cyber-insurance market and the main risk cyber-risk.
management and regulatory considerations.
It concludes with a discussion on market Types of cyber-insurance products
access and potential barriers to entry. Because cyber-insurance is a relatively new
risk, coverage may be provided in one of two
3.1.2 Market Overview ways: affirmative cyber-insurance or non-
Defining key cyber-related terms affirmative (or “silent”) cyber-insurance.
Cyber-attacks can affect the company itself, Affirmative cyber-insurance is a product that
infrastructure providers (such as cloud services explicitly covers cyber-risks. Coverage is
and payment systems) and individuals whose contained within a standalone insurance policy
data, identities and privacy may be exposed in (covering only cyber-risk) or offered as a
a data breach.26 package (covering both cyber-risk and other
types of property and casualty coverage).
The Financial Stability Board’s Cyber Lexicon, Some insurers also offer cyber-related
published in November 2018, provides the ancillary services (for example, assessing
following definitions: risk management and security practices, and
recommending prevention programmes) in
» Cyber-risk is the combination of the combination with cyber-products, which are
probability of cyber-incidents occurring tailored to the buyer’s needs.
and their impact.
» A cyber-incident is a cyber event that: In contrast, non-affirmative cyber-insurance
1) jeopardises the cyber-security of an refers to products in which cyber-risk is
information system or the information assumed to be covered because the policy
the system processes, stores or transmits; does not include an explicit exclusion for
or 2) violates security policies, security cyber-risk. Although including cyber-risk in
procedures or acceptable use policies, these policies may be intentional, it may also
whether as a result of malicious activity be a form of “unintended insurance”, referring
or not. to an unknown or unquantified cyber-risk
» Cyber-resilience refers to an organisation’s exposure that may trigger other traditional
ability to continue to carry out its work property and casualty insurance events.
by anticipating and adapting to cyber-
threats and other relevant changes in
the environment, and by withstanding,
containing and rapidly recovering from
cyber-incidents.
13Market size and growth outlooks Future market growth is expected to be largely
According to AON, global cyber-insurance propelled by technological innovation, which
premiums have grown steadily, with an annual will amplify customers’ vulnerabilities and is likely
growth rate of about 15% since 2009. If growth to increase the frequency, magnitude and
continues at this pace, the cyber-insurance volatility of cyber-attacks.
market may be worth $7 billion by 2022.
Digital transformation and technological progress
Figure 3.1a confirms that the US continues are creating a more competitive environment,
to make up the majority of the global cyber- producing business opportunities for new
insurance market, but other markets started entrants and incumbents seeking to enter the
to develop rapidly from 2015.27 Despite steady cyber-insurance marketplace. Customers will
growth, the global cyber-insurance market benefit from the bundling of products, such as
remains relatively small, making up less than 1% insurance sold with information technology (IT)
of the total insurance market. The projections for mitigation and recovery services. Insurers can
growth shown in Figure 3.1a are driven by two take advantage of this undeveloped market, given
assumptions: 1) current silent cyber-insurance its high capacity and the potential for increased
policies will not translate into affirmative cyber- take-up rates. They can adjust their overall
products; and 2) the frequency and magnitude of market strategies and operations, enter into
cyber-events will not grow drastically in future. If partnerships, and/or offer new products, which
either of these assumptions is incorrect, the cyber- in turn could lead to high insurer growth rates
insurance market may exceed projected levels. and profits.30
Given that the cyber-insurance market is relatively Insurance technology (InsurTech) startups and
young, detailed information about markets other partnerships may provide an opportunity
other than the US is not yet publicly available. to encourage market participation. InsurTech
The penetration rate varies across countries,28 could facilitate the development of new products
amounting to about 30% in advanced economies, or offer innovative methods of assessing IT
which is low compared to other lines of risks. Startups and partnerships could also
insurance.29 The IAIS Global Monitoring Exercise, provide other valuable services such as access
starting in 2020, may provide more detailed to a large database of information or customer
information on the cyber-insurance market. support in risk mitigation and incident response
(whether from a technical or legal perspective).
Figure 3.1a: Global cyber-insurance premiums and future estimates (USD million, 2009–2022)
8000
7000
6000
5000
Millions
400 0
3000
2000
1000
0
2009 2010 2011 2012 2013 2014E 2015E 2016E 2017E 2018E 2019E 2020E 2021E 2022E
Rest of the world Europe US
Source: Aon Cyber Insurance Market Insights – Q3 2018
14This type of business collaboration is already of variables that occur in a highly connected
happening in other markets and incentivises digital environment.
further developments in the insurance market. As
these opportunities develop, insurers will need to As the industry continues to develop advanced
assess the potential value of new partnerships, modelling techniques to account for these
while supervisors will need to assess their role in factors, deterministic scenario-based methods
supervising the activities of these business have provided a working solution in the interim.
partners. The hope is that new players in the Some modelling vendors are developing
market may improve efficiency and create dedicated cyber-risk models, with several creating
innovative solutions that meet insurers’ specific predictive models that seek to specifically quantify
business needs and expectations. non-affirmative risk. All cyber-models must be
continuously developed on an iterative basis in
3.1.3 Risk Management and Regulatory response to the dynamic nature of cyber-risk.
Considerations
Cyber-risk measurement Insurers and modellers can examine previous
At a basic level, measuring cyber-risk uses the cyber-events (and near misses) using
same methodology as other risks: an underwriter counterfactual analysis to identify potential worst-
must project the likelihood of covered incidents case scenarios and calculate maximum
at different levels of severity. Insurers may use a probable exposure levels. Insurers, particularly
variety of data sources, including: new entrants to the cyber-insurance market,
also rely on knowledge gained from modelling
» Insurer experience data and underwriting in established categories,
» Counterfactual risk assessment particularly in complex and specialty risk classes,
» Third-party cyber-risk models such as pandemics and terrorism. These risk
» Worst-case scenario analysis classes influence the development of algorithms,
» Compliance with cyber-security standards. and underwriters can draw on policy language
used for these complex risks to limit their
Four main approaches have been used in the potential exposure in the event of a claim.
past,31 but an overall lack of harmonisation
creates wide variations in Other insurers rely on external
pricing and product offerings. services (outsourcing),
Insurers may quote differently QUESTIONS integrating the information they
for the same type of risk, REMAIN ABOUT receive with their experience
depending on what they define
as a cyber-risk, cyber-incident
THE RELIABILITY and public data, or they develop
premiums by replicating –
or cyber-attack, and this OF TRADITIONAL with some adjustments – the
determination will be based CYBER-MODELS rates applied by their main
on a variety of available data AS VERY FEW competitors. In this scenario,
sets and other underlying
information used to price the
INSURERS HAVE where data and modelling are
scarce, the risk of mispricing
risk coverage. THE CAPABILITY and over/under-reserving is high,
TO ACCURATELY especially when comparing rates
Questions remain about
the reliability of traditional
MEASURE applied to products with different
characteristics (type and scope
cyber-models as very few CYBER-RISK. of coverage, risk included/
insurers have the capability excluded) and a low degree of
to accurately measure cyber- standardisation.
risk. The Geneva Association has noted that
property catastrophe modelling took between Given the limitations of current models, some
25 and 30 years to mature,32 and that modelling insurers rely on other methods to measure
was based on a risk that had a clear geographic cyber-risk. Primarily, pricing reflects a qualitative
footprint and extensive experience data. In assessment of the insured’s security environment.
addition, accurately measuring cyber-risks This level of assessment will depend on the
involves several challenges: given that this risk amount of protection being sought under a
has only recently developed, experience data is policy. A lower level of coverage may rely on the
limited; the occurrence of an event relies on the use of checklists and assessing the presence of
unpredictability of human nature; and the severity standard security protocols. Large clients posing
of the loss depends on a nearly endless number a high level of risk are generally subject to highly
15individualised and detailed IT security audits. Insurance supervisors can assist with monitoring
These underwriting processes also help identify overall cyber-risk aggregation within the
areas of vulnerability and provide an opportunity industry by collecting data. In the US, the National
for the insured to improve their resilience and Association of Insurance Commissioners
reduce the overall level of risk. (NAIC) requires insurers to include a cyber-
supplement in their annual data reporting.
A qualitative assessment also supports the
insurer’s ability to form a comprehensive Supervisors can also help mitigate systemic risk
understanding of its client base’s overall security by facilitating the sharing of information
defences, and improves its ability to differentiate related to cyber-risk, and encouraging insurers to
risks and refine pricing among policyholders. This share information with each other. Not only
leads to the development of certain standardised does this increase resilience levels of similarly
data protocols used to measure cyber-risk in an situated policyholders, but the collected
insurer’s portfolio. Similarly, supervisors can also information could contribute to the ability of the
play a role in reviewing an insurer’s practices to insurance industry to accurately assess
ensure appropriate risk management. As part of aggregate risk levels and predict how risk may
this effort, insurers and supervisors can review evolve in future. Although an insurance-centric
external standards and incorporate them into repository is ideal, current information-sharing
their own risk assessment processes. repositories include:
Insurers may also attempt to measure risk » inancial Services Information Sharing
F
by analysing scenarios or using other risk and Analysis Center (FS-ISAC):
assessment tools.33 www.fsisac.com
National Institute of Standards and
»
Data availability Technology’s National Vulnerability Database
The market suffers from a lack of experience (US): nvd.nist.gov
data, which makes underwriting cyber-risk Department of Homeland Security’s
»
difficult. Although more data are becoming Cyber Information Sharing and
available, most cyber-incidents are underreported Collaboration Program (US): www.dhs.
by companies, whether due to fear of reprisal or gov/cisa/cyber-information-sharing-and-
concerns about reputational damage. In addition, collaborationprogram-ciscp
cyber-risk experience data can quickly become FBI’s Infraguard (US):
»
dated and lose value as attackers rapidly adapt www.infragard.org
to exploit new vulnerabilities and evade cyber- Malware Information Sharing Platform’s
»
security measures. Threat Intelligence Platform:
www.misp-project.org
Only a few big players with extensive experience
in the cyber-market can generate their own Closer analysis of the governance and security
mass of data, and they are reluctant to share that issues that are preventing the creation of an
experience with other companies to ensure they incident data repository is needed,36 but for now
remain competitive and gain an advantage in supervisors can continue to share general
underwriting.34 This data paucity may weaken the best practices and experiences with each other
insurer’s confidence in pricing and underwriting in order to improve the industry’s ability to
cyber-insurance. At the same time, buyers may measure and mitigate cyber-risk. Supervisors
question the appropriateness of the premium and will also need to build a level of trust and ensure
coverage offered. These factors depress sales ongoing communication with insurers to ensure
and reduce the penetration rate.35 that they can freely share information (with both
supervisors and each other) without concerns
Although current measurement methods attempt about competition or fear of reprisal.
to access a broad range of information, insurers
still need a centralised source of information/ The Operational Riskdata eXchange Association
data repository about cyber-events. Consensus is an example of a successful industry-led data-
is building that the evolving nature of cyber-risk, sharing mechanism outside of cyber-risk. The
combined with the cross-border and cross- association was set up to “provide a platform for
industry economic implications of a cyber-attack, the secure and anonymised exchange of high-
demand an increased level of coordination – both quality operational risk loss data from around the
within the insurance industry and beyond. world”.37 Banks and insurers provide anonymised
data on operational risk losses in return for access
16to the data set. This creates a growing pool of exercise was that insurers’ non-affirmative cyber-
data that can be used to improve the industry’s exposure was five times more than their affirmative
understanding of operational risk. A similar exposure. Moving forward, insurers with exposures
mechanism for cyber-risk could also be effective. to non-affirmative cyber-coverage intend to include
appropriate exclusion clauses in their contracts.41
To encourage the development of an insurance-
centric repository, supervisors could standardise Potential mitigants to non-affirmative exposure
the amount and type of data needed on each include writing explicit cyber-exclusions,
cyber-incident. This would make it easier for increasing premiums to reflect the increased risk,
insurers to share information. and attaching specific limits to coverage. Many
insurers are starting to carefully review policy
Non-affirmative cover and risk accumulation language to minimise their potential exposure
Supervisors and the industry have expressed to unintentional cyber-coverage, which has
concern about non-affirmative cyber-risks. The lowered the perceived level of non-affirmative risk
Bank of England’s Prudential Regulation Authority by insurers. Although this action occurs after a
(PRA) survey on cyber-underwriting found that, policy has been written, it is one way in which
for non-affirmative risks, most firms reported insurers have been developing their capabilities to
considerable exposure on measure cyber-risk and ensure
many traditional lines of
business, including casualty,
IN 2018, THE healthy loss ratios.
financial, motor, and accident EIOPA ASKED 11 In some jurisdictions, regulators
and health. The survey INSURERS IF IT have issued guidance on non-
found that firms did not have WAS POSSIBLE affirmative risk. In a supervisory
well-developed quantitative
assessment frameworks for
TO QUANTIFY statement in July 2017, the
PRA advised that it expected
non-affirmative exposure NON-AFFIRMATIVE insurers to be able to “identify,
and that the assessments EXPOSURE. quantify and manage” both
generally involved stress tests
and expert elicitation.38
NINE DESCRIBED affirmative and non-affirmative
cyber-exposure.42
IT AS “VERY
In 2018, the EIOPA asked DIFFICULT” AND Non-affirmative cyber-risks can
11 insurers if it was possible THE OTHER TWO quickly accumulate. A cyber-
to quantify non-affirmative
exposure. Nine described
AS “NEARLY incident may affect multiple
businesses at the same time
it as “very difficult” and IMPOSSIBLE”. due to shared connections
the other two as “nearly (such as payment systems,
impossible”.39 In a later survey, only five insurance operating systems, internet providers and cloud
groups out of the 26 that responded to the services). A cyber-incident that takes advantage
question reported that they had cyber-exclusions of the interdependency of businesses and
on property and casualty policies.40 Some of infrastructure may even compromise the supply
those that did not provide exclusions said that it chain, resulting in extensive economic losses and
was due to the difficulty of relating the risk – for large-scale disruptions. Although no such attack
example, personal injury – to a cyber-incident. has occurred to date, a large-scale cyber-attack
Other respondents did not see cyber-risk as a that exploits a mass vulnerability or cloud service
current threat. provider could result in catastrophe-level losses
– an extreme act of cyber-terrorism affecting
The Monetary Authority of Singapore, in infrastructure could result in up to $1 trillion in
collaboration with the IMF, conducted a stress economic losses.43 Concerns about this type
test on cyber-risk as part of the 2019 financial of event have led the industry to take a fairly
sector-wide stress test exercise and the IMF’s conservative approach to underwriting cyber-
Financial Sector Assessment Program. Direct risk, even though the line of business has been
insurers were asked to measure their exposures largely profitable to date. Until a large-scale event
to cyber-risk as a result of the affirmative and happens, it will be difficult to predict the impact it
non-affirmative coverage that they had written. would have on the insurance industry.
The insurers expected claims from affirmative and
non-affirmative cyber-coverage to be manageable, Concerns about the aggregate level of risk
mainly due to the reinsurance arrangements in have led to discussions about ways to properly
place. However, one key observation from the address potential accumulation risk.
17Currently, companies use models and stress insurers’ exposure and losses. In Europe, quota
testing scenarios to identify and quantify share treaty contracts45 appear to be the most
accumulation risk. This risk is then transferred to common type of contract used, followed by
reinsurers and risk-sharing pools as part of an proportional facultative reinsurance.46, 47
insurer’s overall risk management strategy.
Cyber-risk can also be transferred to the capital
3.1.4 Market Access and Potential Barriers markets using alternative risk-transfer instruments,
to Entry although using insurance-linked securities such
Insurers are struggling to grow in a slow- as catastrophe bonds, sidecars and industry-loss
recovering economy, and cyber-insurance warranties can be challenging. For example, while
presents an opportunity to gain market share. insurance-linked security vehicles are primarily
But new entrants face several challenges, issued to cover catastrophe risks (and, to a lesser
including limited historical data, evolving extent, products in other business lines), issuing
methods of measuring cyber-risk and a high such an instrument to cover cyber-losses is difficult
degree of uncertainty about the level of risk. This due to a lack of data and modelling capabilities.
section focuses on the additional drivers that Using insurance-linked securities for cyber-risks
insurers must consider when deciding whether may also be less appealing to capital market
to enter the cyber-insurance marketplace. It investors due to the unpredictability of cyber-risk
also discusses current government initiatives and the potential correlated impact on bonds
supporting the market’s growth. and equity. However, a pooling mechanism could
potentially facilitate the issuing of insurance-linked
Development of cyber-expertise securities for cyber-risk, supported by regulatory
A key priority for insurers exploring the cyber- measures or tax incentives to encourage risk
insurance market is to ensure they have sufficient transfer to capital markets.48
technical expertise to understand the risks
associated with this type of underwriting and to Some jurisdictions use consortiums or risk-pooling
support new cyber-related business projects. mechanisms to manage insurer cyber-risk. Risk-
Access to skilled experts is important for the pooling mechanisms are instruments that can:
success of market participants, but uncertainty » Carry a higher level of risk through
around market development makes it difficult to diversification, which reduces overall
find people with the skills needed to understand uncertainty and leads to lower coverage
the nature of cyber-risk, design contracts, prices.
underwrite and price risk, and manage an » Facilitate the participation of smaller insurers
insurer’s risk portfolio. This shortage of skilled by providing access to others’ experience and
experts is being addressed through training limiting risk exposure.
programmes and recruitment campaigns to hire » Standardise products among pool members
experienced individuals. Insurers may also rely on (who are likely covering similar risks).
external expertise, as noted by respondents to a » Allow insurers to share claims experience
PRA survey. and reduce the data gap for underwriting and
modelling cyber-risk.
Methods of risk transfer and pooling for » Allow the industry to cover cyber-events that
insurer consideration would otherwise be uninsurable and permit
In the absence of actuarial/historical underwriting further risk mitigation through the use of
data and given the difficulty in accurately reinsurers and capital markets.
measuring risks, many insurers rely on
mechanisms to transfer their own risk.44 3.1.5 Conclusions
Non-affirmative cyber-risk remains prominent
Reinsurance in the cyber-market is expected to and a lack of standardisation in policy language
grow at a fast pace. Insurers have a strong has exacerbated this issue, resulting in many
preference to work with reinsurers because they insurers being uncertain about their overall levels
can provide broader data sets of information, give of exposure. Cyber-risk models are relatively
comprehensive underwriting information to support immature due to the lack of underwriting
their premium pricing process, and quantify cyber- experience and availability of data, paired with a
risks. Reinsurers have access to information on volatile and fast-evolving risk. Insurers therefore
threats and vulnerabilities and, as such, could help rely on other methods of risk measurement,
reduce the gap in data availability for underwriting including individualised risk assessments, which
and modelling cyber-risk. Reinsurers are currently provide policyholders with a map of risk mitigation
the main method of transferring risk to reduce guidelines but make it difficult for insurers to
18engage in comparative pricing and assess their According to data from the Federal Reserve Bank
overall risk portfolio. Information sharing is critical of Chicago,49 US life insurers invested $5.4 trillion
but underused. The use of reinsurance and other in total in 2013, while US non-life insurers50
risk-pooling mechanisms can help promote the invested $1.7 trillion in 2018. Respectively, about
flow of information while offering insurers the 75.5% and 57.9% of US life and non-life insurers’
benefits of risk transfer. investment portfolios comprise bonds. Similarly,
insurers in the European Union (EU) invested 51%
Although many public and private initiatives (not taking into account unit-linked investments) of
and studies have collected information on their total assets of €11.3 trillion in bonds and an
previous cyber-incidents, coordinated actions additional 5% in loans and mortgages.51 The value
by supervisors will play a key role in streamlining of these bonds is directly affected by interest rate
the variety of data sources available to measure changes, exposing insurers to risk. Insurers are
cyber-risk, encouraging the standardisation of also exposed to interest rate risk through liabilities
data collection while maintaining the benefits of when there is a mismatch between the cash flows
competition, and fostering information sharing of assets and liabilities.
to improve insurer underwriting and encourage
market growth. If interest rates move, insurers are affected in the
following ways:
Insurers may not be fully aware of their overall
risk exposure, which affects their ability to Portfolio revaluation effects. As interest
»
accurately calculate premiums, set appropriate rates change, the market value of assets and
limits and adopt appropriate pricing strategies. liabilities that are sensitive to the interest
Given the evolving nature of the cyber-landscape, rate also changes. Longer-term bonds and
companies should demonstrate a continued liabilities are affected more than shorter-term
commitment to developing their knowledge items because they are more sensitive to
of cyber-insurance underwriting risk. Supervisors rate changes.
need to share information and best practices Reinvestment effect. Insurers also rely on
»
to enhance their own ability to evaluate the bond interest payments to match liabilities’
pricing and exposure of insurers within their cash flows. When interest rates rise, buying
jurisdictions. They also need to consider how bonds with large enough coupon payments
they can support an integrated approach to to match liabilities’ cash flows is easier.
cyber-risks that will adequately reflect the risk in However, the opposite is true when interest
insurers’ strategy and risk appetite. Initiatives are rates go down.
under way in several countries to foster greater Lapse rates. Moving interest rates (and
»
risk awareness and to push insurers to adopt related commercial incentives) may influence
conscious risk management and supervision, policyholder behaviour. Rising interest rates
but additional efforts are required by both may increase the appetite of policyholders to
supervisors and insurers. lapse and seek other investment alternatives,
while decreasing interest rates may induce
3.2 THE RISKS OF INTEREST RATE policyholders to stay in contracts with high
SPIKES WHEN MOVING OUT OF A guaranteed interest rates longer than expected.
LOW INTEREST RATE ENVIRONMENT
3.2.1 Introduction: The Different Aspects of Life and non-life insurers often have a different
Interest Rate Risk for an Insurer sensitivity to interest rate movements. Life insurers
There is a time gap between insurers receiving offer long-term products such as whole life
premiums and making payments if a claim arises. insurance with and without a savings component.
During this gap, premiums are invested in financial To match these products’ liability cash flows, life
assets. Ideally, the cash flows of these financial insurers try to buy long-term assets with similar
assets closely match the cash flows of liabilities cash flows. The better the insurer can match asset
but, in practice, these cash flows don’t match and liability cash flows, the less pronounced its
perfectly for various reasons. One reason is that sensitivity to interest rate movements will be. But
finding assets with a maturity and cash flow profile finding the right match is not always possible.
similar to the liabilities is challenging. It is also Non-life insurers invest in bonds and other assets
possible that insurers prefer to take on more risk that are sensitive to interest rates, but are affected
in order to increase their expected returns. As a to a lesser extent than life insurers. Property
result, insurers actively participate in capital and insurers, for example, tend to have short duration
money markets. liabilities and therefore require shorter-term bonds
to match their liabilities. As it is often easier for
19non-life insurers to find these shorter duration Under US accounting principles, mark-to-market
bonds, their sensitivity to interest rate changes is assets can be revaluated based on changes in
less pronounced. interest rates, with liabilities exhibiting less volatility
due to little revaluation.
Whether or not this interest rate sensitivity is
translated to the balance sheet of the insurer Spread movements also affect insurers’ balance
depends on the valuation system applied. For sheets under a full mark-to-market regime.
example, in its most basic form, a life insurance While such movements directly affect spread-
reserve reflects the changes in the company’s net sensitive assets, the degree to which they affect
asset value, based on actuarial assumptions about liabilities depends on the valuation approach used
interest rates, mortality, lapses and so on. In mark- (particularly the discounting features).
to-market regimes, such as Solvency II, the market
prevailing risk-free rates are used to calculate the Solvency II has long-term guarantee measures,
best estimate of liabilities/reserves (the actuarial which partly transfer the spread movements of
present value of claims and expenses minus the assets to liabilities by adding part52 of the spread
actuarial present value of premiums, gross of to the risk-free discounting rate. This portion
expenses). As risk-free interest rates change in often represents the part of the spread that is not
the market, the valuation of life insurance reserves related to credit fundamentals.
under such a regime changes as well (see Box 1).
There is no agreement among economists about
Not all regulatory systems are fully mark-to- the extent to which the risk-free rate should be
market. Under US Generally Accepted Accounting adjusted for spread changes.
Principles, for example, reserves are valuated using
the prevailing economic assumptions at the date Certain types of life insurance are not sensitive to
when the insurance contract was written. Insurers interest rate movements. Unit-linked insurance often
make an allowance for a deficiency reserve, but in transfers investment risk to the policyholder, while
general interest rate volatility is not fully apparent the insurer bears some residual risk (for example, if
in the valuation of the liabilities in such a regime. there is rider coverage).
20Although insurers are not liable to compensate movements, non-life insurers’ profitability also
investment losses for these types of insurance, depends on their investment income.
changing interest rates can affect the desirability
of these products. If interest rates are low, The extent to which investment income is
exposure to higher risk may be desirable and required to meet profitability goals depends on
unit-linked products may be more appealing53 the ability of non-life insurers to achieve sound
than traditional products. technical underwriting – the better they manage
to write premiums that cover their claim payments
The interest rate environment also determines the and expenses, the less non-life insurers depend
profitability of all types of insurers. For example, on their investment income to be profitable.
although they are less sensitive to interest rate
Figure 3.2a: Underwriting profit – life sector (USD billion, 2018)54
Source: Bloomberg
Figure 3.2b: Underwriting profit – non-life sector (USD billion, 2018)
Source: Bloomberg
21However, in a highly competitive underwriting 3.2.2 Moving Out of a Low Interest Rate
environment, downward pressure on insurance Environment
premiums may decrease underwriting gains and, The impact of a low interest rate
as a result, increase non-life insurers’ reliance on environment on the insurance sector
investment income. If life insurer products have a As highlighted in Chapter 1 (see Figure 1.2a),
guaranteed savings component (such as universal several developed economies are still experiencing
life or variable annuities with guaranteed rates), low nominal and real interest rates. When the
their profitability is also strongly affected by the financial crisis hit in 2007, policymakers around
prevailing interest rates. the world responded by easing monetary
conditions. As a result, interest rates fell
By guaranteeing a return, insurers assume the precipitously. When the recession hit, the Federal
obligation to cover the difference between the Reserve moved swiftly to cut rates, which
investments’ return and the guaranteed return, eventually reached close to zero. After 2016, rates
even if the investment return is lower than the slowly climbed, but events in 2019 have prompted
guaranteed rate. The relation between investment the Federal Reserve to start cutting rates again
income and profitability of different types of for the first time since 2008. An analysis of data
insurers is further discussed below. spanning July 1954 to June 2019 shows that the
federal funds rate has experienced an average of
Figure 3.2a shows the life underwriting profit of 4.8% and a maximum of 19.1%, demonstrating
50 large life insurers, covering broad geographic how recent rates are far below historical
regions such as Asia, Europe and North America. averages. Since 2011, the European Central
The sample for 2018 indicates that the median Bank has gradually lowered its policy rates. The
underwriting loss was $1.24 billion, with the marginal lending facility rate and main refinancing
lowest 10th percentile losing $8.13 billion. operations rate have been as low as 0.25%
At the same time, the 90th percentile’s and 0% respectively since 2016. The deposit
underwriting profit reached $10.54 billion due facility rate turned negative – as low as -0.50%
to an extraordinary year for one life insurer. In since 18 September 2019. Based on these
previous years, the 90th percentile underwriting recent developments, it is becoming evident that
profit was negative. Figure 3.2b shows the developed economies are increasingly considered
underwriting profit of 50 large non-life insurers,55 to be in a protracted low, and sometimes even
covering the same broad geographic regions. negative, interest rate environment.
The graph illustrates how non-life insurers have,
on average, profitable underwriting activities. For several of the economies confronted with low
For 2018, the median non-life underwriting interest rates, there is a debate about whether
profit was $0.31 billion, while the 10th percentile this low-yield environment is a temporary
underwriting loss was $0.13 billion and the 90th phenomenon, or whether it will remain over the
percentile underwriting profit was $2.16 billion. longer term. These two opposing views were
discussed by the ESRB in its report56 on low
The figures above illustrate that, while many life interest rates. Each argument is based on
insurers rely on investment income to achieve different views on the main drivers of interest rate
positive profits, most non-life insurers are evolutions in recent decades. One view attributes
profitable without accounting for investment the current environment to cyclical (“financial
income. As such, the profitability of life insurers cycle”) factors; the other relates it to structural
is more vulnerable to interest rate risk. In some (“secular stagnation”) factors.
instances, composite insurers can cross-fund
their activities by having life segments at an The “financial cycle” view highlights how different
underwriting loss and non-life segments at an factors drove interest rates down in recent years.
underwriting profit. These low rates could be here for a long time, but
are not necessarily expected to stay permanently
The next part of this special topic discusses and should recover. It is argued that, following
the macroeconomic aspects and impact of the the excessive debt that economic agents
current low-yield environment on insurers, before accumulated in the period leading up to the global
listing the possible implications of a scenario financial crisis, the need to deleverage contributed
where interest rates revert to higher levels. This to lower investment and interest rates. In addition,
section relies on existing studies and impact nominal interest rates fell in response to the
analyses performed by supervisory authorities recession and the accompanying monetary policy
and central banks. responses by major central banks.
22You can also read


