The state of social insurance for agricultural workers in the Near East and North Africa and challenges for expansion
←
→
Page content transcription
If your browser does not render page correctly, please read the page content below
WORKING
                                    PA P E R
                                     working paper number 189
                                     march, 2021
                                     ISSN 1812-108X

                                     Published by the Food and Agriculture Organization of the United Nations and the
                                     International Policy Centre for Inclusive Growth of the United Nations Development Programme

The state of social insurance for agricultural
workers in the Near East and North Africa
and challenges for expansion
Lucas Sato, International Policy Centre for Inclusive Growth (IPC-IG)
International Policy Centre for Inclusive Growth (IPC-IG) Working Paper No. 189 The state of social insurance for agricultural workers in the Near East and North Africa and challenges for expansion By Lucas Sato Published by the Food and Agriculture Organization of the United Nations and the United Nations Development Programme. All rights reserved. Developed in Brazil by the International Policy Centre for Inclusive Growth (IPC-IG). The International Policy Centre for Inclusive Growth is jointly supported by the United Nations Development Programme and the Government of Brazil. International Policy Centre for Inclusive Growth (IPC-IG) SBS, Quadra 1, Bloco J, Ed. BNDES, 13º andar 70076-900 Brasília, DF - Brazil Telephone: +55 61 2105 5000 ipc@ipcig.org ■ www.ipcig.org The IPC-IG is a partnership between the United Nations and the Government of Brazil to promote learning on social policies. The Centre specialises in research-based policy recommendations to foster the reduction of poverty and inequality as well as promote inclusive growth. The IPC-IG is linked to the United Nations Development Programme (UNDP) in Brazil, the Ministry of Economy (ME) and the Institute for Applied Economic Research (Ipea) of the Government of Brazil. The designations employed and the presentation of material in this information product do not imply the expression of any opinion whatsoever on the part of the Food and AgricultureOrganization of the United Nations (FAO), or of the United Nations Development Programme (UNDP) concerning the legal or development status of any country, territory, city or area or of its authorities, or concerning the delimitation of its frontiers or boundaries. The mention of specific companies or products of manufacturers, whether or not these have been patented, does not imply that these have been endorsed or recommended by FAO, or UNDP in preference to others of a similar naturethat are not mentioned. The views expressed in this information product are those of the author(s) and do not necessarily reflect the views or policies of FAO, or UNDP. FAO and UNDP encourage the use, reproduction and dissemination of material in this information product. Except where otherwise indicated, material may be copied, downloaded and printed for private study, research and teaching purposes, or for use in non-commercial products or services, provided that appropriate acknowledgment of FAO and UNDP as the sources and copyright holders is given and that neither FAO nor UNDP endorsement of users’ views, products or services is implied in any way. All requests for translation and adaptation rights, and for resale and other commercial use rights should be made via www.fao.org/contact-us/licence-request or addressed to copyright@fao.org. FAO information products are available on the FAO website (www.fao.org/publications) and can be purchased through publications-sales@fao.org. UNDP/IPC-IG publications are available online at www.ipcig.org/publications free of charge. ISBN: 978-92-5-133912-1 [FAO] © FAO and UNDP, 2021 IPC-IG Working Papers are available online at www.ipcig.org and subscriptions can be requested by email to ipc@ipc-undp.org. Suggested citation: Sato, L. 2021. The state of social insurance for agricultural workers in the Near East and North Africa and challenges for expansion. Brasília: Food and Agriculture Organization of the United Nations and International Policy Centre for Inclusive Growth. Available at .
CONTENTS

Acknowledgements......................................................................................... 5

1 Introduction................................................................................................. 6

2 Background: urban-rural inequalities and the importance of social
protection for rural areas..............................................................................10
2.1 Agricultural sector in the NENA region............................................................................................. 10
2.2 The urban-rural division in the NENA region.................................................................................. 14
2.3 Why is social protection important for rural areas?...................................................................... 16

3 Taking stock of contributory schemes in NENA......................................20
3.1 Overview of social protection systems—a focus on social insurance .................................. 21
3.2 Agricultural insurance............................................................................................................................. 27

4 Challenges for the expansion of social protection in the NENA region
and best practices to overcome them..........................................................28
4.1 Lack of data................................................................................................................................................. 28
4.2 Legal framework and programme design........................................................................................ 29
4.3 Financial barriers....................................................................................................................................... 33
4.4 Administrative and institutional barriers.......................................................................................... 36
4.5 Participation and information challenges........................................................................................ 38

5 Conclusions................................................................................................38

References......................................................................................................41
LIST OF BOXES

Box 1. Key concepts................................................................................................................................................................................ 9
Box 2. COVID-19’s consequences to informal workers and policy responses.................................................................20
Box 3. Morocco’s subsidies to the Mutuelle Agricole Marocaine d’Assurances..................................................................28
Box 4. Problems with voluntary coverage of social insurance schemes...........................................................................34
Box 5. Social protection to small-scale fishers: gradual legal inclusion and the importance of subsidies...........35

LIST OF FIGURES

Figure 1. Projected evolution of the rural and urban populations in the NENA region, total and across three
subregions, 1950-2050.........................................................................................................................................................................11
Figure 2. Employment in agriculture (as a share of total employment), Arab World, 1991-2019............................12
Figure 3. Agriculture, forestry and fishing, value added (as a percentage of GDP), Arab World, 1975-2017.......13
Figure 4. Employment in agriculture (as a share of total employment), and value added (as a share of GDP) of
the agricultural sector per country, as of 2017............................................................................................................................13
Figure 5. Urban and rural poverty headcount rates evaluated at the national poverty line, selected NENA
countries....................................................................................................................................................................................................15
Figure 6. FAO’s social protection framework...............................................................................................................................19
Figure 7. Proportion of the population covered by social protection systems (as a percentage)...........................22

LIST OF TABLES

Table 1. Mean nominal monthly earnings of employees by economic activity (in 2017 USD PPP)........................15
Table 2. Main risks and vulnerabilities faced by rural communities...................................................................................16
Table 3. Potentialities of social protection in rural areas .......................................................................................................18
Table 4. Social insurance indicators, rural and urban areas...................................................................................................23
Table 5. Explicit legal exclusions and inclusions of agricultural workers in contributory social protection
schemes in the NENA region (selected countries).....................................................................................................................30
Table A1. Main International Labour Standards on social protection—Recommendations....................................49
Table A2. Main International Labour Standards on social protection—Conventions.................................................49
Table A3. Main Conventions guaranteeing social insurance for agricultural workers.................................................50
ACKNOWLEDGEMENTS

This Working Paper is the result of partnership between the International Policy Centre for
Inclusive Growth (IPC-IG) and the Food and Agriculture Organization of the United Nations’
Regional Office for the Near East (FAORNE).
   This paper draws on a first version drafted by Flavia Lorenzon and Nourjelha Mohamed
Yousif Elhajand. It was prepared by Lucas Freschi Sato (IPC-IG), under the coordination of
Charlotte Bilo, Anna Carolina Machado (both IPC-IG) and Dalia Abulfotuh (FAORNE).
    The IPC-IG research team would like to thank Omar Benammour (FAO), Ana Ocampo (FAO),
Christina Behrendt (ILO), Luca Pellerano (ILO ROAS), Mira Bierbaum (ILO), Quynh Anh Nguyen
(ILO), and Christine Rouhana (ILO ROAS) for their extensive review and valuable comments and
suggestions throughout the elaboration of this work.
THE STATE OF SOCIAL INSURANCE FOR AGRICULTURAL
WORKERS IN THE NEAR EAST AND NORTH AFRICA AND
CHALLENGES FOR EXPANSION
Lucas Sato1
Agricultural workers are exposed to many risks during their life cycle and are particularly vulnerable
to covariate risks, such as droughts, armed conflict and pandemics. Despite the great potential
of social protection policies to protect this segment of the population, agricultural workers are
commonly excluded from social protection systems—especially from contributory schemes—due
to legal, programme design, financial, administrative, institutional, participation, and information
barriers. This paper analyses the availability of social insurance schemes for agricultural workers in
the Near East and North Africa (NENA) region, including many types of insurance: old age, disability
and survivors’, sickness and maternity, work injury, and unemployment, as well as family and child
allowances. In addition, we analyse agricultural insurance schemes, as they play a critical role in
protecting agricultural producers from the catastrophic impact of covariate risks. We examine the
barriers for agricultural workers to participate in contributory schemes, highlighting good practices
being adopted in NENA countries to address them. This paper thus aims to help fill a gap in the
literature regarding the role of contributory schemes for agricultural workers. Most importantly,
it aims to highlight paths towards more comprehensive social protection systems, capable of
addressing the pressing challenges in NENA countries, such as inequities between rural and urban
populations, lack of rural development, and insufficient protection for rural families.
Keywords: social protection; social insurance; rural development; agricultural workers,
Near East and North Africa
1 INTRODUCTION
Countries in the Near East and North Africa (NENA) region2 are experiencing various changes.
With economic restructuring and urban migration rates spiking, unemployment is high
and the share of gross domestic product (GDP) of traditional sectors, such as agriculture, is
decreasing. In addition, the average age of agricultural workers is increasing and not enough
youth are joining the sector, exacerbating the already low levels of labour force participation
and high levels of youth unemployment that characterise the region3 (Bird and Silva 2020).
1. International Policy Centre for Inclusive Growth (IPC-IG).
2. See Box 1 for regional definitions used in this Working Paper.
3. Analysing the labour markets in the MENA region, Bird and Silva (2020) observed that the MENA countries have the lowest youth
labour force participation rates and youth employment to population ratios in the World, a result mainly driven by the low female
participation in the labour force.International Policy Centre for Inclusive Growth 7
Although the agricultural sector is still responsible for a crucial share of jobs in NENA (20 per
cent of total employment in the Arab World, as of 2019) (World Bank n.d.), factors such as
lack of investment and proper training; limited access to financing mechanisms, agricultural
insurance schemes and social protection; and large fragmentation of lands are pushing down
productivity rates in the agricultural sector. As a result, the rural populations—which are highly
dependent on agricultural and natural resources—face many vulnerabilities and shocks, which
have been aggravated by the long-standing conflicts in various countries (such as in Syria, Iraq,
Yemen and Palestine), as well as by climate change. Climate change alone is predicted to push
an additional 100 million people into poverty worldwide if appropriate interventions, including
social protection, are not put in place (Hallegatte et al. 2016). NENA is one of the most affected
regions by the consequences of climate change (Allieu and Ocampo 2019).
There is now a broad consensus regarding the importance of the extension of social protection
coverage to people in rural areas through a combination of contributory and non-contributory
schemes. Within national social protection systems, nationally-defined social protection floors
(SPFs) are particularly important to guarantee at least a basic level of social security to all people,
and to prevent—or at least alleviate—poverty, vulnerability and social exclusion throughout the life
cycle, covering children, working-age and elderly people. They are especially important for those
at risk of sickness, maternity, unemployment and disability. According to the International Labour
Organization (ILO) Social Protection Floors Recommendation No. 202 (2012), these guarantees
should ensure—at a minimum—that, over the life cycle, all persons in need have access to essential
health care and basic income security. Universal access to comprehensive and adequate social
protection systems, including floors, is an important tool to prevent and reduce poverty and
inequality, as reflected in human rights instruments, international social security standards and
SDG target 1.3. In 2020, the COVID-19 shock exacerbated vulnerabilities in labour markets,
and demonstrated the importance of ensuring access to health care services, cash transfers,
credit and insurance schemes for agricultural workers in order to maintain food security, prevent
the spread of the virus and guarantee safety and health at work (ILO 2020a; n.d.).
The first step to enhance SPFs is to assess the current situation in the respective countries.
This paper aims to contribute to the Food and Agriculture Organization of the United Nations
(FAO)’s work in supporting the expansion of social protection to reach all rural populations,
to achieve progressive universal coverage (FAO 2017) and building coherence between social
protection and agriculture for a stronger impact on rural development (FAO 2017; 2016).
NENA countries are currently writing a new chapter in the history of their social policies,
as governments that traditionally relied on public employment and consumer subsidies as the
basis for their social contracts are shifting towards more comprehensive social protection policies
(Loewe 2017; UNESCWA 2019; Jawad 2017; IMF 2017). While many countries are moving away
from more regressive subsidies, and more pro-poor social assistance schemes have been created
and reformed (Machado et al. 2018), most contributory schemes—or social insurance—have still
not been reformed to expand coverage for workers in sectors characterised by high informality
and seasonality, as is the case of rural workers 4 (Loewe 2017; Allieu and Ocampo 2019; ILO
2020b; n.d.). Commonly, agricultural workers are excluded from national labour protection laws,
and are not covered by such policies as minimum wages, maximum hours of work or social
insurance. Most of them belong to the ‘missing middle’, neither qualifying for social assistance nor
4. This situation is changing in some countries. Recent reforms in Tunisia provide a good example of the inclusion of rural women in the
informal sector into social insurance schemes, as mentioned later in this study.8 Working Paper
having access to social insurance. This leaves workers and families unprotected (ILO 2020a; n.d.).
However, along with other instruments such as non-contributory social protection programmes,
social insurance is a necessary tool to promote sustainable development in rural zones, given its
role in ensuring access to health care; providing medical benefits; guaranteeing income security;
promoting gender equality; preventing or at least alleviating poverty among elderly people
and people with disabilities; providing income protection in case of accidents in the workplace;
supporting families whose provider has passed away; and facilitating transitions from the
informal to the formal economy, among many other aspects.
Against this background, this Working Paper focuses on the importance of social
protection for rural development, aiming to understand the overall situation in the NENA
region, with a special focus on social insurance schemes and programmes, their coverage
gaps and how they currently cover agricultural workers. While the region’s social assistance
schemes have been analysed in previous comparative studies (e.g. Machado et al. 2018),
contributory schemes have been discussed less extensively, even less so with a particular focus
on their availability to cover agricultural workers. It is critical to fill this research gap, especially
considering the role of social insurance schemes to mitigate risks and vulnerabilities throughout
the life cycle, and preventing impoverishment, a key function for sustainable economic inclusion
processes. Moreover, there is a clear need to improve their low coverage rates in the region,
including extending coverage to the notable ‘missing middle’, which has become more apparent
than ever during the current COVID-19 health crisis. To this end, this paper discusses some of the
main barriers to the expansion of social insurance schemes,5 namely: i) lack of demographic
data and data on social protection coverage ii) exclusions in legal frameworks and
programme design; iii) financial restrictions; iv) administrative and institutional
challenges; and v) participation and information challenges. In addition, examples
of policies adopted by countries in the region to overcome these obstacles will be provided.
This introduction provides the main concepts guiding this study, which are presented in
Box 1. Subsequently, this paper is divided into three major sections. The first offers background
information, establishing the importance of the agricultural sector for the national economies
in NENA and highlighting the social divisions between the rural and urban population in terms
of socioeconomic indicators.
The second section summarises the state of social insurance schemes in the region.
The analysis is based on data provided by the Atlas of Social Protection Indicators of Resilience
and Equity (ASPIRE), the International Social Security Association (ISSA), and the ILO’s World
Social Protection Report.
The third section summarises the challenges involved in expanding such schemes to rural
areas, and best practices that have been adopted across the region. Twelve NENA countries
(Algeria, Libya, Mauritania, Morocco, Tunisia, Egypt, Iran, Iraq, Jordan, Lebanon, Sudan and
Syria) were considered in this section, excluding the Gulf States and Iraq. Gulf States are mostly
higher-income countries with small rural populations, and whose challenges are quite different
from the rest of the region. In the case of Iraq, a lack of data prevented further analysis.
Finally, the conclusion highlights the main points raised in each section.
5. See also the ILO’s categorisation of barriers to extend coverage for workers in the informal economy: .International Policy Centre for Inclusive Growth 9
BOX 1. Key concepts
1. Agricultural workers: This working paper considers ‘agricultural workers’ all persons working in economic
activities across all sectors of agriculture, including farming, forestry and fisheries, as defined by the United Nations
Department of Economic and Social Affairs (UNDESA 2008). Therefore, all activities involving the exploitation of
vegetable and animal natural resources (including growing and harvesting crops, raising and breeding animals,
harvesting timber and other plants, animals or animal products from a farm or their natural habitats) are
considered agricultural work.
2. Informal employment: Based on the ILO’s definition agreed on during the 17th International Conference
of Labour Statisticians (ICLS), informal employment can be defined as “all remunerative work (i.e. both self-
employment and wage employment) that is not registered, regulated or protected by existing legal or regulatory
frameworks, as well as non-remunerative work undertaken in an income-producing enterprise. Informal workers
do not have secure employment contracts, workers’ benefits, social protection or workers’ representation”
(ILO n.d.; 2020d). Informality has a negative effect on the development of sustainable enterprises, public
revenues and the governmental scope of action (ILO 2018b).
3. Categories of employment: the International Classification of Status in Employment 2018 (ICSE-18) defines
different categories of employment according to the type of economic risk (employment for pay and employment
for profit) and type of authority (independent and dependent workers) (ILO 2018a). The classification per type of
authority is especially useful for the purposes of this paper. Its subcategories are:
3.1. Independent workers
3.1.1. Employers: “persons who operate their own business either on their own or in partnership with
others in which they employ one or more persons on a regular basis (except themselves, their partner or a
contributing family worker)” (ILO 2018a, pp. 10-11).
3.1.2. Independent workers without employees: “operate a business on their own or in partnership with
others in which they do not employ any person other than themselves, their partner or a contributing family
worker on a regular basis.” (ILO 2018a, p. 11).
3.2. Dependent workers
3.2.1. Dependent contractors: “workers employed for profit, who are dependent on another entity that
exercises explicit or implicit control over their activities and directly benefits from the work performed by
them. Their dependency may be of an operational nature, through organization of the work and/or of an
economic nature such as through control over access to the market, the price for the goods or services
produced, or access to raw materials or capital items” (ILO 2018a, p. 11).
3.2.2. Employees: “workers who do not hold controlling ownership over the economic unit in which they are
employed. They are typically paid for time worked but can also be paid for each task or piece of work done
or for services provided including sales (by the piece or commission). They are not paid according to the
terms of a commercial contract for the provision of goods or services.” (ILO 2018a, p. 11).
3.2.3. Contributing family workers: “workers who assist a family member or a household member in
the enterprise operated by the family or household member, or in a job in which the assisted family or
household member is an employee or dependent contractor. Contributing family workers do not have the
responsibility for the enterprise and do not make the most important decisions about it. They do not receive
regular payments such as wage or salary but can benefit from intra-household transfers” (ILO 2018a, p. 12).
4. Social protection: many different definitions of social protection co-exist and they usually include social
assistance and social insurance, and in some instances labour market policies and programmes. According to the
ILO, “social protection, or social security, is a human right and is defined as the set of comprehensive policies
and programmes designed to reduce and prevent poverty and vulnerability throughout the life cycle” (ILO
2017b). For FAO (2017), social protection “comprises a set of policies and programmes that addresses economic,
environmental and social vulnerabilities to food insecurity and poverty by protecting and promoting livelihoods.”
Social protection systems are usually understood to comprise a mix of two main components, social insurance
and social assistance. Some organisations, such as the World Bank, also include labour market policies as a third
component (World Bank n.d.).
4.1. Social Insurance schemes: “Contributory social protection scheme that guarantees protection through
an insurance mechanism, based on: (1) the prior payment of contributions, i.e. before the occurrence of the
insured contingency; (2) risk-sharing or “pooling”; and (3) the notion of a guarantee” (ILO 2017a, p. 194).10 Working Paper
Insured workers make contributions that allow the establishment of a shared fund, which covers the expenses
related to defined contingencies (e.g. employment injury, sickness, pregnancy, job loss, etc.). The difference
between commercial insurance and social insurance is the fact that the latter is based on the principle of
solidarity in risk-pooling, and not in individually calculated risk premiums. Some countries include non-
contributory elements in their social insurance schemes, financed by the State or by redistributing contributions
within the scheme. Finally, it is important to note that some countries offer voluntary social insurance regimes
or schemes targeting workers that are not covered by the compulsory social insurance—i.e. informal workers.
Voluntary insurance usually does not include all benefits that compulsory social insurance beneficiaries are
entitled to, and given their low attractiveness (due to high contributions and few benefits), they typically have
low coverage rates (ILSSA and ILO 2014; Huong 2019).
4.2. Social assistance programmes/schemes: “A scheme that provides benefits to vulnerable groups of the
population, especially households living in poverty. Most social assistance schemes are means-tested.” (ILO 2017a,
p. 194). Social assistance programmes are usually non-contributory, which means that beneficiaries or their
employers do not need to make contributions in order to benefit from them. Instruments used in social assistance
schemes include cash transfers, in-kind transfers, subsidies, school feeding programmes, and many others.
4.3. Labour market programmes can be divided into active labour market programmes (those that aim to
encourage people to work, increase the earnings capacity of workers, and reduce the risk of unemployment—
for example, job training, employment services, employment stimulus) and passive labour market programmes
(those that alleviate the financial needs of unemployed people without addressing employability directly—such
as unemployment insurance and income support) (Bird and Silva 2020).
5. Regional divisions: Different international organisations and United Nations (UN) agencies group countries in
different ways. The central territorial division used in this paper considers FAO’s definition of Near East and North
Africa. However, as other sources of data use different terminologies, they were also considered.
5.1. Near East and North Africa (NENA): According to FAO’s definition, the NENA region is composed of 19
countries and can be divided into three subregions: North Africa (Maghreb)—Algeria, Libya, Mauritania,
Morocco, Tunisia; Oriental Near East (Mashreq)—Egypt, Iran, Iraq, Jordan, Lebanon, Sudan, Syria; and the Gulf
States and Yemen (GCC + Yemen)—Saudi Arabia, Kuwait, Bahrain, United Arab Emirates (UAE), Qatar, Oman
and Yemen. NENA also includes the West Bank and Gaza Strip.
5.2. Middle East and North Africa (MENA): According to the World Bank’s definition, the MENA region includes
all NENA counties and Djibouti, Israel and Malta.
5.3. Arab World: According to the World Bank’s definition, the Arab World includes all NENA counties except
Iran and adds Comoros, Djibouti and Somalia.
6. Rural communities: This term refers to communities living in rural areas/outside towns and cities. It is necessary
to recognise that it is a broad term which includes a great variety of political, economic and social organisation
across NENA and worldwide. In this paper, we focus on the most vulnerable rural communities.
2 BACKGROUND: URBAN-RURAL INEQUALITIES AND THE
IMPORTANCE OF SOCIAL PROTECTION FOR RURAL AREAS
2.1 AGRICULTURAL SECTOR IN THE NENA REGION
The demographic dynamics in NENA are characterised by a fast growth rate. The region is
projected to reach 692 million people by 2050. This growth pattern can be expected to lead to
increasingly rapid urbanisation, which poses challenges to countries, especially regarding the
agricultural sector. The share of the population in the region that will be living in rural areas
is expected to fall just above 30 per cent, whereas in 2020 the estimations are above 40 per
cent (UNDESA 2018). Figure 1 illustrates this dynamic, showing the rapid growth of the urban
population and the decline of rural population across all three NENA subregions, and moreInternational Policy Centre for Inclusive Growth 11
sharply in Mashreq. A direct consequence of this demographic shift will be the deepening
of food dependency in the region, which already needs to import 40 per cent of its agri-food
demands (Mouël and Schmitt 2018).6
FIGURE 1. Projected evolution of the rural and urban populations in the NENA region, total and across three
subregions, 1950-2050
500,000
400,000
300,000
200,000
100,000
0
2050
1950
1955
1960
1965
1970
1975
1980
1985
1990
1995
2000
2005
2010
2015
2020
2025
2030
2035
2040
2045
Maghreb – Rural Mashreq – Rural GCC+Y – Rural NENA – Rural
Maghreb – Urban Mashreq – Urban GCC+Y – Urban NENA – Urban
Source: UNDESA (2018; 2018).
A larger youth population, combined with increased rural exodus, may also exacerbate a
long-standing problem in the region: youth unemployment.7 Youth unemployment among
women, for example, reaches 40 per cent in MENA countries, far above the worldwide average
of 13 per cent (Bird and Silva 2020). It is also particularly high in urban areas, as well as in the
industry and service sectors (FAO 2019b). Regardless, the rural youth continue to migrate to
urban regions. Usually, migration is seen as the only chance to improve their living conditions;
since if they were to stay in rural areas, they would remain unemployed or work as unskilled
agricultural labourers in precarious jobs. Additionally, conflicts and climate change also drive
forced migration, especially of the rural population, contributing to the growth in inequality
and food insecurity (Wenger and Abulfotuh 2019).
According to the ILO, over 90 per cent of agricultural workers in low and middle-income
countries are in informal employment (ILO 2018c), including wage workers in casual and
6. Bird and Silva (2020) also explore this in greater depth.
7. The NENA region has one of the highest youth unemployment rates in the World: as of 2018, youth unemployment in North Africa had
reached 30 per cent, compared to 17 per cent in Eastern Europe and 19 per cent in Latin America and the Caribbean, and North, South
and Western Europe (FAO 2018).12 Working Paper
seasonal employment arrangements, as well as a significant presence of self-employed
farmers, informal entrepreneurs and family members (Allieu and Ocampo 2019).
Nearly half of the total agricultural labour force worldwide is composed of wage workers.
They are among the poorest and most vulnerable workers in most countries (FAO 2020b),
often engaged in seasonal, poor quality and low-productivity jobs with insecure work
conditions (Allieu and Ocampo 2019). Regarding self-employed people, more than 80 per cent
of those in the agricultural sector are informal workers, including the totality of contributing
family workers (FAO 2020b).
The agricultural sector is still essential for employability in the NENA region. As of 2017,
more than 20 per cent of the labour force was employed in this sector, according to the
World Bank’s figure for the Arab States.8 Figure 2 shows that the importance of agriculture
to the region’s labour market has been very slowly decreasing over the last three decades,
contracting 10 percentage points over 18 years.
FIGURE 2. Employment in agriculture (as a share of total employment), Arab World, 1991-2019
40
35
35
30
% of total employment
24.9
25
20.8
20
15
10
5
0
1991
1992
1993
1994
1995
1996
1997
1998
1999
2000
2001
2002
2003
2004
2005
2006
2007
2008
2009
2010
2011
2012
2013
2014
2015
2016
2017
2018
2019
Source: Author’s elaboration based on The World Bank. DataBank. Employment in agriculture (% of total employment)
(modelled ILO estimate).
Despite the sector’s importance to the labour market, agricultural activities only represent
5 per cent of the regional GDP in the Arab World (as of 2017). Figure 3 shows that during the
1980s, the relevance of the sector as a share of GDP grew, reaching its highest levels during
the early 1990s. However, over the past decade, the share has remained stable at just 5 per
cent of the regional GDP. Figure 4 correlates the participation of the agricultural sector to both
the labour market and GDP, showing clear differences across countries. In the Gulf area, for
example, agriculture represents a small share of employment, while in Mauritania it represents
more than half of total employment.
8. The World Bank definition of “Arab States” is closest to the definition of NENA region adopted in this paper. Except for Iran,
the Arab States’ average includes all other 18 countries in NENA, in addition to Somalia, Comoros, Djibouti and Palestine.International Policy Centre for Inclusive Growth 13
FIGURE 3. Agriculture, forestry and fishing, value added (as a percentage of GDP), Arab World, 1975-2017
12
10
Value added (% of GDP)
8
6
4
2
0
1975
1976
1977
1978
1979
1980
1981
1982
1983
1984
1985
1986
1987
1988
1989
1990
1991
1992
1993
1994
1995
1996
1997
1998
1999
2000
2001
2002
2003
2004
2005
2006
2007
2008
2009
2010
2011
2012
2013
2014
2015
2016
2017
2018
Source: Author’s elaboration based on The World Bank. DataBank. Agriculture, forestry, and fishing, value added (% of GDP).
FIGURE 4. Employment in agriculture (as a share of total employment), and value added (as a share of GDP)
of the agricultural sector per country, as of 2017.
Bahrain 0.3
1.0
Qatar 0.2
1.3
UAE 0.7
1.6
Kuwait 0.4
2.1
Jordan 5.5
3.2
Saudi Arabia 2.2
3.6
Oman 2.2
4.8
Algeria 11.9
10.2
N.A.
Syria 11.3
Tunisia 9.7
13.7
Lebanon 2.9
14.0
Iran 9.5
17.6
Iraq 3.3
18.6
Lybia N.A. 19.1
Arab World 5.4
20.8
Egypt 11.5
25.0
Yemen 4.0
29.6
Morocco 12.4
35.9
Sudan 30.5
40.3
Mauritania 23.9
52.7
0.0 10.0 20.0 30.0 40.0 50.0 60.0
Agriculture, forestry and fishing, value added (% of GDP) Employment in agriculture (% of total employment)
Source: Author’s elaboration based on World Bank ( n.d.). DataBank - Agriculture, forestry, and fishing, value added (% of GDP)
and Agriculture, forestry, and fishing, value added (% of GDP).14 Working Paper
It is important to highlight the low productivity of the agricultural sector in most
countries. In Yemen, for example, in 2017, over 29 per cent of the working population
produced only 4 per cent of the national GDP. Only in Algeria and Jordan does the
agricultural sector’s share of GDP exceed participation in the labour market. The low
productivity of labour in agriculture correlates with the structural changes that have been
taking place in the region, which has been historically marked by a lack of public policies
towards agriculture transformation9 (FAO 2019b). A global comparison of the value of
gross production per hectare of agricultural land indicates that the MENA region is far
below global averages in any period of analysis. It is one of the regions with the lowest
agricultural productivity in the world, only above sub-Saharan Africa in absolute terms.10
It is also concerning that the region has ranked at the bottom in terms of agricultural
productivity growth since the 1980s11 compared to other developing regions, which
indicates a relative deterioration of performance (OECD and FAO 2018).
Despite its low productivity, the agricultural sector is essential for livelihoods and
poverty reduction in rural communities, especially considering that more than 80 per
cent of agricultural production in the NENA region consists of small-scale family farmers
(Serraj and Pingali 2018a). Also, the analysis of the contribution of agricultural activities
to GDP tends to be limited, leading policymakers to underestimate the importance of
rural areas to the economy. A review focused only on GDP is misleading, as it ignores the
potential of agricultural development in poverty alleviation (FAO 2019b). Cross-country
estimations indicate that agricultural development is at least twice as effective in reducing
poverty when compared to other economic sectors (World Bank 2007). This is because
poor people participate more in the growth of the agricultural sector, resulting in a
much larger elasticity of overall poverty to agricultural GDP than to non-agricultural GDP
(Christiaensen, Demery, and Kühl 2006). In addition, agricultural development is often
associated with a relative decrease in food prices, which leads to positive impacts on
real wages and labour productivity in the overall economy (FAO 2011).
2.2 THE URBAN-RURAL DIVISION IN THE NENA REGION
Directly related to the low productivity of agriculture in the NENA region, a primary indicator
of the inequality and poverty in rural areas is the difference between the average monthly
earnings of agricultural workers compared to the national average considering all economic
activities. Although data is only available for a limited list of countries (see Table 2), in all of
them the agricultural sector had lower averages when compared to the overall averages.
In the UAE, for example, the mean income of workers in the agricultural sector is more than
three times smaller than the overall average. It is also important to note that the agricultural
9. According to FAO’s definition, agriculture transformation consists in the shift from traditional farming to commercial and diversified
production systems. Agriculture transformation is the result of policy choices, depending largely on government investments in
infrastructure (e.g. roads, railways and storage facilities), agricultural research and education, and enforcing standards for food safety,
quality and processing (FAO 2019b).
10. Considering values for 2001-2014, the value of gross production per hectare of agricultural land in the MENA region was USD226,000,
while the world average is USD449,000. The value observed in the MENA region is only higher than those in sub-Saharan Africa
(USD146,000) (OECD and FAO 2018).
11. Considering the value of gross production per hectare of agricultural land.International Policy Centre for Inclusive Growth 15
sector is largely composed of temporary, seasonal and migrant workers, who often receive
lower wages and face higher risks and vulnerabilities (ILO n.d.; 2020a).
TABLE 1. Mean nominal monthly earnings of employees by economic activity (in 2017 USD PPP)12
Country All economic activities Agriculture, forestry and fishing
UAE 3017.3 691.8
Egypt 592.3 586.8
Qatar 3928.2 1835
Saudi Arabia 3829.1 1349.8
Yemen 541.8 335.1
Source: Author’s elaboration based on ILO Stat—Mean nominal monthly earnings of employees by sex and economic activity
(accessed 21 June 2020).
Partially due to lower earnings, rural areas often have higher income poverty rates than
urban areas. In some countries (such as Egypt, Iraq, Mauritania, Sudan and Yemen) they are
more than twice as high (see Figure 5). Notwithstanding, access to services and coverage of
social protection schemes are usually lower in rural areas. Moreover, in most countries in the
NENA region, access to education, health, housing and other public services is between 3 and
20 times lower in rural zones (FAO 2019b). In short, rural areas are commonly characterised
by high dependence on agriculture and natural resources, high levels of informality in
employment arrangements, low productivity rates and high prevalence of poverty.
FIGURE 5. Urban and rural poverty headcount rates evaluated at the national poverty line, selected NENA countries
70.0
59.4 57.6
60.0
Percentage of popula on
50.0
40.1
40.0 36.9
32.3 30.6 30.8
30.0 26.5
20.8 20.7
20.0 15.3 16.8
14.8 14.4
13.9
10.0 4.8 5.8 4.8
0.0
Algeria Egypt Iraq Jordan Mauritania Morocco Sudan Syria Yemen
(2011) (2010) (2012) (2010) (2008) (2007) (2009) (2007) (2005)
Rural Poverty Headcount (%) Urban Poverty Headcount (%)
Source: Author’s elaboration based on FAO (2019b) and World Bank data.
12. Purchasing power parity.16 Working Paper
2.3 WHY IS SOCIAL PROTECTION IMPORTANT FOR RURAL AREAS?
Poor rural households that mostly rely on agriculture as a source of income are often affected
by a set of factors that hamper their ability to diversify livelihoods. In addition to the lifecycle
risks related to ageing, pregnancy, disability, and gender, rural poor people, especially women,
are faced with added and specific vulnerabilities and risks, which also contribute to hinder
pathways to their sustained economic inclusion (summarised in Table 2). A combination of
contributory and non-contributory schemes can protect agricultural workers and their families
from these risks. This section aims to understand the role of social protection in addressing
risks and vulnerabilities in rural communities, paying special attention to social insurance
policies. This focus aims to contribute to filling a gap in the literature—many studies have
been carried out on the importance of social assistance to rural communities, but there are
few comparative studies that specifically assess social insurance for agricultural workers,
and particularly in the NENA region.
TABLE 2. Main risks and vulnerabilities faced by rural communities
Risks Description
Social Rural communities are often politically and socially excluded, which reinforces their vulnerabilities
to a range of factors including: lack of, or poor access to, public services (e.g. education and health
care); difficulties in accessing formal credit; lack of land rights; poor infrastructure (such as roads and
electricity); exposure to labour abuse; and the lack of vital statistics or data. Gender discrimination
and child labour are usually more widespread in marginalised rural communities.
Health Rural and poor areas are generally characterised by elevated levels of risk to health, disease and
environmental hazards. Furthermore, work in the agricultural sectors is highly hazardous, arduous,
and workers are exposed to a wide range of risks. Rural populations are also exposed to health risks
at the group or community level (epidemics) and often suffer from a lack of good quality or even
functional health care services. Events related to giving birth may present additional risks for women,
especially in the absence of health services, maternity benefits or employment protection.
Economic Low levels of agricultural productivity; limited access to credit markets; high unemployment rates;
weak labour market arrangements; and high level of informal, casual and seasonal employment
arrangements make rural areas that are dependent on agriculture deeply vulnerable to economic risks.
Natural and Events such as floods, droughts, pollution and land degradation, as well as climatic changes,
environmental have significant impacts on crop and livestock production, fisheries and aquaculture, and forestry.
Moreover, seasonality is a significant contributor to hunger and undernutrition. These risks affect
the incomes of agricultural workers in several ways.
Source: Author’s elaboration based on Allieu and Ocampo (2019).
While rural communities are not homogeneous across the NENA region, and there are
many differences between and within countries, many of the risks faced by agricultural workers
are common. Economic risks such as the low levels of agricultural productivity (discussed in
the previous section) and inflation are aggravated by shocks such as the outbreak of the novel
coronavirus pandemic in 2020. One of the many consequences of the pandemic (see Box 2) is
that it prevents rural producers from accessing markets—one of their primary sources of income.
Moreover, rural communities in the NENA region are among the most vulnerable populations
to climate changes worldwide (Allieu and Ocampo 2019). Desertification and losses caused by
natural events are common, and water shortage is already a problem faced in most countries,
which tends to exacerbate other issues and generate more political instability.13 Additionally, rural
13. In Egypt, for example, climate change could reduce rice production by 11 per cent and soybeans by 28 per cent by 2050 (FAO 2011),
and an ongoing dispute over the use of Nile water for the Grand Ethiopian Renaissance Dam is already causing great animosity between
Egypt, Ethiopia and Sudan.International Policy Centre for Inclusive Growth 17
populations are disproportionately affected by longstanding conflicts, which destroy livelihoods
and cause food insecurity. It is estimated that up to 60 per cent of the total population of countries
affected by these conflicts and crises live in rural areas (IFPRI 2020).
Social protection is a fundamental policy instrument in response to these challenges
(see Box 1 for definitions on social protection), especially for those in situations of vulnerability.
Social protection approaches that take into consideration the specific livelihoods and
associated risks and vulnerabilities faced by rural households, as well as the challenges in
addressing them, are needed to help rural populations invest in productive activities and
human resources, in addition to coping with shocks and declining productivity (FAO 2018).
Worldwide, social protection policies have the potential to provide immediate assistance
to 736 million people living in extreme poverty and more than 820 million living with hunger
(FAO 2019a). Both non-contributory and social insurance programmes have crucial roles in
providing social protection to rural communities: while non-contributory schemes—including
social assistance—have the potential to provide a basic level of income security, access to
essential health care, ensure food security, and small-scale livelihood activity. Social insurance
is crucial to providing higher levels of protection, enabling rural populations to better manage
risks and prevent impoverishment (FAO 2019a).
Another potential of social protection is its effectiveness in mitigating, preventing
and responding to crises and conflicts. This is especially important in the NENA region,
as long-standing conflicts in Syria, Iraq, Yemen, and Palestine exacerbate the vulnerability
of the population, including by forcing displacements. Through its preventive role, social
protection enhances risk management capacity and early responsiveness; strengthens
the resilience of households; and supports the creation of assets and the construction
of infrastructure at the community level (for example, irrigation systems and storage
spaces). In conflict contexts, non-contributory social assistance programmes that target
rural areas help ensure food security, reduce the risks of impoverishment, prevent forced
displacement and facilitate safer conditions for migration14 (IFPRI 2020). In post-conflict
settings, they are crucial in supporting rural returnees, reviving local economies and
contributing to sustainable peace (FAO 2018).
Social protection policies, combined with comprehensive legislation and active labour
market policies, also have the potential to facilitate the transition to formality, which is
a crucial issue for rural workers. The absence of social protection favours informality by
leading many people to work in insecure conditions to escape poverty. Experiences from
countries across the world have shown that extending social protection to workers in the
informal economy—i.e. guaranteeing access to health care, education and income security,
results in positive effects on human capital and productivity, which in turn enhance formal
employment, domestic economic performance, and fiscal space in the long-run (ILO 2015;
Islam and Lapeyre 2020).
When social protection policies are integrated into broader rural development strategies,
they are likely to lead to more positive outcomes. FAO’s country-level impact evaluations
14. In Yemen, studies indicate that the Cash Transfers for Nutrition Programme had positive impacts in counteracting food insecurity
and intermediate outcomes in the country. In Mauritania, cash transfer programmes also improved the incomes of beneficiaries and had
positive impacts reducing land sales, child labour and begging practices during the crisis (IFPRI 2020).18 Working Paper
show that besides being a critical strategy for poverty reduction and inclusive growth, the
strengthened linkages between social protection and agricultural development can help
boost economic growth; promote food and nutrition security; enhance the productivity of
families; and build the resilience of poor rural families. Integrated social interventions that
lift households out of poverty have the potential to increase participation in social insurance
schemes and increase public revenues, which also helps finance interventions to combat
poverty and reduce inequalities (FAO n.d.; Serraj and Pingali 2018b).15 Table 3 summarises
some of the ways through which social protection can benefit people living in rural areas
(for other evidence-based effects of social protection, see FAO n.d. and FAO 2019a).
TABLE 3. Potentialities of social protection in rural areas
From protection Making migration
Enhancing resilience Empowering women
to inclusion a choice
1. Social protection, 1. During shocks, social 1. Gender-sensitive 1. Social protection
combined with sector- protection has the potential to social protection has the can facilitate safe
specific policies, gives protect people’s basic welfare potential to empower displacement by offering
small-scale producers and take on some of the women and reduce financial support
more capacity to move humanitarian caseloads inequalities in rural areas, to travel, as well as
from subsistence as women represent preventing forced
livelihoods to higher 2. Before and after the crisis, about 45 per cent of the displacement due to
levels of sustainable social protection can boost agricultural labour force, impoverished conditions
productivity by the capacity of smallholder but have less access to
increasing their capacity producers to prepare for further social protection services, 2. Social protection
to cope with shocks and difficulties, as well as address productive resources, services are pivotal in
risks and invest in new the structural causes of chronic credit, and agricultural meeting the needs
agricultural technologies poverty and vulnerability extension systems of vulnerable migrants
in rural areas (especially
2. Social protection 3. Social protection can alleviate 2. Gender-sensitive social internally displaced
enhances food and the impact of climate change protection boosts positive persons and refugees),
nutrition security by on rural producers and address impacts on food security, increasing the
removing financial and the barriers that prevent nutrition, and economic opportunities
social barriers compliance with natural resource productivity for migrants to
management measures (e.g. contribute to economic
3. Home grown school closed seasons for fisheries) 3. Cash transfers and public development, support
feeding programmes work programmes can have host communities
improve the livelihoods 4. Cash plus approaches can a significant impact on and help social and
of small-scale farmers, address immediate needs, rural women’s economic economic integration
local communities, and as well as resume or upscale empowerment, which has
children’s education household food production. a transformative role in the
They can also be used to attain communities, marketplace
specific goals, such as promoting and households
nutrition-sensitive agriculture,
climate-smart agriculture, and
the uptake of disaster risk
management practices
Source: Author’s elaboration based on FAO (2019a).
International organisations, such as FAO, advocate promoting social protection in rural
areas. In ‘Social Protection Framework: promoting rural development for all’ FAO (2017)
highlights the critical role of social protection in improving food security and nutrition,
agriculture development, resilience building and combating rural poverty. The organisation
15. In Brazil, for example, schemes such as the Incentive Programme for Rural Productive Activities and the Green Grant provide evidence of
the effectiveness of integrated strategies in lifting rural families out of poverty (WWP 2016; 2017a; 2017b; Government of Brazil 2019).International Policy Centre for Inclusive Growth 19
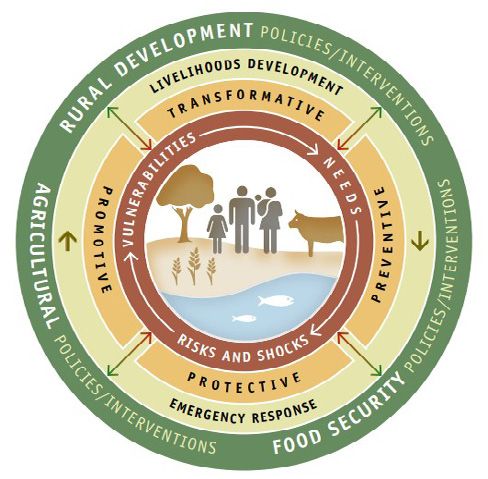
also considers the four social protection functions based on Devereux and Sabates-Wheeler
(2004),16 including the role of social insurance as a preventive instrument to avoid
deprivation, mitigate the impact of adverse shocks and prevent harmful risk-coping strategies.
Figure 6 summarises FAO’s social protection framework:
FIGURE 6. FAO’s social protection framework
Source: FAO (2017).
In particular, social insurance schemes allow vulnerable people living in rural areas
to manage the risks of agricultural activities, as well as offering coping mechanisms
to deal with risks and crisis across the life cycle (FAO 2019a; Tirivayi, Knowles, and Davis
2013). Social insurance provides protection against income loss over fixed periods of time
(e.g. unemployment, pregnancy, work accident, illness) and on a long-term basis (e.g. old age
pensions). Unlike social assistance, social insurance schemes are financed by direct contributions
from employers and workers (and, sometimes, government subsidies), which allows beneficiaries
to receive higher benefits and contributes to the systems’ fiscal sustainability. Also, as social
insurance schemes provide earnings-related benefits, they provide incentives for workers
to make larger contributions in order to receive proportionally higher benefits, which is
not the case with social assistance schemes. Moreover, the mixed and collective financing of
social insurance schemes is based on the principles of solidarity and risk pooling, allowing
everybody to be treated as an equal risk-bearer and to combat and prevent poverty through
redistributive features (Borowski and Kingson 2019). Finally, social insurance creates decent and
secure employment, which represents a compelling appeal to the NENA region considering the
demographic dynamics and high urban youth unemployment rates.
16. Protective=relieve conditions of poverty and deprivation (targeted sources and services); Preventive=avert conditions of poverty
and deprivation (contributory schemes); Promotional=enhance real incomes and capabilities (livelihood enhancing programmes);
Transformative=address concerns of social equity and exclusion (inclusive regulatory frameworks) (based on Devereux and Sabates-Wheeler 2004).You can also read