DISCUSSION PAPER SERIES - DP16167 Reading Twitter in the Newsroom: How Social Media Affects Traditional-Media - DISCUSSION ...
←
→
Page content transcription
If your browser does not render page correctly, please read the page content below
DISCUSSION PAPER SERIES

                  DP16167

Reading Twitter in the Newsroom: How
Social Media Affects Traditional-Media
        Reporting of Conflicts

 Sophie Hatte, Etienne Madinier and Ekaterina
                 Zhuravskaya

         DEVELOPMENT ECONOMICS
             PUBLIC ECONOMICS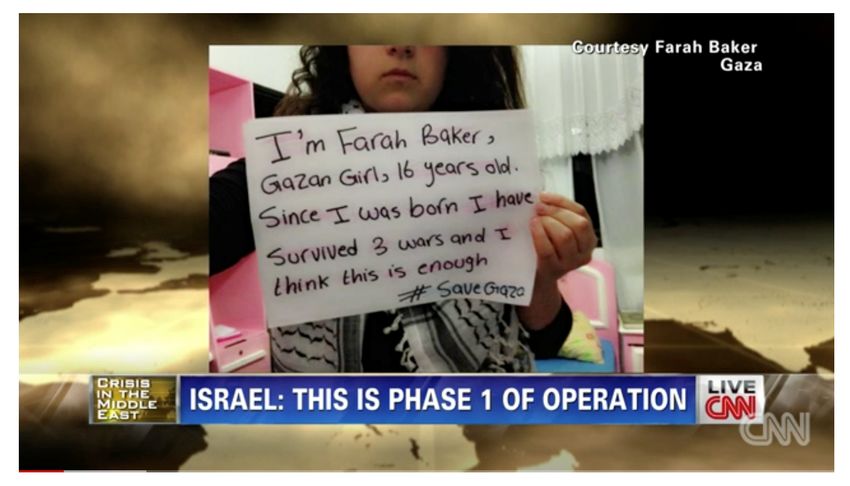
ISSN 0265-8003

Reading Twitter in the Newsroom: How Social Media
  Affects Traditional-Media Reporting of Conflicts
                  Sophie Hatte, Etienne Madinier and Ekaterina Zhuravskaya

                                  Discussion Paper DP16167
                                    Published 17 May 2021
                                    Submitted 14 May 2021

                             Centre for Economic Policy Research
                         33 Great Sutton Street, London EC1V 0DX, UK
                                   Tel: +44 (0)20 7183 8801
                                         www.cepr.org

This Discussion Paper is issued under the auspices of the Centre’s research programmes:

        Development Economics
        Public Economics

Any opinions expressed here are those of the author(s) and not those of the Centre for Economic
Policy Research. Research disseminated by CEPR may include views on policy, but the Centre
itself takes no institutional policy positions.

The Centre for Economic Policy Research was established in 1983 as an educational charity, to
promote independent analysis and public discussion of open economies and the relations among
them. It is pluralist and non-partisan, bringing economic research to bear on the analysis of
medium- and long-run policy questions.

These Discussion Papers often represent preliminary or incomplete work, circulated to encourage
discussion and comment. Citation and use of such a paper should take account of its provisional
character.

Copyright: Sophie Hatte, Etienne Madinier and Ekaterina Zhuravskaya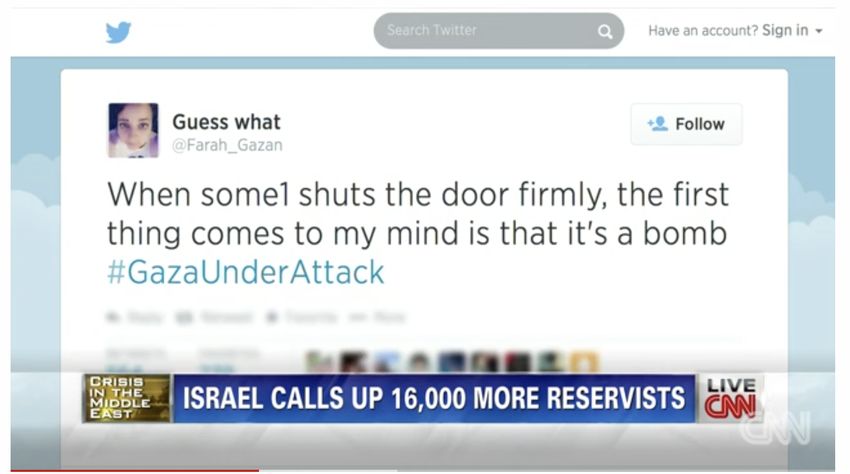
Reading Twitter in the Newsroom: How Social Media
                                     Affects Traditional-Media Reporting of Conflicts

                                                                                           Abstract
                                   Social media changes traditional-media news on conflicts. Online posts by citizen journalists—first-
                                   hand witnesses of conflict events—change the extent, tonality, and content of traditional-media
                                   reporting of conflicts. Using an exogenous and excludable variation in social-media posts in Israel
                                   and Palestine, driven by internet outages as a result of lightning strikes and technical failures, we
                                   show that, when social media in the conflict zone is not muted by internet outages, conflict news
                                   stories on US TV are more numerous and longer. Text analyses reveal that these stories have
                                   higher emotional intensity and focus more on the suffering of civilians and less on the role of US
                                   foreign policy or elections. The results suggest that social-media-driven democratization of the
                                   conflict news, i.e., the shift of focus from information provided by war gatekeepers to information
                                   from ordinary people, helps the narrative on the side of the conflict that has more civilian
                                   casualties.

                                   JEL Classification: N/A

                                   Keywords: social media, traditional media, Conflicts, Israeli-Palestinian Conflict, Twitter

                                   Sophie Hatte - sophie.hatte@ens-lyon.fr
                                   University of Lyon, ENS Lyon and GATE Lyon/St-Etienne

                                   Etienne Madinier - etienne.madinier@gmail.com
                                   Paris School of Economics

                                   Ekaterina Zhuravskaya - ekaterina.zhuravskaya@psemail.eu
                                   Paris School of Economics (EHESS) and CEPR

                                   Acknowledgements
                                   We thank Pierre Boyer, Julia Cagé, Ruben Enikolopov, Raphaël Franck, Jeffry Frieden, Matthew Gentzkow, Irena Grosfeld, Sergei
                                   Guriev, Noel Johnson, Mark Koyama, Ro'ee Levy, Maria Petrova, Pia Raffler, Dominic Rohner, Moses Shayo, David Yanagizawa-
                                   Drott, David Yang, Tamar Yerushalmi and the participants of seminars at the Center for Study of Public Choice (GMU), CREST
                                   (Ecole Polytechnique), ENS (Lyon), Harvard University, Hebrew University of Jerusalem, IFO Institute, Paris School of Economics,
                                   Stockholm School of Economics, University of British Columbia, Universit{\'e} de Montpellier, Universitat Manmheim, University of
                                   Sydney, University of Wisconsin-Madison, University of Zurich, CEPR Political Economy Webinar and CEPR RPN Conferences on
                                   preventing conflict for helpful comments. The authors wish to thank the World Wide Lightning Location Network, a collaboration
                                   among over 50 universities and institutions, for providing the lightning location data used in this paper. We thank Natasa
                                   Tagasovska for invaluable help with collection of Twitter data and Adrien Foutelet for excellent research assistance.

Powered by TCPDF (www.tcpdf.org)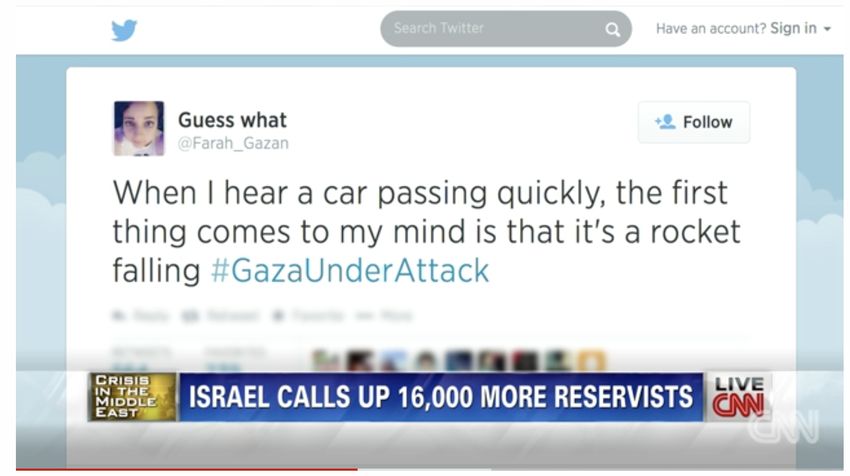
Reading Twitter in the Newsroom:
            How Social Media Affects Traditional-Media
                                  Reporting of Conflicts∗
              Sophie Hatte† Etienne Madinier‡ Ekaterina Zhuravskaya§

                                             May 15, 2021

                                                 Abstract

           Social media changes traditional-media news on conflicts. Online posts by citizen
       journalists—first-hand witnesses of conflict events—change the extent, tonality, and con-
       tent of traditional-media reporting of conflicts. Using an exogenous and excludable vari-
       ation in social-media posts in Israel and Palestine, driven by internet outages as a result
       of lightning strikes and technical failures, we show that, when social media in the conflict
       zone is not muted by internet outages, conflict news stories on US TV are more numerous
       and longer. Text analyses reveal that these stories have higher emotional intensity and
       focus more on the suffering of civilians and less on the role of US foreign policy or elections.
       The results suggest that social-media-driven democratization of the conflict news, i.e., the
       shift of focus from information provided by war gatekeepers to information from ordinary
       people, helps the narrative on the side of the conflict that has more civilian casualties.

   ∗
      We thank Pierre Boyer, Julia Cagé, Ruben Enikolopov, Raphaël Franck, Jeffry Frieden, Matthew Gentzkow,
Irena Grosfeld, Sergei Guriev, Noel Johnson, Mark Koyama, Ro’ee Levy, Maria Petrova, Pia Raffler, Dominic
Rohner, Moses Shayo, David Yanagizawa-Drott, David Yang, Tamar Yerushalmi and the participants of sem-
inars at the Center for Study of Public Choice (GMU), CREST (Ecole Polytechnique), ENS (Lyon), Harvard
University, Hebrew University of Jerusalem, IFO Institute, Paris School of Economics, Stockholm School of
Economics, University of British Columbia, Université de Montpellier, Universitat Manmheim, University of
Sydney, University of Wisconsin-Madison, University of Zurich, CEPR Political Economy Webinar and CEPR
RPN Conferences on preventing conflict for helpful comments. The authors wish to thank the World Wide
Lightning Location Network (http://wwlln.net), a collaboration among over 50 universities and institutions,
for providing the lightning location data used in this paper. We thank Natasa Tagasovska for invaluable help
with collection of Twitter data and Adrien Foutelet for excellent research assistance.
    †
      Sophie Hatte: ENS de Lyon.
    ‡
      Etienne Madinier: Paris School of Economics.
    §
      Ekaterina Zhuravskaya: Paris School of Economics (EHESS).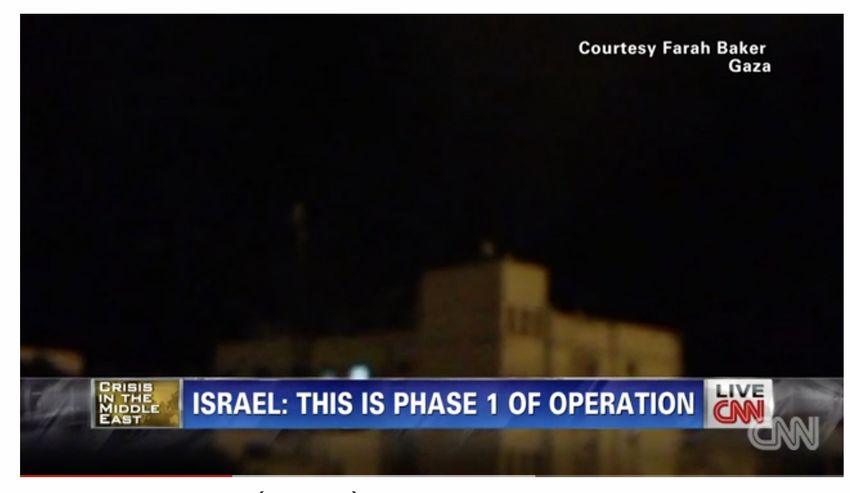
1         Introduction
       In his 2010 Andrew Olle Media Lecture, Alan Rusbridger, then the editor-in-chief of the
Guardian said: “News organisations still break lots of news. But, increasingly, news happens
first on Twitter. If you’re a regular Twitter user, even if you’re in the news business and
have access to wires, the chances are that you’ll check out many rumours of breaking news on
Twitter first. There are millions of human monitors out there who will pick up on the smallest
things and who have the same instincts as the agencies—to be the first with the news. As more
people join, the better it will get.” 1 Rusbridger’s forecast is confirmed a decade later: social
media has become an important tool for professional journalists. A series of annual surveys
of journalists shows that, throughout the last decade, the majority of journalists in developed
countries—including the US, the UK, and Germany—consider social media important for their
work, whereas the share of those who claim that social media does not play any role remain in
single digits (see, e.g., the reports by a media consulting firm Cision, 2011, 2012, 2013, 2016,
2017, 2020).
       There is an agreement among media scholars that journalists from well-established tra-
ditional media outlets extensively use social media, and especially Twitter (e.g., Moon and
Hadley, 2014). In particular, journalists use social media to access news in real time, measure
the demand for news on different topics by what is trending, get feedback on their own work,
and enlarge their audience (see, e.g., von Nordheim et al. (2018), who study the use of social
media by reporters in The New York Times, The Guardian, and Süddeutsche Zeitung, or Lysak
et al. (2012) and Adornato (2016), who analyze a nationwide survey of news directors of local
TV stations in the US).
       Increasingly, journalists and communication scholars point out that social media also
transforms eyewitnesses of newsworthy events into “citizen journalists” (e.g., Patrikarakos, 2017;
Singer and Brooking, 2018; Higgins, 2021). The posts of such citizen journalists on social media
allow traditional journalists, open-source investigators, and the interested public to learn more
details about newsworthy events, compared to what was possible before the emergence of social
media. In particular, reporters get to see these events through the lenses of smartphones of
eyewitnesses and participants of these events, when they cannot witness them first hand. This
implies that citizen journalism could potentially change the perception of traditional-media
reporters of the very events they need to cover. As a result, the way traditional journalists
report the news could also change. Prior literature provides no systematic test of this conjecture
and this paper tries to fill this gap.
       We test whether and how information available on social media affects traditional-media
reporting of conflicts. Our focus is on the conflict news because one should expect social
media to have a more important impact on the traditional-media coverage of those topics, for
which reporting is dangerous, events are unpredictable, and the sites of some of the events are
inaccessible. Conflicts often satisfy all of these criteria (Creech, 2017).
    1
        https://www.theguardian.com/media/2010/nov/19/alan-rusbridger-twitter, accessed March 8, 2021.

                                                       1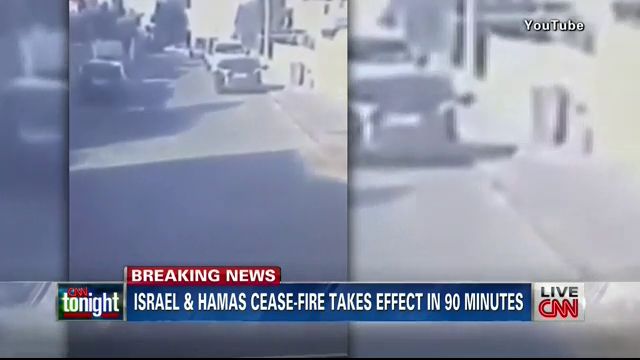
We estimate how the information available on social-media in Israel and Palestine, mea-
sured by the flow of tweets about the Israeli-Palestinian conflict from the conflict zone, affect
news coverage of this conflict by the main US TV channels. For identification, we exploit an
exogenous variation in posting on social media in Israel and Palestine stemming from local
internet outages that occur as a result of technical failures as well as infrastructure damages
caused by lightning strikes. We show that when social media is not muted by internet outages
in the conflict zone, it causes larger conflict coverage on US TV, both in terms of extensive and
intensive margin. More importantly, it also substantially changes the content and the tonality
of conflict coverage. Social-media posts about the conflict from Israel and Palestine make US
TV news about the conflict more emotional, particularly in the presence of Palestinian casu-
alties, and have a significant impact on the topics of conflict-related broadcasts. When social
media is not muted in the conflict zone, the conflict-related news stories on US TV focus more
on portraying the suffering of civilians and less on the role of the US foreign policy or general
political issues in conflict resolution.
A case study (presented in Section 6) illustrates our findings: It is a story of Farah Baker,
a 16-year-old Palestinian girl, who tweeted in English from Gaza during the 2014 Gaza War
(e.g., Patrikarakos, 2017, pp. 21-37). On Twitter, she documented the Israeli bombing raids
that occurred around her home. She both shared her own footage of the attacks and described
her emotions and thoughts. These tweets were noticed by the Western reporters who were
covering the conflict. As a result, media all over the world reported on Farah and used the
content of her Twitter account in their reporting. For example, Appendix Figure A1 shows the
screenshots of CNN’s news program that directly quoted the content posted by Farah Baker
on Twitter.2
We focus on US television news about the Israeli-Palestinian conflict for several reasons:
First, TV remains an important source of news for the American public despite the rise of
social media. According to Pew Research Center, 46% of a representative sample of the US
population preferred getting news from television in 2016; and 44% – in 2018 (Pew Research
Center, 2018). Second, there is a considerable demand for news about the Israeli-Palestinian
conflict in the US that is addressed by the media. For example, in 37% of all days with deadly
attacks during 2009-2016, at least one story about the conflict zone appeared on one of the
main US TV news channels (we describe the data below). Finally, actors on both sides of
the conflict are present on social media and regard this presence as an important part of their
strategy.3
2
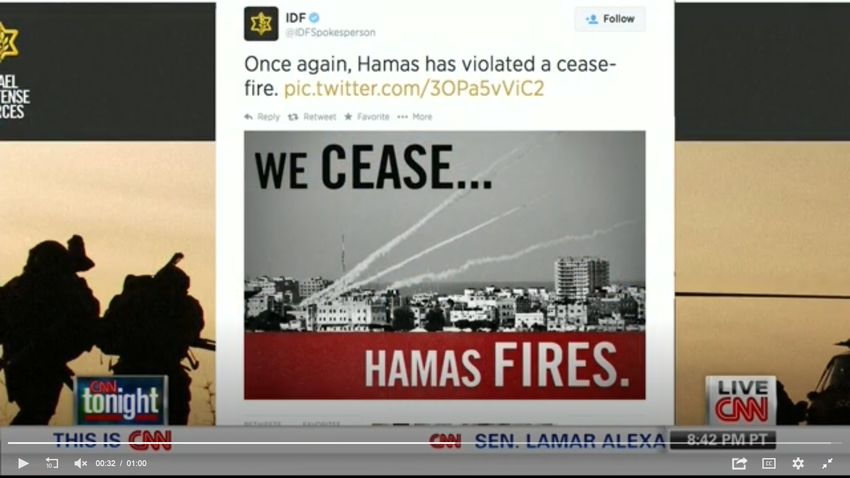
Figure A2 illustrates that US TV also uses tweets by the Israeli Defense Forces (IDF) and footage from
other social media, namely, YouTube, as a source.
3
In his book War In 140 Characters: How Social Media Is Reshaping Conflict In The Twenty-first Century,
British journalist David Patrikarakos provides testimonies of representatives of both the IDF and Hamas with
regard to their strategy of social-media presence (Patrikarakos, 2017). Former IDF international spokesman
Lt. Col. Peter Lerner stated in his interview to Patrikarakos: “If you’re silent on social media, you are not
putting anything in your enemy’s way that prevents their message from gaining steam... And if you are silent
on social media, you’re not getting your own message across; and... not giving your supporters ammunition
to use. My job is to prevent that from happening” (p. 47). Patrikarakos also quotes Hamas spokesperson
2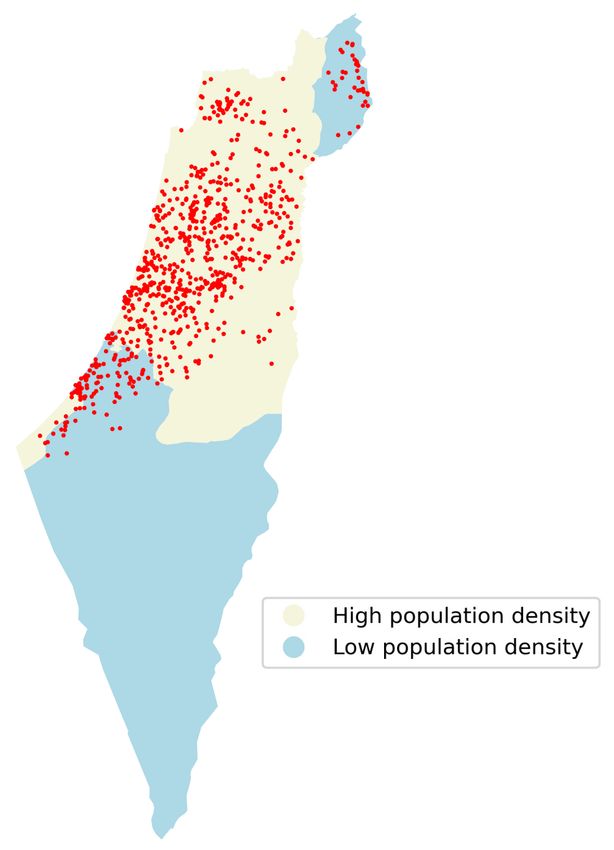
Our empirical analysis combines several data sources. The main outcome variables come
from the web-scraped TV News Archive. We use full transcripts of all news broadcasted by
the following US TV channels: ABC, CBS, CNN, FOX, MSNBC, NBC, PBS, and Bloomberg.
For comparison, we also use transcripts of news by Al Jazeera America, a Qatari TV network
available in the US. Based on these transcripts, for each day and network, we first identify
all news stories about the conflict zone based on stemmed keywords for Israel, Palestin, and
Gaza. And, then, for each such news story, using various text-as-data techniques, we build
measures describing the content of conflict-related news in terms of their emotional intensity
and the topics covered by these news stories, normalized by their length. We, then, aggregate
these measures to build daily series for each TV network of the extent, tonality, and topics of
conflict-related news coverage.
       To build a measure of social-media activity in the conflict zone—our main explana-
tory variable—we web-scraped the population of all tweets with stemmed keywords for Israel,
Palestin, and Gaza. We, then, establish the language of each tweet and train a machine-learning
algorithm to identify whether the topic of each English-language tweet is related to the con-
flict between Israeli and Palestinians. Using the self-reported user profile, we also identify the
location of the user account, i.e., Israel, Palestine, or the rest of the world, and the type of
the account, i.e., ordinary person, media representative, government official, organization, or
business. Then, we construct daily series of the number of conflict-related tweets in English
written by users in Israel and Palestine. We combine these data with daily data on potential
determinants of news coverage of the conflict—fatal casualties on both sides, local weather
conditions in the conflict zone, and the news pressure in the US—and with the main source of
exogenous variation, the measures of local internet outages (described below). The resulting
dataset covers the period from November 2009 to April 2016.
       The key challenge in identifying the effect of social media on traditional-media reporting is
identification: both reverse causality and omitted variables can explain the association between
the content posted on social media and the news by the traditional-media outlets. To address
this endogeneity problem, we use internet outages in the conflict zone as an instrument for
social-media activity. This instrument predicts access of users in the conflict zone to all social
media and other online media platforms. Therefore, we consider our main endogenous explana-
tory variable—tweets from the conflict zone—as an aggregator of all social-media activity in
Israel and Palestine.
       We consider two sources of internet outages: lightning strikes and technical failures. First,
we use the data on the timing and location of all cloud-to-ground lightning strikes in the pop-
ulated areas in Israel and Palestinian territories. Information-and-Communication-Technology
(ICT) experts agree that electrostatic discharges generated by such lightning strikes can dam-
Ihab al-Ghussain who said during the 2014 Gaza War: “it is not just about taking pictures of dead people...
We’re now telling [the story of ] this family, and how they were eating breakfast when they were killed” (p.
84). Similarly, the IDF’s chief of New Media Lt. Sacha Dratwa described his work as follows: “Facebook
and Twitter are the battle fields. It is there that we fight, each and every day" (as quoted by Israeli media,
https://www.israelnationalnews.com/News/News.aspx/145247, accessed March 12, 2021).

                                                      3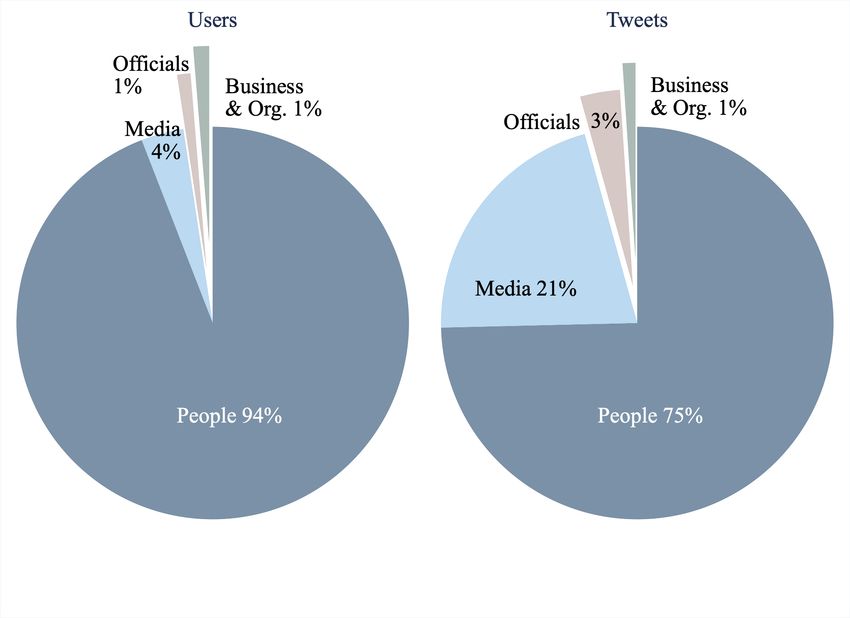
age local ICT infrastructure and reduce user ability to connect to the internet in the absence
of power-surge-protection tools (Zeddam and Day, 2014; Martin, 2016). Second, we rely on
the methodology developed by computer scientists to detect internet outages by monitoring
the traffic between a certain geographical area and the rest of the World Wide Web (WWW)
(Dainotti et al., 2011; Padmanabhan et al., 2019). As there are always some active Internet
Protocol (IP) addresses, many of which are automatic, a sudden decrease in traffic is a sign
of an internet outage, generally caused by a local technical failure. We collected data on the
amount of traffic directed to and from the Israeli and Palestinian Autonomous Systems (i.e., the
collections of local IPs) and identified the timing of each incidence of the collapse in this traf-
fic. Both the incidence of lightning strikes and the absence of traffic significantly and strongly
predict the number of tweets about the conflict (as well as all tweets) from Israel and Palestine,
conditional on the severity of attacks on the two sides of the conflict, seasonality, as well as
other weather shocks, which could potentially affect conflict events, such as the strength of rain
and wind.
      We provide two pieces of evidence in support of the exclusion restriction. First, neither
the lightning strikes nor the incidences of the absence of traffic correlate with the timing or any
observable characteristics of the attacks on either side of the conflict. This suggests that the
timing of internet outages is orthogonal to the newsworthiness of the conflict events. Impor-
tantly, even though Israel has the ability to turn the internet off in Gaza completely, this does
not constitute a threat to our identification strategy for the following reasons. It would bias our
results against finding the effects because it only makes sense to shut down the internet when
some newsworthy events are taking place. Israel is unlikely to do so because a substantially
cheaper way for the authorities to block social media is by jamming the signal in a limited
geographical area or staging a Distributed Denial of Service (DDoS) attack on a particular
internet resource rather than by pooling the plug of local internet connection, neither of which
affect our instrument. Finally, as shown below, our main results are robust to using lightning
as the only exogenous source of variation in social-media access in the conflict zone.
      Second, we show that, while having a strong and significant negative impact on the Twitter
activity of users in Israel and Palestine, internet outages do not have any effect on the news
about Israel and Palestine in all major news wires. Furthermore, there is abundant anecdotal
evidence that news agencies and foreign correspondents, when they report from the conflict
zone, have access to power-surge protection and satellite internet connections making their
connection immune to lightning strikes and collapses in local internet traffic.
      Overall, we conclude that a dummy indicating the days with internet outages, i.e., local
lightning strikes and the absence of visible local internet traffic, is relevant, as it explains the
variation in the number of tweets from the conflict zone, and is excludable, as it is extremely
unlikely that it correlates with the unobservable component of the newsworthiness of the attacks
and with the technology of traditional-news production that does not rely on getting information
through social media. (Below, we discuss the validity of our identification assumptions in
detail.)

                                                 4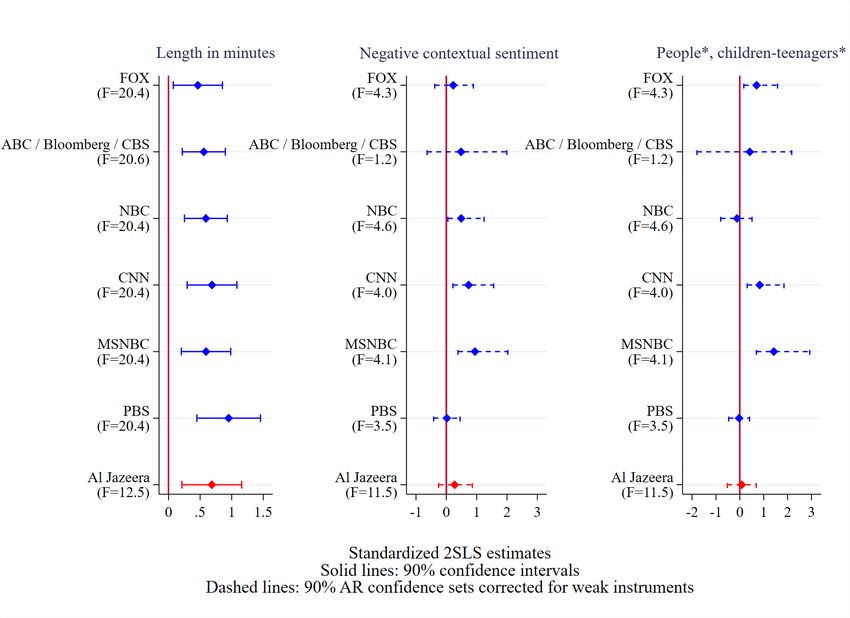
The magnitude of the results is substantial. On average, an internet outage leads to an
18% decrease in the number of tweets from Israel and Palestine about the conflict. Such a
decline in tweets about the conflict causes a 6.5-minute increase in the length of conflict-related
news on an average US TV channel per day. (This is equivalent to a 50.7% rise compared
to the mean length of news about the conflict zone). It also leads to a 2.5-percentage-point
increase in the probability of prime time coverage (25% of the mean). Provided that the US
TV news cover the conflict, the conflict-related stories increase the intensity of the negative
emotions—fear, anger, sadness, and disgust—by 7% of the standard deviation on days when
social media is not muted by the internet outages in the conflict zone, compared to the days
when it is muted. In addition, the mentions of civilians increase by 6% and of children and
teenagers by 17% of their respective means, when there are no outages. Finally, we find that
both Palestinian and Israeli civilians affected by the conflict get more coverage on US TV due
to the social-media activity in the conflict zone. Yet, on average, in any given time period, the
additional TV coverage of conflict due to the absence of internet outages in the conflict zone
is devoted to covering Palestinian civilian victims 7 times more than Israeli victims because
Palestinian side has an order-of-magnitude larger civilian death tall. This result highlights the
democratizing role of social media in conflicts, which gives voice to civilians irrespective of the
military outcomes of the conflict or gatekeepers of official conflict-related information.
       We do not have data that could allow us to test whether information from social media
used by the traditional-media journalists is accurate. False news do circulate widely on social
media (e.g., Allcott and Gentzkow, 2017; Vosoughi et al., 2018); and conflict is a topic for which
some actors have particularly strong incentives to promote misleading narratives (Patrikarakos,
2017; Singer and Brooking, 2018).4 Surveys of traditional-media journalists, who rely on social
media in their work, show that they are concerned with accuracy of the information available
on social media (Cision, 2017, 2020). Thus, whether false information from social media could
reach consumers of news by traditional media depends on the standards of fact checking which
vary across media outlets. As we consider the main national US TV networks, which have in
house fact-checking capabilities, one can be reasonably sure that they can fact-check the social-
media information they use as a source, if they want to do so. Furthermore, local associations
of citizen journalists often help foreign correspondents to verify information available online.5
       It is worth noting that despite the fact that the Israeli-Palestinian conflict is very special,
there is a reason to believe that our results have some external validity because there is abundant
anecdotal evidence of the role of citizen journalists in changing the war narrative in other
   4
      One example comes from a Facebook post by the Palestinian Ministry of Interior in the summer
of 2014 promoting the campaign ‘Be aware’ aimed at raising awareness of Palestinian social-media ac-
tivists. It said (in Arabic): “[1] Anyone killed or martyred is to be called a civilian from Gaza or
Palestine, before we talk about his status in Jihad or his military rank. [2] Do not forget to always
add ‘innocent civilian’ or ‘innocent citizen’ in your description of those killed in Israeli attacks on Gaza,”
(https://www.facebook.com/moigovps/posts/946767052016152, accessed March 12, 2021).
    5
      See, for instance, a story in the Columbia Journalism Review about the Local Coordination Com-
mittees of Syria, an organization uniting citizen journalists in Syrian conflict, Columbia Journalism Re-
view_the_news/straight_news_from_the_citizen.php (accessed March 21, 2021).

                                                      5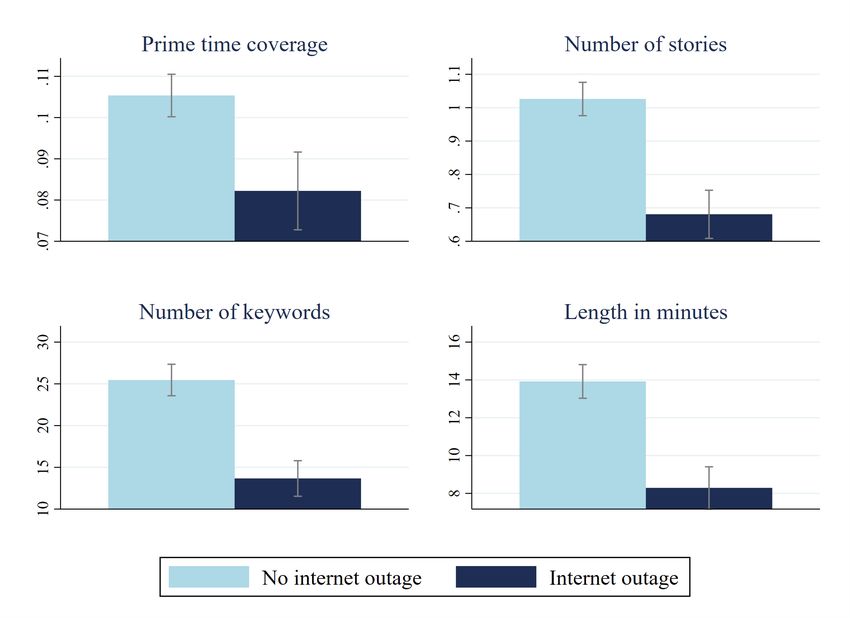
conflicts, such as the Syrian civil war or the war in Ukraine‘s Donbas region.6
      Our paper’s primary contribution is to the bourgeoning literature on the political effects
of social media (see, a recent survey by Zhuravskaya et al., 2020). Much of this literature studies
how social media affects citizens or politicians and has not considered the interplay between
social and mainsteam media.7 There are two important exceptions. Cagé et al. (2020b) study
how the incentives to invest in investigative journalism changed with the arrival of online media
with relatively little legal protection of intellectual property rights. Another recent paper by
Cagé et al. (2020a) aims at estimating a causal effect of social media on the extent of coverage
by traditional media. They show that online editions of French mainstream media cover stories
trending on French Twitter using the population of main-stream French media present online
and a large representative sample of French-language tweets. For identification, they rely on
the structure of the network of Twitter users and news pressure on French Twitter. This paper
does not consider how emotional intensity of traditional-media news or how exactly the content
of these news are affected by social media.8
      Our contribution to this literature is four-fold. First, we focus on news on conflict, which
allows us to go beyond documenting a causal effect of social media on the extent of news
coverage by traditional media. Our paper is the first to shed light on the impact of social
media on the content of traditional news: we document that both the tonality and the focus
of traditional news on conflict are affected by social media. Second, we use a novel instrument
based on local internet outages, which helps to identify the causal nature of the relationship.
Third, in contrast to Cagé et al. (2020a), we use the offline news—the actual TV broadcast—as
the main outcome, which could be distinct from the news posted by traditional-media outlets
online. Fourth, our results about the content of news strongly suggest that social media affects
traditional media reporting not only because it serves as an indicator of the demand for news
on a particular topic, but also because traditional journalists use social media as an actual
source.
      We also contribute to the literature on the role of media in conflicts (see, for instance,
Yanagizawa-Drott, 2014; Adena et al., 2015; Durante and Zhuravskaya, 2018; Gagliarducci et
al., 2020; Armand et al., 2020; Adena et al., 2020). Our contribution is in documenting that
social media helps to level playing field in the information space between the conflict actors,
who have very different military and propaganda capabilities.9
      The rest of the paper is organized as follows. In section 2, we describe data sources and
    6
      See, for instance, http://www.redcross.int/EN/mag/magazine2012_2/4-9_extra_1.html (accessed March
21, 2021) as well as numerous examples in Patrikarakos (2017); Singer and Brooking (2018); Higgins (2021).
    7
      See, for instance, Allcott and Gentzkow (2017); Enikolopov et al. (2020); Levy (2021); Guriev et al. (forth-
coming); Petrova et al. (forthcoming); Müller and Schwarz (forthcoming).
    8
      There is also a large body of research in the field of communications (surveyed in Lewis and Molyneux, 2018)
that studies how traditional media use social media in production and dissemination of news, using surveys of
traditional media outlets (e.g., Lysak et al., 2012; Adornato, 2016; Adornato and Lysak, 2017) or analyzing the
content similarity between traditional and social media (e.g., von Nordheim et al., 2018). These papers provide
important descriptive evidence, but they are not concerned with identification.
    9
      Our paper is also related to fast-growing literature that uses text-as-data techniques to analyze questions
relevant for political economy (see Gentzkow et al., 2019, for a survey of methods with several applications).

                                                        6
the main variables used in the analysis. In Section 3, we present our empirical strategy and
discuss identification assumptions. Section 4 presents the main results, their robustness, and
considers the heterogeneity of the effect across TV networks. In Section 5, we ask which side
of the conflict benefits from the effect of social media on traditional-media reporting of the
conflict. Section 6 illustrates the results with a case study. Section 7 concludes.
2 Data sources and the main variables
In this section, we describe the construction of all our main variables of interest and their
sources. We combine daily data on: the content of US television news; tweets about the conflict
from the conflict zone; attacks on both sides of the conflict; internet outages in the conflict zone,
and weather in the conflict zone. The time span of the merged data set is between November
24, 2009 and April 18, 2016. Summary statistics for all variables used in the main analysis are
presented in Tables A1 to A4 in the Online Appendix.10
2.1 Casualties of the Israeli-Palestinian conflict
We proxy for the newsworthy events of the Israeli-Palestinian conflict by casualties on
each side. Data come from the NGO Israeli Information Center for Human Rights, B’Tselem
(http://www.btselem.org/, accessed March 22, 2020). The dataset contains daily information
on every fatality in the conflict. They include the information on the perpetrator’s side (Israeli
or Palestinian) and some basic characteristics of the victims, such as citizenship, gender, age,
whether the victim is a civilian or has an official affiliation. We also collected information on
the exact hour of the attacks for the period between 2013 to 2016. Panel A of Figure A3 in the
Online Appendix presents the number of total casualties on a timeline and provides names of
particularly deadly campaigns.
2.2 US TV coverage of the Israeli-Palestinian conflict
To construct our main outcome variables, describing whether and how US TV covers the
Israeli-Palestinian conflict, we rely on the US Television News Archive, which is a part of the
Internet Archive (https://archive.org/details/tv/, accessed March 12, 2021). We focus on the
following US TV networks: ABC, CBS, CNN, FOX, MSNBC, NBC, PBS, and Bloomberg, and
of Al Jazeera America, a Qatari network, available in the US. The data are available starting
July 2, 2009 for all networks, with the exception of Bloomberg, for which the starting date is
December 5, 2013, and Al Jazeera, for which the data are available between August 20, 2013
and April 12, 2016. We web-scraped the full transcripts of all news shows broadcasted by these
networks with the following tags defined by the archive: “east jerusalem,” “gaza,” “gaza city,”
“gaza strip,” “hamas,” “hebron,” “hezbollah,” “israel,” “jersualem,” “palestine,” “palestinians,”
10
Table A1 summarizes variables of interest across all days. Across US TV networks and days, Table A2
summarizes those variables that are defined for all days and networks. Tables A3 and A4 provide summary
statistics across US TV networks and days for the variables that describe the content of conflict-related news;
they are defined only for days and networks with at least one conflict-related story.
7“westbank.” We then used these transcripts to identify stories about the conflict zone and
built measures of the extent of conflict-zone coverage, its emotional intensity, and topics. We
describe the construction of these variables below.
The extent of conflict-zone coverage.—For each network, we define news stories
about the conflict zone as segments of the transcript, in which the (stemmed) keywords for the
two sides of the conflict: “Israel” and “Palestin” or “Israel” and “Gaza” are mentioned several
times within a segment. To be precise, we first identify all news segments, i.e., contiguous news,
in which these keywords are mentioned within a maximum of three minutes from each other.11
As a baseline, we define a story about the conflict zone as the news segment which mentions
the actors in the conflict zone at least five times. The results are robust to using any news
segment that mentions “Israel” and “Palestin” or “Israel” and “Gaza” at least once as a news
story about the conflict zone (as described in the robustness section below). With the baseline
definition, there are 22,749 TV news stories about the conflict zone on US TV news in our data
and another 5,180 news stories on Al Jazeera.
To measure the extent of coverage of the conflict zone for each TV network and each day,
we construct several variables, based on this definition of a news story about the conflict: a
dummy indicating whether a network ran a story about the conflict zone during the prime-time
news; the total length of conflict-zone-related news (in minutes); the number of news stories
about the conflict. We also count the number of times each network mentioned keywords from
the conflict zone. This variable does not depend on the definition of the story about the conflict
zone.
On average, there is a 24.6% probability that there is at least one story about the conflict
zone on any of the networks. Online Appendix Table A5 summarizes the probability and the
length of coverage by TV network. Among the US TV networks, PBS and Fox News cover the
stories about the conflict zone the most. The unconditional probability that a story about the
conflict zone appears on these networks on an average day is about 40%. In contrast, ABC
news run a story about the conflict zone on 10% of days. All US networks cover the conflict
less than Al Jazeera America, for which the mean frequency of conflict-zone coverage is 67%.
Figure A4 in the Online Appendix illustrates that US coverage of the conflict zone is affected
by conflict events: there is a substantially higher probability of coverage on days with fatal
casualties compared to days without fatal casualties.
In the robustness section, we establish the robustness of our results on the extent of
coverage using an alternative data source, the Vanderbilt Television News Archive
(https://tvnews.vanderbilt.edu/, accessed March 12, 2021). It contains only short summaries
of only evening TV news for only four TV channels, ABC, CBS, CNN, and NBC.
The emotional intensity of conflict-zone coverage.—To study how US TV covers
the conflict, we measure the emotional intensity of conflict-zone-related broadcast for each day
and TV network. We rely on the NRC Emotion Lexicon which assigns each English word
11
In order to make sure that we capture the full news story, we add a margin of one minute before the first
keyword and three minutes after the last keyword.
8among 6,000 words a score between 0 and 1 for each of the following basic emotions: anger,
fear, sadness, disgust, joy, trust, anticipation, and surprise (Mohammad, 2018). The scores
are derived from the human rankings of associations between words and emotions. For each
conflict-zone-related news story and each emotion, we simply sum the emotion scores of all
stemmed words, attributing zero to the words that are not in the Lexicon, divide by the total
number of words, and multiply by one hundred. This procedure yields the first-approximation
measures of the emotional intensity of each news story. To construct more nuanced measures,
we also apply the Contextual Sentiment Analysis methodology developed by Hutto and Gilbert
(2014) that takes into account degree modifiers, contrasting sentences, and negations.12 This
methodology yields two measures for each conflict-zone-related news story: positive contextual
sentiment and negative contextual sentiment.
We, then, aggregate the indices of emotions and of contextual sentiments to get scores for
each day and TV network, taking the maximum across all conflict-zone-related news stories for
each network each day (when there was at least one story about the conflict zone). We take the
maximum across all news stories per network per day in order to maximize the variation in the
resulting measure of emotions. This is because the format of some news segments does not leave
any room for emotional expression. We use the scores of emotions for each individual emotion
and take means by network and day for all negative, all positive, and all neutral emotions. All
these measures are between 0 and 100.
The topics of conflict-zone coverage.—To describe what exactly the US TV news
stories talk about when they cover news from Israel and Palestine, we take two alternative
approaches. First, we count how many times certain keywords appear in a news segment about
the conflict zone, divide it by the total number of words in this news segment, and multiply by
100. To reduce the importance of influential observations, we winsorize each measure at the
99th percentile of its distribution. We search for keywords on topics that range from stories
about civilian casualties to the involvement of US foreign policy officials in conflict resolution.
The list of topics and of the corresponding keywords for each topic are presented in Online
Appendix Table A6. This approach fully rests on our own choice of keywords and topics.
As an alternative, to identify topics covered by news stories about conflict, we employ an
automated and unsupervised machine-learning topic-detection algorithm, the Latent Dirichlet
Allocation (LDA) model (Blei et al., 2003). As a baseline, we consider 25 topics and set the
other hyper-parameters at: 0.1 for the mixture of topics within a news segment and 0.5 for
the mixture of topics per word. The results are similar with 50 topics and they are not very
sensitive to the choice of other two hyper-parameters, for which we chose the baseline values
to minimize perplexity which is equivalent to maximizing the log-likelihood per word in the
12
In contrast to a naive approach of summing up the emotional scores of each word for different types of
emotions, this methodology takes the context in which the words are used into account. Consider, for instance,
the following two sentences: “I am very happy” and “I am not happy,” both of which have the same length and
contain a single word with a non-zero emotional score “happy.” The Contextual Sentiment Analysis differentiates
between the sign and the intensity of emotions in these sentences, whereas the simple sum of the emotional
scores does not.
9model.
To describe the content of conflict-zone-related broadcasts further, we identify whether
they mention small concrete geographical locations in Israel and in Palestinian Territories.13
We also collect data on whether the conflict-zone-related news mention social media in general
or Twitter, Facebook, YouTube, in particular.
We also build measures of similarity of conflict-zone-related stories shown by different US
TV networks on the same day. And we measure how similar are the US TV news stories to Al
Jazeera’s same-day stories. To compare a US network to Al Jazeera, for each day when both
networks have a conflict-related broadcast, we build a vector of zeros and ones in a space where
each word is a dimension. We assign the value of zero if a particular word is not used by the
other network and 1 if it is used. The similarity between the two networks, then, is defined as
the cosine similarity, which is the scalar product of the two vectors divided by the product of
their norm. This similarity measure is between 0 and 1. It is equal to 0 if there are no words
in common, and 1 if the compared broadcasts use exactly the same set of words. The measure
does not depend on the length of the broadcasts. To measure the similarity of a conflict story
on a particular US network to conflict stories of all other US networks, we build an average
vector for all other networks by taking a share of networks where a particular word was used.
Then, as above, we calculate the cosine similarity between the vector for a particular network
and the average vector for the other networks.
2.3 Twitting from the conflict zone
We web-scraped all original tweets (without retweets) with stemmed keywords Israel,
Palestin, and Gaza from the beginning of Twitter to April 18, 2016. We stoped in April
2016 because Twitter changed the rules precluding us from scraping more data. We scrapped
Twitter when it was still feasible to access all tweets containing a given keyword, not going
through the API. Altogether, there were 48,286,580 tweets with these keywords. Then, we
identified the language of each tweet. 35,427,682 of these tweets, i.e., 73%, are in English,
which is not surprising as we collected tweets with keywords in English. English-language
tweets were written by 5,494,449 different Twitter accounts. We use self-reported information
available on user profile to classify accounts into ordinary people, media, officials, businesses,
and organizations.
We also use the self-reported user profiles to establish the geolocation of the accounts by
matching the reported location to an entry in the GeoNames dataset
(https://www.geonames.org/, accessed March 22, 2021).14 Using this procedure, we identified
the location of accounts for 59% of all English-language tweets with keywords. 14% of them
13
We use the list of all locations in Israel and Palestinian Territories provided by the GeoNames dataset
(https://www.geonames.org/, accessed March 22, 2021) and exclude from this list the following big geographic
locations: Bethlehem, East Jerusalem, Israel, Jerusalem, Gaza (strip), Old City, Palestine, Ramallah, Tel-Aviv,
and West Bank.
14
In cases, when the account specified several locations, we matched the user to the location with the largest
population.
10come from the conflict zone: 1,798,851 tweets from Israel and 1,162,494 tweets from Palestine.
Then, for every tweet among all English-language tweets with keywords, we identify
whether it is about the Israeli-Palestinian conflict or not. To do this, we follow a bag-of-
words approach and train a Naive-Bayes classifier. To fit the model, we use a set of 5,000
manually labeled tweets, such that 4,000 tweets are used as a training sample and 1,000 tweets
as a test sample. 80% of all English-language tweets with keywords from Palestinian accounts
are about the conflict, whereas only 47% of English tweets with keywords from Israeli accounts
are conflict-related.15 In some cases, whether a tweet is related to the conflict or not could
be ambiguous, so that even humans may not perfectly agree on binary classification. This is
why we asked a research assistant to act as an alternative “classifier,” i.e., to perform a second
independent manual labeling of the training set. Table A7 in the Online Appendix presents
various statistics comparing the performance of the algorithm to the performance of the re-
search assistant. We find that the algorithm performs almost as well as a human in classifying
tweets.
Panel B of Figure A3 in the Online Appendix presents the number of conflict-related
tweets from Israel and Palestine over time. The figure illustrates the fact that tweeting about
the conflict intensifies during important conflict events. Figure A5 in the Online Appendix
presents the composition of Twitter accounts and conflict-related tweets by the type, language,
and location of users.
2.4 Internet outages
For identification, we use two datasets that allow us to measure internet outages in the
conflict zone driven by lightning strikes and technical failures.
Lightning strikes.—The data on lightning strikes come from the World Wide Lightning
Location Network (WWLLN) dataset.16 This dataset provides the exact coordinates and time of
the cloud-to-ground lightning strikes across the globe. We build a time-series dummy indicator
for whether any lightning strike occurred in Israel or the Palestinian Territories, excluding
deserts, i.e., areas, where the population density is very low.17 Over our observation period,
thunderstorms occurred on average in 14% of days. Note that there is a large spatial correlation
in thunderstorms. As a result, we cannot rely on spatial variation in the lightning strikes and
use only overtime variation because the territory of the conflict zone is relatively small. To
illustrate this, Panel A of Figure A6 in the Online Appendix presents the map of the locations
of each lightning strike on the Israeli and Palestinian territories during a stormy day, November
16, 2014. As shown on the map, when a storm occurs, it can affect a large part of the conflict
zone. The map also indicates the areas in and outside deserts. As thunderstorms are highly
seasonal—85% of all lightning strikes occur between October and March—in all specifications,
we include calendar-month fixed effects. To illustrate the seasonality of the lightning strikes
15
Among all tweets, 60% are about the conflict.
16
This dataset is collected by the University of Washington and is available under a license agreement from
http://wwlln.net (accessed March 12, 2021).
17
We define deserts as subdistricts with a population density lower than 250 people per square kilometer.
11across calendar months Panel B of Figure A6 presents the graph of the number of daily lightning
strikes by calendar month.
Internet Outage Detection and Analysis.—To measure internet outages that stem
from technical failures, we use the Internet Outage Detection and Analysis (IODA) methodol-
ogy, developed by computer scientists of the Center for Applied Internet Data Analysis (Dainotti
et al., 2011; Padmanabhan et al., 2019). This methodology is based on detecting a sudden drop
in internet traffic (called “BGP Prefix count”) between a certain geographical area (called “au-
tonomous system”) and the rest of the World Wide Web (WWW).18 Without an internet outage,
there is sizable visible traffic at all times because there are always some active IP addresses,
many of which are automatic. A sudden decrease in the traffic (a fall in the number of visible
BGP prefixes) is a sign of a technical failure leading to an internet outage. We collected time-
series data on the traffic between autonomous systems in Israel and Palestine and the WWW.
These data come from: https://ioda.caida.org/ (accessed March 12, 2021). They are available
starting in 2013. We summed the visible prefixes at date level for all main autonomous sys-
tems, i.e., local internet providers: Partner, Bezeq, Cellcom, Paltel, Hadara, Watanyia, Jawwal.
We identified the list of the autonomous systems and their corresponding Autonomous Sys-
tems Numbers (ASN) using data available at: https://bgpview.io/reports/countries/PS and
https://bgpview.io/reports/countries/IL (accessed March 12, 2021). Online appendix Figure
A7 presents the time series of the local internet traffic on a timeline and its distribution across
days. We define a dummy for the absence of (visible) traffic to be equal to the bottom 10% of
the distribution. As presented in Panel B of Figure A7, this corresponds to a natural break in
the distribution.
We have verified the general claim of IODA creators (Dainotti et al., 2011; Padmanabhan
et al., 2019) that the sudden fall in the internet traffic does not reflect the demand-driven
differences in the internet use in application to our context. In Table A8 in the Online Appendix,
we show that BGP prefix count is not lower on weekends (compared to weekdays) and at
nighttime (compared to daytime), whereas the Twitter activity in the conflict zone is, as one
would expect.
The incidents of the absence of (visible) traffic are distinct from power outages because,
in any autonomous systems, including those in Israel and Palestine, many active IP addresses
are powered by independent generators, and therefore, do not rely on electricity supply. For
instance, the collapse of the internet traffic is relatively rare in the Gaza Strip in contrast
to power outages, which occur very frequently in Gaza. It is well known that Gazans are
accustomed to using power generators.
18
Autonomous system (AS) is a collection of IP addresses with a predefined routing policy, i.e., how data
transit between different nodes of the network. Each AS is typically controlled by one or several Internet Service
Providers and it corresponds to a certain geographical area. Different ASs may cover overlapping geographical
areas. The BGP protocol is used to communicate between ASs. BGP Prefix is the first part of the IP address,
which indicates in which AS the IP is located. Thus, observing the BGP Prefix count allows one to see if a
given AS is able to communicate with the rest of the Internet network.
122.5 Additional data
Weather.—We also use daily data on rain, wind, and temperature in the conflict zone.
The data come from the Israel Meteorological Service Weather Data.19 The data are provided
hourly at 1×1km-resolution. We aggregate them at the day level weighting by the population
density of the grid cells to only account of weather in places where people actually live.20 The
rain data measure precipitation in mm, temperature is expressed in celsius degrees, and wind
speed in meters per second.
News Wires.—We use all news wires about the conflict zone issued by three major
News agencies: Reuters, Associated Press (AP), Agence France Presse (AFP). We collect these
newswires from the Factiva database available under subscription at:
https://professional.dowjones.com/factiva/ (accessed May 19, 2020). We look for the same
stemmed keywords: Israel, Palestin, and Gaza, and for each retrieved news wire we collect the
date and time. These data start on September 1, 2012.
News Pressure.—We use the methodology of Durante and Zhuravskaya (2018) and the
Vanderbilt Television News Archive to compute news pressure (Eisensee and Stromberg, 2007)
on US TV net of news about the conflict zone. This variable equals to the time devoted to top
three non-conflict-related stories daily during prime-time news on ABC, CBS, and NBC and
measures the importance of newsworthy events that potentially could crowd out news about
the conflict zone on US TV.
3 Empirical strategy
We aim at establishing a causal relationship from social media—and other information
available online—to traditional media reporting of conflicts.
3.1 Regression equation
As a proxy for the information available on social media and other online resources about
the conflict, we use the daily number of tweets about the conflict from the conflict zone. In
particular, we want to causally estimate the following relationship:
US 0
T Vn,d = α0 log(T weetsCON
d
F
)+α1 log(DeathsIL PS
d +1)+α2 log(Deathsd +1)+Xd γ+δn +εn,d , (1)
US
where n indexes TV networks, d indexes days. T Vn,d stands for different aspects of US TV
news coverage of Israeli-Palestinian conflict: the extent of coverage, the emotional intensity of
coverage, the topics, and other measures describing the content of conflict-zone-related news in
day d by network n. T weetsCON d
F
stands for the daily number of tweets about the conflict from
the conflict zone, i.e., Israel and Palestinian Territories. This is our main explanatory variable.
19
http://www.iacdc.tau.ac.il/what-is-space-weather/, accessed February 7, 2020.
20
The population density data come from the NASA Socioeconomic Data and Applications Center
(https://sedac.ciesin.columbia.edu/data/set/gpw-v4-population-density-rev11, accessed May 10, 2021).
13It is endogenous and below we describe our instrumentation strategy. Note that the number of
daily tweets is above zero for all days in the sample.
DeathsILd and Deathsd
PS
are the daily numbers of fatal casualties on the Israeli (IL) and
Palestinian (PS) side of the conflict, respectively. We add 1 to the number of casualties before
taking the log because on 84% of days there are no fatalities.21 As presented in Panel A of
Figure A3, during our observation period, two weeks of the most intense fighting during the
Gaza War—shaded on the figure—constitute an important outlier in the number of casualties.
These two weeks account for over one-half of all fatal casualties during our observation period.
To reduce the weight of these very influential observations in the control for the log casualties,
as a baseline, we exclude these two weeks from the sample. To make sure that the results are
not driven by this sample restriction, below in the robustness section, we show the robustness
of our results to: (i) using the full sample, (ii) winsorizing the number of Israeli and Palestinian
casualties at the 99th percentile of their respective distributions and controlling for a dummy
indicating days on which the number of casualties was winsorized, (iii) excluding from the
sample other episodes of the most intense fighting defined as having at least 15 fatalities in a
single day; this restriction excludes additional 23 days (1% of the baseline sample).22
δn is the TV network fixed effect. Xd is a vector of additional controls. To control for
the seasonality, climate change, and the growth of social media penetration, it includes year,
month-of-year, day-of-the-week fixed effects. To control for previous conflict events, we control
for the log numbers of Israeli and Palestinian casualties (+1) in the last month, i.e., during
the time period between t − 28 and t − 1. To account for ex-ante probability of US news to
cover the Israeli-Palestinian conflict, we control for the non-conflict-related news pressure. We
also control for the strength of the rain and wind in the conflict zone, which could affect both
the conflict attacks and the instrument’s effectiveness in predicting social-media activity (as
discussed below). To focus on the Israeli-Palestinian conflict, we also control for a dummy
indicating the days when Israel is involved in other armed conflicts, such as the Israel-Lebanon
border clashes on August 3, 2010 and on December 15 and 16, 2013 and numerous clashes on
the Golan Heights, commonly known as “incidents” on Israel-Syria ceasefire line. εn,d denotes
the error term. As a baseline, we adjust standard errors for clusters at day level. We also report
robustness to various alternative assumptions about the variance-covariance matrix.
3.2 Identification
Equation 1 cannot be estimated with OLS because the social-media activity in the conflict
zone, measured by T weetsCON
d
F
, is endogenous to the US TV coverage of the conflict due both
to omitted variables and reverse causality. Unobservable newsworthiness of attacks may drive
tweeting by Israelis and Palestinians as well as coverage by US television. Other important
events may crowd out both the social media posts about the conflict in the conflict zone and
21
As shown in the robustness section below, our results are completely unaffected if, instead, we use an inverse
hyperbolic sine transformation.
22
There are 50 days with Israeli casualties and 350 days with Palestinian casualties in the baseline sample.
14its TV coverage in the US. Third, the content available on US TV may trigger activity in social
media in Israel and Palestine.
To address these endogeneity problems, we use two sources of exogenous variation: light-
ning strikes and technical failures leading to internet outages. First, in the absence of power-
surge protection tools, lightning strikes may significantly reduce the user‘s ability to connect
to the internet. The reason for this is that electrostatic discharges that occur at the moment
of a lightning strike cause power surge that damage internet infrastructure, causing outages.23
The frequency of thunderstorms depends on the season, as illustrated in Panel B of Figure
A6. To account for this, we control for dummies for each calendar month. Furthermore, the
effect of lightning strikes on ICT infrastructure depends on local weather (Schulman and Spring,
2011), thus, we control for the strength of local rain and wind and establish the robustness of
the results to controlling for the temperature (in the robustness section), which, unlike the rain
and wind, does not affect the strength of the first stage. We also control for the calendar year
fixed effects to account—among other potential confounding factors—for the climate change,
which accelerated during our observation period.
Second, internet outages take place not only because of physical damage of infrastructure
but also due to technical (for instance, programming) failures that lead to a temporary fall in
connectivity between a certain geographical area and servers located outside it. As we described
above in Section 2.4, we use the methodology developed by computer scientists to detect days
when internet users in Israel and Palestine cannot connect to the rest of the World Wide Web.
3.2.1 Instrument’s relevance
As the baseline instrument, we use a dummy indicating the incidence of internet outages,
which is a union of days with lightning strikes and with the absence of traffic. The dummy for
the absence of traffic is defined only for a subset of our observation period, namely, starting in
2013. Year dummies control for whether the absence of traffic is taken into consideration by
our measure of internet outages. In the robustness section, we show the results using lightning
strikes as the only source of internet outages.
Both the indicator of lightning strikes and the incidents of the absence of internet traffic
are strong and significant predictors of social-media activity in the conflict zone, and so is the
union of the two that we refer to as the internet outages. Table 1 reports the results of the
first stage at a daily level. Panel A uses the internet outage dummy as the instrument; Panels
B and C use the dummies for lightning strikes and for the absence of traffic, separately. In all
other respects, the three panels use the same specification. The dependent variable in the first
two columns is the log of all daily tweets from the conflict zone; and in the last two columns, we
23
There is a consensus among ICT specialists that lightning strikes damage ICT equipment reducing con-
nectivity (Zeddam and Day, 2014; Martin, 2016). In economic research, this fact was used by Manacorda and
Tesei (2020) and Guriev et al. (forthcoming), who predict the variation in the speed of rollout of new mobile
ICT technologies with cross-sectional variation in the frequency of lightning strikes. The rationale behind this
instrument is that infrastructure investments are costlier in places where equipment is frequently damaged.
15You can also read