Destination shapes antibiotic resistance gene acquisitions, abundance increases, and diversity changes in Dutch travelers - Genome Medicine
←
→
Page content transcription
If your browser does not render page correctly, please read the page content below
D’Souza et al. Genome Medicine      (2021) 13:79
https://doi.org/10.1186/s13073-021-00893-z

 RESEARCH                                                                                                                                            Open Access

Destination shapes antibiotic resistance
gene acquisitions, abundance increases,
and diversity changes in Dutch travelers
Alaric W. D’Souza1† , Manish Boolchandani1† , Sanket Patel1,2, Gianluca Galazzo3 , Jarne M. van Hattem4 ,
Maris S. Arcilla5, Damian C. Melles5, Menno D. de Jong4 , Constance Schultsz4,6 , COMBAT Consortium,
Gautam Dantas1,2,7,8* and John Penders3,9*

  Abstract
  Background: Antimicrobial-resistant bacteria and their antimicrobial resistance (AMR) genes can spread by
  hitchhiking in human guts. International travel can exacerbate this public health threat when travelers acquire AMR
  genes endemic to their destinations and bring them back to their home countries. Prior studies have demonstrated
  travel-related acquisition of specific opportunistic pathogens and AMR genes, but the extent and magnitude of
  travel’s effects on the gut resistome remain largely unknown.
  Methods: Using whole metagenomic shotgun sequencing, functional metagenomics, and Dirichlet multinomial
  mixture models, we investigated the abundance, diversity, function, resistome architecture, and context of AMR
  genes in the fecal microbiomes of 190 Dutch individuals, before and after travel to diverse international locations.
  Results: Travel markedly increased the abundance and α-diversity of AMR genes in the travelers’ gut resistome, and
  we determined that 56 unique AMR genes showed significant acquisition following international travel. These
  acquisition events were biased towards AMR genes with efflux, inactivation, and target replacement resistance
  mechanisms. Travel-induced shaping of the gut resistome had distinct correlations with geographical destination,
  so individuals returning to The Netherlands from the same destination country were more likely to have similar
  resistome features. Finally, we identified and detailed specific acquisition events of high-risk, mobile genetic
  element-associated AMR genes including qnr fluoroquinolone resistance genes, blaCTX-M family extended-spectrum
  β-lactamases, and the plasmid-borne mcr-1 colistin resistance gene.
  (Continued on next page)

* Correspondence: dantas@wustl.edu; j.penders@maastrichtuniversity.nl
†
 Alaric W. D’Souza and Manish Boolchandani contributed equally to this
work.
1
 The Edison Family Center for Genome Sciences and Systems Biology,
Washington University School of Medicine, St. Louis, MO, USA
3
 Department of Medical Microbiology, Care and Public Health Research
Institute (CAPHRI), Maastricht University Medical Center, Maastricht, The
Netherlands
Full list of author information is available at the end of the article

                                         © The Author(s). 2021 Open Access This article is licensed under a Creative Commons Attribution 4.0 International License,
                                         which permits use, sharing, adaptation, distribution and reproduction in any medium or format, as long as you give
                                         appropriate credit to the original author(s) and the source, provide a link to the Creative Commons licence, and indicate if
                                         changes were made. The images or other third party material in this article are included in the article's Creative Commons
                                         licence, unless indicated otherwise in a credit line to the material. If material is not included in the article's Creative Commons
                                         licence and your intended use is not permitted by statutory regulation or exceeds the permitted use, you will need to obtain
                                         permission directly from the copyright holder. To view a copy of this licence, visit http://creativecommons.org/licenses/by/4.0/.
                                         The Creative Commons Public Domain Dedication waiver (http://creativecommons.org/publicdomain/zero/1.0/) applies to the
                                         data made available in this article, unless otherwise stated in a credit line to the data.
D’Souza et al. Genome Medicine    (2021) 13:79                                                                 Page 2 of 21

 (Continued from previous page)
 Conclusions: Our results show that travel shapes the architecture of the human gut resistome and results in AMR
 gene acquisition against a variety of antimicrobial drug classes. These broad acquisitions highlight the putative risks
 that international travel poses to public health by gut resistome perturbation and the global spread of locally
 endemic AMR genes.
 Keywords: Resistome, Antibiotic resistance, Travel, mcr-1, β-Lactamases, ESBL

Background                                                    be influenced by international travel [8, 28]. We can se-
Antimicrobial resistance (AMR) is a major global public       quence all extracted DNA using shotgun metagenomic
health threat with a high mortality cost [1–6]. AMR bac-      sequencing [8, 28, 29], and we can directly identify AMR
terial infections now frequently render antibiotics inef-     genes in these shotgun metagenomes by mapping reads
fective and limit clinicians’ antibiotic treatment options.   to curated AMR gene databases [8, 28]. Though AMR
This trend threatens 70 years of progress in treating bac-    gene databases and identification techniques have made
terial infectious diseases.                                   significant advancements in recent years, they still rely
   AMR is rising worldwide, but there are large geo-          heavily on the traditional microbiological culture that
graphic differences in the prevalence and type of resist-     excludes many bacteria [28]. Functional metagenomics is
ant bacteria and their AMR genes [7, 8]. Low- and             a powerful complementary method to more broadly sur-
middle-income countries generally have higher endemic         vey AMR determinants without relying on culturing re-
AMR than high-income countries, mainly driven by anti-        sistant bacteria [8, 28, 30]. Instead, functional
biotic overuse in humans and animals [6–10]. Inter-           metagenomics uses a cultivable indicator bacterium to
national travel can facilitate the transfer of resistant      identify functional AMR determinants from metage-
bacteria and AMR genes from their endemic regions to          nomic samples via recombinant gene expression and
other locations around the globe [11–18].                     phenotypic selection [30].
   An AMR gene’s ability to spread via international            Here, we combine next-generation sequencing, func-
travel is context-dependent [11, 19, 20]. Context in-         tional metagenomics, and statistical modeling to investi-
cludes the AMR gene’s prevalence in the endemic re-           gate the abundance, diversity, function, context, and
gion, the specific bacteria harboring the AMR gene, and       acquisition of AMR genes in a group of international
the other genetic elements colocalized with the gene.         travelers. Our results demonstrate that international
AMR genes such as extended-spectrum β-lactamases              travel is a significant perturbation to the gut resistome
(ESBLs), qnr, and mcr-1 are often associated with mobile      and reveal destination-specific changes to travelers’
genetic elements like plasmids and are of particularly        resistomes including AMR gene acquisitions against last
high concern due to their ease of spread [8, 11, 21–23].      resort antibiotics and AMR gene colocalization with mo-
   Returning travelers are rarely tested for resistant bac-   bile genetic elements. These findings further our under-
teria or AMR genes unless they manifest clinical symp-        standing of the role of travelers as potential reservoirs
toms, so the magnitude of AMR gene acquisition risk           and spreaders of AMR.
from international travel remains underdetermined.
Using microbial culture, studies have shown significant
acquisition rates of opportunistic pathogens, such as         Methods
ESBL-producing Enterobacteriaceae [16, 18, 24, 25].           Study design, sample collection, and DNA extraction
These studies identified specific pathogenic bacteria ac-     Samples for this project were selected from a subset of
quired during international travel, and several identified    the broader Carriage Of Multiresistant Bacteria After
specific AMR genes acquired during travel [16, 26, 27].       Travel (COMBAT) study [17, 31]. Within this multicen-
But the effect of international travel on AMR is most         ter longitudinal cohort study, travelers were recruited at
likely not limited to opportunistic pathogens such as         the outpatient travel clinics run by the Academic Med-
Escherichia coli or to ESBL-encoding resistance genes. A      ical Center (Amsterdam, The Netherlands), Havenzie-
broader risk assessment must include acquired commen-         kenhuis (Rotterdam, The Netherlands), and Maastricht
sals and their potential horizontal transfer of AMR genes     University Medical Center/Public Health Service South
with host microbiomes.                                        Limburg (Maastricht, The Netherlands). Minors, inca-
   Rapid advancements in sequencing technology, bio-          pacitated subjects, and subjects that traveled abroad for
informatics, and database curation facilitate quantitative    shorter than 1 week or longer than 3 months were ex-
insight into the human microbiome’s role as an AMR            cluded from the study. In total, 2001 travelers were in-
reservoir in a broader context and how this role might        cluded and provided with fecal swab kits that included
                                                              instructions, a modified Carey-Blair transport medium
D’Souza et al. Genome Medicine   (2021) 13:79                                                                   Page 3 of 21

with an associated swab (Fecal Swab®; Copan, Brescia,             Min length = 60
Italy), a questionnaire, and paid postage. Before leaving         Deconseq v0.4.3 was used to remove human read con-
for and immediately after returning from travel, subjects       tamination [36].
took samples from their stool using the fecal swab kits
and mailed them to the lab. The methods for sample              Functional metagenomics
collection are described in detail in Arcilla et al. [31] and   We constructed, sequenced, and analyzed 21 small-
Arcilla et al. [17].                                            insert (>0.7 kb) functional metagenomics libraries which
   For the purpose of the present study, we limited the         were screened for antibiotic resistance with adaptations
selection to travelers to Southeastern Asia, South Asia,        to our previously published protocols [30, 37–44]. The
North Africa, and Eastern Africa to have sufficient num-        experimental protocol for creation and screening of
bers per subregion. Subregions are defined according to         functional metagenomics library is briefly described
the United Nations regional grouping M49 standard               below:
[32]. Travelers were excluded if they visited multiple
subregions or consumed antibiotics in the 3 months be-          Construction of functional metagenomics libraries
fore travel. Selections were made by stratified random          The metagenomic DNA (mgDNA) of 190 post-travel
sampling using SPSS.                                            samples were divided based on four different travel re-
   Metagenomic DNA was extracted from stool samples             gions, and up to ten random samples from each region
using repeated bead-beating (RBB) combined with                 were pooled together for the construction of each func-
column-based purification according to protocol Q               tional metagenomic library (Additional file 1: Fig. S1).
(IHMS_SOP 06 V2 - http://www.microbiome-standards.              The pooled mgDNA was fragmented by partial restric-
org/index.php?id=253) of the International Human                tion digestion using BamHI, BglII, and BstYI (New Eng-
Microbiome Standards consortium [33]. Bead-beating              land Biolabs (NEB)) restriction enzymes. First, 1 μg of
was done using the FastPrep™ Instrument (MP Biomedi-            mgDNA was mixed with 1–5 units of both BamHI and
cals, Santa Ana, CA, USA) with 0.1-mm zirconium-silica          BglII (NEB) in a total volume of 90 μl. The digest was
beads (BioSpec Products, Bartlesville, OK, USA) to              put at 37 °C in an Eppendorf incubator, and aliquots of
homogenize feces. DNA was finally purified by adapting          15 μl were withdrawn after 5, 10, and 15 min and col-
to the QIAamp DNA Stool Mini kit columns (Qiagen,               lected in an Eppendorf tube, containing 270 μl of abso-
Hilden, Germany). A Qubit® fluorometer dsDNA HS                 lute ethanol and 9 μl of 3M sodium acetate (pH=8) on
Assay (Invitrogen) was used to quantify extracted DNA,          ice. After withdrawing the third aliquot, 1–5 units of re-
and this DNA was stored at −20°C.                               striction enzyme BstYI (NEB) was added to the
   Extracted metagenomic DNA was diluted to 0.5 ng/μL           remaining digest. The incubation was continued at 37
and prepared for sequencing with a Nextera DNA Li-              °C, while withdrawing 15 μl every 5 min and pooling
brary Prep Kit (Illumina) using a modified Nextera              with the first aliquots, on ice. The pooled sample was
protocol [34]. Libraries were purified using the Agen-          mixed by vortexing and incubated at −70 °C for 5–10
court AMPure XP system (Beckman Coulter) and quan-              min. The DNA was pelleted by centrifugating for 10 min
tified using the Quant-iT PicoGreen dsDNA assay                 at full speed in an Eppendorf centrifuge and subse-
(Invitrogen). For each sequencing lane, 10 nM of ap-            quently washed once with 200 μl of 80% ethanol. After
proximately 96 samples was pooled three independent             drying, the DNA pellet was dissolved in 50 μl of sterile
times. These pools were quantified using the Qubit®             water.
dsDNA BR Assay and combined in an equimolar fash-                 For size selection and purification of the partially re-
ion. Samples were submitted for 2×150 bp paired-end             striction digested mgDNA, the MagVigen™ DNA select
sequencing on an Illumina NextSeq High-Output plat-             Kit (NVigen Inc.) was used according to the manufac-
form with a target sequencing depth of 5 million reads          turer’s instructions to retain fragments >700 bp. Finally,
per sample.                                                     the sample was eluted in 30 μl of sterile water, and DNA
                                                                concentration was quantified in a Qubit™ fluorometer
Sequence quality filtering                                      (Invitrogen).
Trimmomatic v0.36 [35] was used to trim Nextera                   Vector pZE21-MCS was linearized by digestion with
adapter sequences and to quality filter sequenced reads         restriction enzyme BamHI and dephosphorylated using
with the following parameters:                                  alkaline phosphatase (FastAP Thermosensitive Alkaline
  Adapter = Nextera                                             Phosphatase; Thermo Scientific), according to the manu-
  Illuminaclip = 2:30:10:1:TRUE                                 facturer’s instructions. Ligation was performed using 50
  Leading = 10                                                  ng of linearized, dephosphorylated pZE21-MCS vector
  Traling = 10                                                  and 100–150 ng of fragmented, size-selected insert
  Sliding window =4:15                                          DNA, according to the suppliers’ instructions (DNA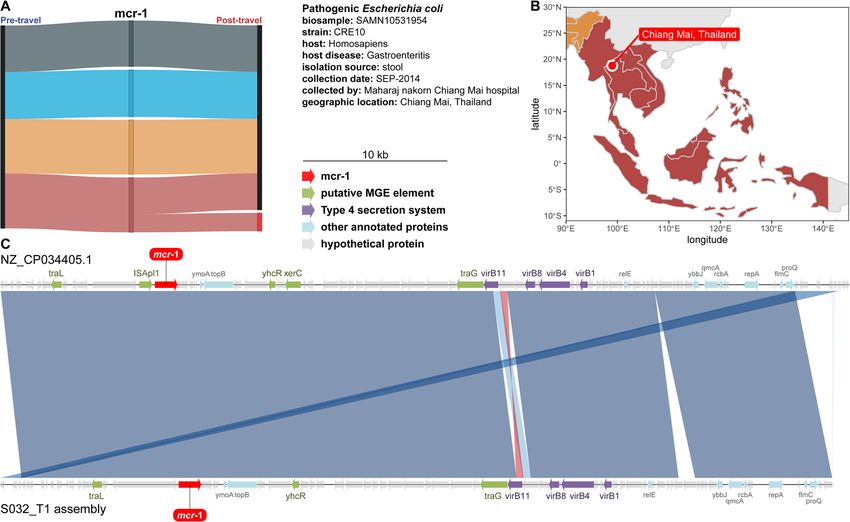
D’Souza et al. Genome Medicine   (2021) 13:79                                                                     Page 4 of 21

ligation kit LONG; TaKaRa). Ligation reaction was per-         Sequencing, assembly, and annotation of antibiotic
formed for at least 3 h at 16 °C.                              resistance genes
   Subsequently, the ligation mixture was precipitated by      The plasmid DNA-containing antibiotic-resistant
adding 5 μl of 3 M sodium acetate pH 8 and 150 μl of           mgDNA fragments were extracted from functionally se-
absolute ethanol. The solution was mixed and incubated         lected clones using the QIAprep Spin Miniprep Kit (Qia-
for 10 min at −70 °C, followed by a spin at full speed for     gen) and prepared for sequencing with a Nextera
10 min in an Eppendorf centrifuge. The resulting DNA           protocol as described above. The samples were submit-
pellet was washed twice with freshly prepared 80% etha-        ted for sequencing using an Illumina NextSeq platform
nol, air-dried, and dissolved in 5 μl sterile water. On ice,   (2×150 bp reads). Reads from each antibiotic selection
25 μl of electrocompetent E. coli cells (E.cloni® 10G;         were assembled into contigs using PARFuMS [37], a tool
Lucigen) was added to the ligated plasmid DNA, and             specifically designed for high-throughput assembly of
electroporation was done according to the supplier’s in-       resistant-conferring DNA fragments from functional se-
structions (1-mm cuvette, 10 μF, 600 Ω, 1800 V). Imme-         lections. Of note, selections were excluded from analysis
diately after transformation, 2 ml of LB medium was            if (i) the number of contigs assembled was 10 times
added to the cells, and the suspension was incubated for       more than the total number of colonies or (ii) more than
1 hat 37 °C in an orbital shaker.                              200 contigs were assembled. Contigs were also filtered
   The library titers were determined by plating 0.1 μl        based on length (> 500 bp).
and 0.01 μl of recovered cells onto Luria-Broth (LB) agar        The total number of contigs obtained was 7020, and in
plates containing 50 μg/ml kanamycin as previously de-         total, 16,334 open reading frames (ORFs) were predicted
scribed [30].                                                  in these contigs using the gene finding algorithm Prod-
   The remainder of recovered cells were grown over-           igal [45]. These ORFs were annotated following a hier-
night in 50 ml of LB broth containing 50 μg/ml kanamy-         archical approach, where the ORFs were first searched
cin (LB-Kan) in a shaker (library amplification).              against BLAST-based ARG databases (CARD [46],
   The culture was then centrifuged and re-suspended in        ResFinder [46], and AMRFinder-Prot [47]) with high
15 ml LB-Kan broth containing 15% glycerol and stored          percent identity (>95%) and coverage (>95%), and then
at −80 °C for subsequent screening.                            the remaining ORFs were annotated using HMM-based
                                                               ARG databases (Resfams [48], AMRFinder-fam [47]).
Functional screening of antibiotic resistance                  This AMR gene annotator (resAnnotator.py) pipeline for
Each metagenomic expression library was screened on            the sequential annotation of ARGs using BLAST and
Mueller-Hinton agar with 50 μg/ml kanamycin and one            HMM approach is available on GitHub. Overall, 1233
of the 15 antibiotics at concentration listed in Additional    complete sequences were assigned using the resAnnota-
file 2: Table S9. Before plating each library on antibiotic-   tor.py pipeline. Percentage identity of 1233 ARGs was
containing growth media, the concentration of each li-         examined via a BlastP query against both the NCBI pro-
brary was adjusted such that 100 μl of library freezer         tein Non-Redundant (NR) database (retrieved 10 January
stock contains at least 10× the total number of unique         2020) and a combined database of all ARG proteins
clones as determined at the time of library creation. To       from CARD, NDARO to identify the top local align-
adjust the concentration, the freezer stock solution was       ment. The best hit identified using BlastP was then used
either diluted with MH-Kan or centrifuged and reconsti-        for a global alignment using the needle program with
tuted again in the appropriate volume for plating. The         the following non-default parameters: -gapopen-10
antibiotic selection plates were incubated for 16–24 h at      -gapextend=0.5. Twenty-two AMR genes did not have
37°C to allow the growth of antibiotic-resistant clones.       any homologs in known AMR sequence databases.
Additionally, for each antibiotic selection, a negative
control plate of E. coli (E.cloni® 10G; Lucigen) trans-        Quantification of antibiotic resistance genes in
formed with unmodified pZE21 (without metagenomics             metagenomes
insert) was plated to ensure that the concentration of         AMR gene relative abundance was quantified using
antibiotic used entirely inhibited the growth of clones        ShortBRED [49] v0.9.4. A ShortBRED marker database
with only pZE21. The surviving colonies from each anti-        was built from 7921 antibiotic resistance proteins that
biotic selection were collected by adding 1500 μl of LB-       were used as a protein of interest for the identification
Kan with 15% glycerol and then gently scraped the col-         of marker families using shortbred_identify.py. Default
onies with an L-shaped spreader from the agar plate.           parameters were used with the exception for -clustid
The slurry of antibiotic-resistant clones was removed          0.95 (see Additional file 1: Supplementary Note A for
from the surface of the plate and then stored at −80 °C        more information on 95% sequence identity clustering).
before sequencing them with the Illumina NextSeq               Uniref90 [50] was the reference masking protein data-
platform.                                                      base (Additional file 1: Fig. S1). These protein sequences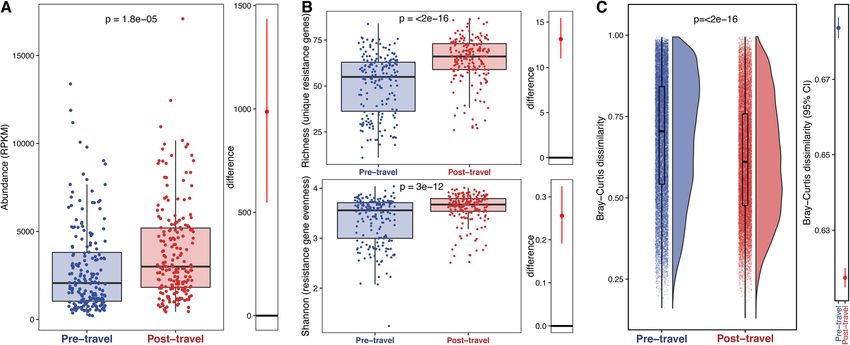
D’Souza et al. Genome Medicine   (2021) 13:79                                                                 Page 5 of 21

include ARG sequences from the Comprehensive Anti-           from stool from a patient with gastroenteritis in 2014 at
biotic Resistance Database (CARD) [46], the NCBI-AMR         Maharaj nakorn Chiang Mai hospital) and our draft gen-
database [47], and antibiotic resistance proteins identi-    ome assembly and for comparisons between our assem-
fied using functional metagenomics in this cohort as well    bled mcr-1 containing plasmid and NCBI Reference
as from previous studies [37–44, 51]. This resulted in a     Sequence NZ_CP034405.1 (a plasmid sequence from the
database consisting of 6585 unique marker sequences          CRE resistant E. coli isolate). The BioSample for this iso-
representing 2331 AMR gene families. These AMR gene          late is SAMN10531954.
families were then manually curated, and the entries
with the following criteria were removed from analysis       MGE element profiling
consideration because they would not be confidently ex-      Annotations with the following keywords were pulled
pected to provide resistance based solely on a short-read    from the functional metagenomic assemblies: transpo-
marker (e.g., when that gene would require other com-        sase, transposon, integrase, integron, conjugative, conju-
ponents to provide phenotypic resistance, or when            gal, recombinase, recombination, mobilization, and
short-read markers would not distinguish between sus-        phage. These elements were counted as putative mobile
ceptible vs resistant versions of an antibiotic target):     genetic elements. The same keywords were used in the
                                                             analysis of putative mobile genetic elements from whole
  1) Genes associated with global gene regulators, two-      metagenome assemblies.
     component system proteins, and signaling media-
     tors (e.g., blaZ, vanS-vanR, mecI, mepR, gadW,          Comparisons to other shotgun metagenomic data
     marR)                                                   The cohort of 110 Indian residents we compared to was
  2) Genes encoding subunits that are part of multiple       published by Dhakan et al. in 2019 [58]. Fecal samples
     efflux pumps (e.g., tolC, oprM, opmD)                   from this cohort were frozen within 30 min of collection
  3) Resistance via mutation in genes (e.g., resistance to   and were subjected to whole metagenome shotgun se-
     antifolate drugs via mutations in dhfr, resistance to   quencing. This cohort was selected because it includes a
     rifamycin via mutation in rpoB)                         wide age range (average age of 29.72 with a standard de-
  4) Genes conferring resistance by modifying cell wall      viation of 17.41) and samples from North-Central and
     charge (e.g., mprF)                                     South India, providing a more complete picture of the
  5) Genes that reduce permeability (omp38, tmrB) or         resistome than studies focusing only a single area or age
     confer resistance through overexpression (e.g.,         range. Additionally, all travelers to South Asia in our
     thymidylate synthase)                                   study visited India, making it the most appropriate com-
  6) General efflux pumps that came through functional       parison country for this study. The data from Dhakan
     selections (MFS-type, ABC-type)                         et al. can be accessed from BioProject PRJNA397112 or
                                                             from [https://doi.org/10.5524/100548].
   The relative abundance of AMR gene families was
quantified by mapping reads to the filtered set of marker    Statistical analysis and data visualization
sequences using shortbred_quantify.py. ShortBRED hits        Statistical analysis was conducted in R [59] version 3.6.2.
were filtered out if they had counts lower than 2 or         Visualizations were made using ggplot2 [60] version
mean reads per kilobase million (RPKM) lower than            3.1.0, ggpubr [61] version 0.2.5, and cowplot [62] version
0.001. The filtered list of markers is given in Additional   1.0.0. Figures 1 and 9b were made using sf [63] version
file 2: Table S8.                                            0.1.8 and spData [64] version 0.3.3 with post-processing
                                                             in Adobe Illustrator [65] version CC 2020 (24.0.2). San-
Metagenome profiling and assembly                            key networks were generated using networkD3 [66] ver-
Microbial taxa relative abundance was calculated using       sion 0.4 with the sankeyNetwork function. Alignment
MetaPhlAn2 [52] (repository tag 2.6.0). Contig assembly      visualization for mcr-1 in Fig. 9c was made using geno-
was done using the de novo assembler SPAdes v3.14.0          PlotR [67]. Dirichlet multinomial mixture models [68]
[53]. Assemblies were annotated using our in-house           were made using DirichletMultinomial [69] version
AMR gene annotator called resAnnotator.py which in-          1.26.0. For each clustering model (all samples together,
cludes CARD [46], Resfinder [54], NCBI-AMR [47], and         only T0 samples, and only T1 samples), we did 50 itera-
Resfams [48]. Assemblies were also annotated with            tions of clustering with different starting seeds. For each
Prokka [55]. The BLAST+ command line tool (blastn)           of these 50 iterations, we started with 1 cluster and
[56] was used to compare the mcr-1 plasmid to our con-       stopped at a maximum of 25 clusters. Laplace approxima-
tig containing mcr-1. FastANI [57] v1.3 was used for         tions were generated for each cluster model, and the clus-
average nucleotide identity comparisons between assem-       ter model with the most evidence by this metric was
bly GCA_004135815.1 (a CRE resistant E. coli isolated        chosen for further analysis (see source data of Figs. 3b and
D’Souza et al. Genome Medicine (2021) 13:79 Page 6 of 21 Fig. 1 Destinations for Dutch travelers. A total of 190 Dutch individuals’ gut microbiomes were sampled before and after traveling (380 total samples) to 4 different subregions (Northern Africa, Eastern Africa, Southern Asia, and Southeastern Asia) 5b for AIC and Laplace approximations for all clustering appropriate. The fisher.test function was for Fisher’s exact models). Samples were grouped with their best-matched comparisons. The binom.test function was for binomial cluster (see source data of Figs. 3b and 5b for cluster tests. The p.adjust function was applied where appropriate matching probability for each sample). Linear mixed- to correct for multiple hypothesis testing with method= effects models were implemented with lme4 [70] version “fdr” (Benjamini-Hochberg [79]). p values lower than ma- 1.1-21 (lmer function). Models were assessed using report chine precision of 2.220446e−16 are reported as p
D’Souza et al. Genome Medicine   (2021) 13:79                                                                  Page 7 of 21

travel). A total of 174 study participants denied using         Linear mixed-effects modeling of AMR gene abun-
antibiotics during the observation period while 10 partic-    dance and α-diversity measured as richness (unique
ipants claimed antibiotic use (6 participants answered        genes) showed that while the two measurements are sig-
unknown). The majority (n=170) were traveling on holi-        nificantly related (p
D’Souza et al. Genome Medicine       (2021) 13:79                                                                                     Page 8 of 21

 Fig. 2 AMR gene abundance and α-diversity increases with travel and AMR gene β-diversity decreases. a The left panel shows the AMR gene
 abundance in RPKM. Each point is a sample, and the boxes are the medians with interquartile ranges for the pre-travel samples in blue and the
 post-travel samples in red. The p value (paired-sample t test) for the comparison is given at the top of the panel. The right panel shows the
 difference between the bootstrapped distributions of the post- and pre-travel samples. The red line gives the 95% confidence interval for the
 difference, and the point gives the estimate. b AMR gene α-diversity is measured by richness (top left panel), and Shannon Index (bottom left
 panel) is compared between the pre-travel (blue) and post-travel (red) samples. Each point corresponds to a given sample, and each box gives
 the median and interquartile range for the distribution. The p value (paired-sample t test) for the comparison is given at the top of each panel.
 The panels to the right of the boxplots show the difference between the bootstrapped distributions of the post- and pre-travel samples. The red
 line gives the 95% confidence interval for the difference and the point gives the estimate. c AMR gene β-diversity measured by Bray-Curtis
 dissimilarity is compared between the pre-travel (blue) and post-travel (red) samples. Each point is a comparison between two samples within
 the same time point group. The distributions are shown to the right of the points, and boxplots showing the median and interquartile ranges are
 overlaid on top of the points. The p value by paired Wilcoxon test for the comparison is shown near the top. In the right panel, the lines show
 the 95% confidence intervals, and points show the mean values for the pre- (blue) and post-travel (red) Bray-Curtis dissimilarity distributions.
 Source data is provided in the source data file (Additional file 3)

to resistome composition. Supervised clustering of our                     the same travel destination makes traveler resistomes
Dutch traveler resistomes also revealed significant separ-                 more similar (Additional file 1: Fig. S5 and Additional
ation (p=2e−4 [permanova]) between the pre-travel and                      file 1: Supplementary Note D). These β-diversity de-
post-travel samples (Additional file 1: Fig. S3A). How-                    creases were significantly larger in travelers returning
ever, the 8 optimal metaresistomes from the Dirichlet                      from Southeastern Asia and Eastern Africa than North-
multinomial mixtures and the differences in the AMR                        ern Africa and Southern Asia (Fig. 4c). Thus, individuals
gene diversity between metaresistomes suggest subclus-                     returning from Southeastern Asia and Eastern Africa
ters exist within the pre-travel and post-travel time                      had more similar AMR profiles to other travelers to the
points.                                                                    same destination than individuals returning from North-
                                                                           ern Africa and Southern Asia.
Destination-specific resistome signatures explain                             To interrogate these region-specific effects, we rebuilt
metaresistome subclustering                                                Dirichlet multinomial mixture models after separating
Though all four destinations had increased AMR gene                        the pre-travel and post-travel samples. Separating the
abundance (Fig. 4a) and α-diversity (Fig. 4b), the magni-                  time points removes possible random effects due to sub-
tude of these differences varied and broadly agree with                    ject identity allowing a narrower focus on destination.
clinical isolate resistance data published by the Center                   This analysis yielded 9 metaresistomes (4 in the pre-
for Disease Dynamics, Economics, and Policy (Add-                          travel samples and 5 in the post-travel samples). Though
itional file 2: Table S5 and Additional file 1: Supplemen-                 the pre-travel metaresistomes did not show significant
tary Note C). Resistome α-diversity was significantly                      bias by destination (p=0.485 [Fisher’s exact test]), the
higher for individuals returning from Southeastern Asia                    post-travel metaresistomes had a strong regional bias
than from the other three destinations (Additional file 1:                 (p
D’Souza et al. Genome Medicine (2021) 13:79 Page 9 of 21 Fig. 3 Travel outweighs subject effects in shaping resistome architecture. a 95% confidence interval (red line segment), odds ratio (red point), and p value calculated by Fisher’s exact test for samples with the same time point being drawn from the same metaresistome. The black vertical line at 1 shows the expected result under the null. b Each row in this plot corresponds to a metaresistome (m1–m8) in a Dirichlet multinomial mixture model of all traveler samples. The pie charts on the left are proportional in size to the number of samples in each metaresistome. The fill of the chart corresponds to the number of individuals in the time point (pre-travel in blue and post-travel in red). The network shows the number of individuals that transition from any model to any other model following their return from abroad. The black lines indicate staying within the same model, and the green lines indicate transition from one model to another model. The thickness and opacity of the lines correspond to the number of people following that transition path. Node label sizes correspond to the number of individuals in the model from the time point. Nodes filled in blue are significantly enriched in pre-travel samples, and nodes in red are significantly enriched in post-travel samples. The right panel shows the estimates (points) and 95% confidence intervals (lines) for binomial tests of bias for pre- or post-travel samples. p values for the comparison (FDR-corrected binomial test) are given above the lines. The expected estimate under the null model is given by the dark black line at 0.5. Source data for all panels is provided in the source data file (Additional file 3) travel (p=0.7021 [permanova]). This demonstrates using our ShortBRED AMR protein marker database, we that individuals traveling to the same destination are found that the Dutch subjects returning from Southern far more likely to have their post-travel samples clus- Asia (which includes India) had resistomes that were ter in the same metaresistome than their pre-travel more similar to the Indian resistomes compared to sub- samples. jects returning from the other three subregions (North- Considering these destination signatures, we wanted to ern Africa p=2.2e−10; Eastern Africa p
D’Souza et al. Genome Medicine       (2021) 13:79   Page 10 of 21

 Fig. 4 (See legend on next page.)
D’Souza et al. Genome Medicine        (2021) 13:79                                                                                       Page 11 of 21

 (See figure on previous page.)
 Fig. 4 Travelers to different destinations cluster separately by resistome composition but show similar trends by abundance and diversity metrics.
 a The bottom panel shows the comparisons of AMR gene abundance before and after travel to the four subregions in this study. Points
 correspond to samples, and boxes give the median and interquartile ranges. Pre-travel is shown in blue, and post-travel is shown in red. The p
 values (FDR-corrected paired Wilcoxon tests) for comparisons within the region between the pre- and post-travel samples are shown above each
 comparison. The top panel shows the difference between the bootstrapped distributions of the post- and pre-travel samples. The red line gives
 the 95% confidence interval for the difference, and the point gives the estimate. b AMR gene α-diversity is measured by richness (left), and
 Shannon Index (right) is compared by region between the pre-travel (blue) and post-travel (red) samples. Each point corresponds to a given
 sample, and each box gives the median and interquartile range for the distribution. The p values (FDR-corrected paired Wilcoxon test) are above
 each comparison. The panels above show the difference between the bootstrapped distributions of the post- and pre-travel samples for each
 destination. The red line gives the 95% confidence interval for the difference, and the point gives the estimate. c The left panel compares the β-
 diversity for pre-travel (blue) and post-travel (red) collections for the four travel destinations. The points are pairwise Bray-Curtis dissimilarity
 between two samples, and the boxes represent the median and interquartile ranges of the distributions. p values (paired Wilcoxon test) are given
 above each comparison. The right panel shows the difference between the bootstrapped dissimilarities of the pre- and post-travel groups. The
 lines give the 95% confidence interval for the difference, and the point gives the estimate. Source data for all panels is provided in the source
 data file (Additional file 3)

finding matches the previous results (Fig. 4c) where in-                     important antibiotics, though we did not observe class A
terindividual resistome β-diversity was lower in subjects                    carbapenemases. This is consistent with the lack of re-
returning from these two destinations. We can see from                       sistant transformants observed against meropenem in
these analyses that the destination-specific effects result                  our functional metagenomic libraries.
in individuals returning from the same destination hav-                         We detected 56 AMR genes with significant evidence
ing similar post-travel resistome states despite diverse                     of acquisition after travel, compared to only 4 showing
pre-travel states.                                                           significant loss following travel (Fig. 6c and Additional
                                                                             file 1: Fig. S8), highlighting the heavy bias of AMR gene
AMR gene abundance increases and acquisitions during                         acquisition in the post-travel samples. AMR genes for
travel are concentrated in several AMR gene families and                     antibiotic efflux (p=2.78e−6 [permutation test]) and
resistance mechanisms                                                        for antibiotic target replacement (p=0.0295 [permuta-
We found a positive correlation between prevalence and                       tion test]) were both highly enriched in the signifi-
abundance (p
D’Souza et al. Genome Medicine (2021) 13:79 Page 12 of 21 Fig. 5 Travelers’ resistomes group significantly by region after travel, and Southeastern Asia and Eastern Africa have the strongest signature. a 95% confidence intervals, odds ratios, and p values for the samples with the same destination being drawn from the same metaresistome. Fisher’s exact tests were done for this comparison within the time point (y-axis). The black vertical line at 1 shows the expected result under the null. Source data for all panels is provided in the source data file (Additional file 3). b The left of this Sankey diagram has models built from the pre-travel samples, and the right has models built from the post-travel samples. Each model has a pie chart that shows the number of samples in the model (total of 190 for each time point), and these pies are divided by destination. The lines connecting the pre- and post-travel models are colored according to region (dark blue is Northern Africa, light blue is Eastern Africa, orange is Southern Asia, and red is Southeastern Asia), and their thickness is proportional to the number of samples that follow that path gene classification level (Additional file 1: Fig. S10-S12) file 1: Supplementary Note F). Travel duration had a and at the detailed single-gene level (Additional file 2: weak but significant effect on AMR gene acquisition Table S6) all showed more AMR determinants associ- when all AMR gene acquisitions were considered to- ated with the post-travel time point. A model with all gether (Additional file 1: Fig. S13). When the 121 AMR metadata included identified time point as a significant genes were considered individually, increased travel dur- predictor of AMR gene abundance for 65 of the 121 ation only significantly correlated with catA, a chloram- AMR genes (Additional file 2: Table S7 and Additional phenicol acetyltransferase (Additional file 2: Table S7).
D’Souza et al. Genome Medicine        (2021) 13:79                                                                                     Page 13 of 21

 Fig. 6 AMR gene abundance changes and acquisitions are unequal across AMR mechanisms. a AMR mechanism abundance is compared
 between pre-travel (blue) and post-travel (red) samples. Each point is a sample, and the boxes represent the median and interquartile range. p
 values (FDR-corrected paired Wilcoxon test) for the comparisons are given near the top of the panel. The top panel shows the difference
 between the bootstrapped distributions of the post- and pre-travel samples. The lines give the 95% confidence interval for the difference, and
 the point gives the estimate. AMR classes where the 95% confidence interval does not cross 0 are red. b AMR class abundance is compared
 between pre-travel (blue) and post-travel (red) samples. Each point is a sample, and the boxes represent the median and interquartile range. p
 values (FDR-corrected paired Wilcoxon test) for the comparisons are given near the top of the panel. The top panel shows the difference
 between the bootstrapped distributions of the post- and pre-travel samples. The lines are the 95% confidence interval for the difference, and the
 point is the estimate. AMR classes where the 95% confidence interval does not cross 0 are red. c AMR gene acquisitions or losses after travel.
 Each point is an AMR gene, and points are filled in according to their AMR mechanism. The x-axis is the number of individuals that had the gene
 in the pre-travel time point, but not in the post-travel time point. The y-axis is the number of individuals that had the gene in the post-travel
 time point, but not in the pre-travel time point. The red-shaded region spans significantly acquired AMR genes, the blue-shaded region spans
 significantly lost AMR genes, and the gray-shaded region spans genes that were not significantly acquired or lost. The diagonal line is the null of
 equal losses and gains for an AMR gene. The inset panel shows which AMR mechanisms were significantly acquired during travel by permutation
 testing. The colored histograms show the expected distribution according to 10,000 permutations, and the black vertical lines show the observed
 value (points in the red-shaded region of the main plot). The z-score and the FDR-corrected p value for the comparison of observations to their
 expected distribution are given in the top left of each plot. Source data for all panels is provided in the source data file (Additional file 3)

Travelers to Southeast Asia had the most AMR gene                           42% of post-travel E. coli isolates had new resistance
acquisition and Southeast Asian functional selections had                   against trimethoprim-sulfamethoxazole [15].
high mobile genetic element burden                                            There was a bias for aminoglycoside resistance gene
Every destination showed significant AMR gene acquisi-                      ant3 to be acquired in Southeastern Asia, and a bias for
tion (Fig. 7a), with travelers to Southeastern Asia having                  the macrolide resistance gene mphA to be acquired in
the highest AMR gene acquisition (0.73 CI [0.71–0.75],                      Southeastern and Southern Asia. tetA was the only AMR
p
D’Souza et al. Genome Medicine        (2021) 13:79                                                                                      Page 14 of 21

 Fig. 7 AMR gene acquisitions and mobile genetic elements differed by travel destination. a Significance of AMR gene acquisitions by travel
 destination. The lines show the 95% confidence intervals, and the points show the estimates of binomial tests for bias. Binomial tests were
 conducted by region for the number of acquired AMR genes and the number of lost AMR genes. Both acquisitions and losses were normalized
 by the number of individuals traveling to the region. p values (FDR-corrected) from this test are shown just below the dotted line at 0.5
 indicating the null. Numbers lower than 0.5 indicate AMR gene loss, and numbers greater than 0.5 indicate AMR gene gain. b Genes that showed
 significant region-specific bias following multinomial testing. Points indicate their number of acquisitions normalized by the number of travel
 subjects, and p values are given in the top left. c Sankey diagram of AMR gene acquisitions by travel region. Black nodes are when the gene was
 not found, and bright red nodes indicate the gene was present. The width of all lines is proportional to the number of individuals following that
 path. d, e The number of MGE elements detected from the functional metagenomic libraries is plotted on the y-axis, and the number of input d
 libraries and e reads is on the x-axis. p values calculated by the FDR-corrected multinomial test are in the bottom left of each panel. Most p
 values in b, d, and e hit underflow and have been set to p
D’Souza et al. Genome Medicine        (2021) 13:79                                                                                       Page 15 of 21

destination-specific resistance gene acquisition and dem-                    acquisition analysis and destination bias analysis for the
onstrate the importance of functional metagenomics                           remaining 10 genes.
data in detecting these differences. This fact is                              Acquisition analysis showed that 6 of the 10 AMR
highlighted for subregion by the contrast between the                        genes that were present in at least 1 sample were signifi-
lack of association with travel destination for MGE an-                      cantly associated with the post-travel time point (Fig.
notation counts across all assemblies (not necessarily                       8a). Notably, mcr-1, a plasmid borne colistin resistance
colocalized with AMR genes) as presented in Additional                       gene, was found only in post-travel samples.
file 1: Fig. S15 and the strong association with travel des-                   Quinolone resistance genes qnrB and qnrS were ac-
tination in Fig. 7d, e showing annotations in the func-                      quired in high proportion following travel to all four
tional selections where the mobile genetic elements are                      subregions (Fig. 8b), but blaCTX-M-1, blaCTX-M-9, and
adjacent to AMR genes. The number of mobile genetic                          mcr-1 had strong region-specific effects (Figs. 8b and
elements adjacent to AMR genes may contribute to the                         9a). Over 80% of blaCTX-M-1 and blaCTX-M-9 β-lactamase
increases in AMR gene burden post-travel.                                    acquisitions were in travelers to Asia. blaCTX-M-1 was
                                                                             predominantly acquired in Southern Asia (61.8%), and
qPCR detected high-risk AMR genes acquired by Dutch                          blaCTX-M-9 was predominantly acquired in Southeastern
travelers                                                                    Asia (82.1%). Uniquely, mcr-1 was only acquired by trav-
Concurrent with our comprehensive metagenomic resis-                         elers to Southeastern Asia (Fig. 9a).
tome analysis, we specifically targeted 16 clinically im-
portant AMR genes in our samples by qPCR. Of these                           Dutch travelers to Southeastern Asia acquired mcr-1
16, four genes (tetM, tetQ, ermB, and mefAE) were                            We also observed that AMR genes in our cohort were
present in all of the samples, and two genes (qnrA and                       often colocalized with mobile genetic elements. mcr-1, a
mcr-2) were not present in any samples. We conducted                         plasmid-borne colistin resistance gene, was one of the

 Fig. 8 Quinolone resistance genes were acquired in regions with equal frequency, while β-lactam resistance genes had destination-specific
 acquisition. a AMR genes acquired or lost after travel detected by qPCR. Each point is an AMR gene. The x-axis is the number of individuals that
 had the gene in the pre-travel time point, but not in the post-travel time point. The y-axis is the number of individuals that had the gene in the
 post-travel time point, but not in the pre-travel time point. Significant acquired AMR genes are in red. The number of significant genes is
 tabulated in the top right. Non-significant genes are in black. The diagonal line is the null of equal losses and gains for an AMR gene. The inset
 panel gives the results from binomial tests of bias for AMR gene acquisition for the post-travel time point. The lines are 95% confidence intervals,
 and the points are estimates. p values (FDR-corrected binomial test) are given at the bottom of the plot for each gene. The dotted line is the
 expected value under the null. The lines and points are red if significantly acquired. b Sankey diagrams of significant gene acquisitions by travel
 region detected by qPCR. Black nodes are when the gene was not found, and bright red nodes indicate the gene was present. Ribbon colors
 correspond to the destination countries (dark blue is Northern Africa, light blue is Eastern Africa, orange is Southern Asia, and red is Southeastern
 Asia). The width of all lines is proportional to the number of individuals following that path. Source data for both panels is provided in the source
 data file (Additional file 3)
D’Souza et al. Genome Medicine (2021) 13:79 Page 16 of 21 Fig. 9 mcr-1 containing contig from a Dutch traveler matched a plasmid sequenced from a gastroenteritis patient in the destination region. a Sankey network showing region-specific acquisition for mcr-1. b Map showing where the reference genome was isolated from a gastroenteritis patient. c Alignment between a plasmid from an E. coli isolated from a gastroenteritis patient in Chiang Mai and a contig assembled from a Dutch traveler’s gut microbiome. Source data for all panels is provided in the source data file (Additional file 3) most concerning genes we detected. Colistin is a drug of (99.9% identity with 100% query coverage) was to a plas- last resort for drug-resistant gram-negative pathogens mid from gastroenteritis-causing E. coli (Fig. 9b) isolated used when other antimicrobial therapies fail [87, 88]. in Chiang Mai, Thailand (data from BioSample SAMN1 mcr-1 is the first plasmid-borne resistance gene against 0531954 and NCBI reference sequence NZ_CP034405.1 colistin, and it is responsible for rapidly increasing colis- ). In both plasmids (Fig. 9c), mcr-1 is flanked by a tra tin resistance observed over the last 4–5 years [20]. cluster of conjugon transfer genes, and mcr-1 is also Eighteen of the 52 Dutch travelers to Southeastern Asia colocalized with a virB cluster type IV secretion system (34.6%) acquired mcr-1 during our study. (T4SS). T4SS have known involvement in horizontal To further investigate the mcr-1 colistin resistance gene transfer [93–97]. There are prior reports of mcr-1 gene, we assembled contigs using the raw shotgun colocalization with T4SS in plasmids [20, 98], though in reads from the samples that were mcr-1 positive by those studies mcr-1 was on different plasmid incompati- qPCR and annotated these contigs for mcr-1. One bility types than IncI2. contig assembled from subject S032, a traveler return- ing from Vietnam, was positive (Fig. 9). Plasmidfinder Discussion 2.0 identified subject S032’s mcr-1 containing contig Global AMR spread threatens decades of success in as an IncI2 type plasmid (100% identity and 100% treating bacterial infections with antibiotics [6, 10, 99– template length using the Enterobacteriaceae data- 101]. This problem is exacerbated by the worldwide base) [89, 90]. A follow-up study [91] of the 6 isolates spread of antibiotic-resistant bacteria and AMR genes by from Arcilla et al. [92] demonstrated that one ESBL- international travelers [8, 102]. Our investigation of 190 producing E. coli from a traveler returning from Dutch individuals’ gut resistomes before and after travel Vietnam also harbored mcr-1 on an IncI2 type indicates international travel is a significant gut resis- plasmid. tome perturbation and highlights the extent of AMR We searched NCBI for the best BLAST match of sub- gene acquisition. We found the acquisition of previously ject S032’s mcr-1 containing contig, and the top hit unknown, functionally discovered AMR genes, increased
D’Souza et al. Genome Medicine   (2021) 13:79                                                                   Page 17 of 21

AMR gene abundance, and increased resistome α-                 dependence we show in our results. There are conflict-
diversity in the post-travel samples. We also observed         ing results if these antibiotic perturbations return to the
AMR gene colocalization with mobile genetic elements           initial state or leave persistent scars [42, 106]. Even if the
and identified travel destination-specific resistome           travel-related resistome changes revert to baseline, it is
signatures.                                                    possible that the AMR genes will be disseminated in the
  A study by Langelier et al. in 2019 reported on the          resident country before they are lost in the host.
resistome in 10 travelers to Asia or Africa [103]. Eight of       The high-risk gene acquisitions we observed are con-
these travelers went to Nepal, one went to Nigeria, and        cordant with qPCR-based research of endemic antibiotic
one went to Uganda. The authors sampled the subjects           resistance in our cohort’s travel destinations. In 2019,
once before travel and thrice after travel; they found in-     Bich et al. demonstrated qnr endemicity in Vietnam with
creased AMR genes against multiple antibiotic classes,         100% carriage of qnr by qPCR of fecal samples from 93
including β-lactams, quinolones, and anti-folates. This        Vietnamese residents of the Ha Nam province [107].
increase in AMR genes after travel mirrors our results,        This same study also found carriage of blaCTX-M-1 (38%)
and many of the AMR genes they identified were also            and blaCTX-M-9 (61%). These results correspond well
detected in our study. Interestingly, in contrast to the re-   with both the high acquisition rate we saw for these
sults in Langelier et al., we saw increases in some tetra-     genes in individuals returning from Southeastern Asia
cycline resistance genes and aminoglycoside resistance         and the blaCTX-M-9 predominance we saw in travelers
genes after travel. For the tetracycline resistance genes,     returning from Southeastern Asia.
this may be explained by our more detailed consider-              Our cohort’s mcr-1 Southeast Asian geographic acqui-
ation of the resistance mechanism. We observed that            sition bias is also consistent with Bich et al. where 88%
while tetracycline inactivation mechanisms significantly       of tested Vietnamese residents carried mcr-1 [107]. In
increased in abundance after travel, tetracycline riboso-      comparison, a culture-based study [92] by Arcilla et al.
mal protection mechanisms did not. In fact, none of the        of ESBL-producing E. coli isolates from all 2001 partici-
tetracycline ribosomal protection resistance genes was         pants (540 to Southeastern Asia) in the COMBAT study
significantly acquired during travel. Our study-specific       detected mcr-1 in 6 E. coli isolates, indicating higher de-
functional metagenomic selection database also provides        tection sensitivity for mcr-1 using qPCR directly from
higher sensitivity to detect AMR genes that may be un-         the stool. These results are also comparable to another
derrepresented in conventional AMR databases. Indeed,          culture-based isolate study [27] where 20 of 412 return-
51 of the 121 (42.1%) AMR genes detected and com-              ing US travelers yielded mcr-harboring E. coli.
pared in our analysis were from functional selections.            In 2018, Wang et al. analyzed mcr-1-containing plas-
The AMR genes identified in Langelier et al. are often         mids across a number of different bacterial isolates from
found in commonly cultured clinical isolates and thus          around the globe [11]. China and Vietnam were the two
are well represented in conventional AMR databases.            countries with the most isolates harboring mcr-1 plas-
  An individual’s gut resistome response to travel per-        mids, which corresponds to our detection of mcr-1 in
turbation may parallel the response from other non-            travelers to Southeastern Asia. The authors found that
travel gut perturbations, including hospitalization and        mcr-1 initially mobilized to plasmids through an ISApl1
antimicrobial treatment [104, 105]. In a 2017 study of         transposon. This is consistent with the reference plasmid
healthy patients compared to antibiotic-treated patients       in Fig. 9c.
hospitalized in an ICU in The Netherlands, Buelow et al.          Our mcr-1 results advocate for a combined approach
found that healthy patients had enriched tetW and catA         of AMR gene detection. Short-read shotgun metage-
[105]; both tetW and catA were also more likely to be          nomic sequencing provided us with excellent data for
found in our pre-travel than post-travel samples. In con-      understanding gut resistome composition changes, di-
trast, the antibiotic-treated ICU patient resistomes in the    versity changes, and AMR gene acquisitions due to
Buelow et al. study were enriched for AMR genes such           travel, but only 1 of 18 (5.6%) mcr-1 qPCR-positive stool
as erm and an aac(6’) family gene, both of which were          samples we assembled yielded an mcr-1 contig. How-
also acquired and increased in our post-travel samples.        ever, we show that AMR gene contig assembly yields an
With antibiotic perturbation, the effects on the gut resis-    important genomic context surrounding resistance genes
tome can vary based on the spectrum of the antibiotic          that could have implications for understanding and
[41, 42, 81]. However, studies commonly observe an in-         modeling AMR gene spread. Contig assembly using
crease in resistome α-diversity and a decrease in β-           short-read shotgun metagenomic sequencing may differ
diversity [81]. This is similar to our observations in re-     by AMR gene. For example, we successfully assembled
sponse to travel perturbation. Additionally, some studies      tetX in 56 of 143 (39.2%) ShortBRED-positive samples.
show a time dependence for AMR gene acquisitions and           Future studies may employ chromosome conformation
abundance increases [42, 81] paralleling the weak time         capture or long-read sequencing in concert with short-
D’Souza et al. Genome Medicine           (2021) 13:79                                                                                          Page 18 of 21

read sequencing to improve metagenomic assembly and                            Acknowledgements
give even more detailed genomic context to resistance                          We thank all the employees of the travel clinics (Institute for Tropical
                                                                               Diseases, Havenziekenhuis; Centre of Tropical Medicine and Travel Medicine,
gene detection directly from stool [28].                                       Amsterdam University Medical Centre; EASE Travel Health & Support) for
  Our study design was optimized to understand the ac-                         their help in the recruitment of participants. We thank the Edison Family
quisition within travelers, and we do not have samples                         Center for Genome Sciences & Systems Biology at Washington University in
                                                                               St. Louis School of Medicine staff, Eric Martin, Brian Koebbe, and Jessica
from travelers’ contacts while abroad. Pre-travel sam-                         Hoisington-López, for the technical support in high-throughput sequencing
ples from our Dutch cohort also contain resistant                              and computing. We thank Christel Driessen and Erik Beuken (Penders lab) for
bacteria and AMR genes, but our study is only                                  the construction of functional metagenomic libraries and the members of
                                                                               the Dantas Lab for the helpful comments on the manuscript.
equipped to show unidirectional gene transfer from                             Members of COMBAT Consortium: Martin C.J. Bootsma10,11, Perry J. van
the destination to the travelers; it is also possible                          Genderen12, Abraham Goorhuis13, Martin P. Grobusch13, Nicky Molhoek14,
that travelers could deposit AMR genes in their                                Astrid M.L. Oude Lashof3, Ellen E. Stobberingh3, Henri A. Verbrugh5. Affiliation
                                                                               for members of the COMBAT Consortium: 10Julius Centre for Health Sciences
travel destinations. Future investigation into travelers’                      and Primary Care, University Medical Centre Utrecht, Utrecht, The
contacts at home and abroad may resolve AMR gene                               Netherlands; 11Department of Mathematics, Faculty of Science, Utrecht
transmission networks. We also observed that group-                            University, Utrecht, The Netherlands; 12Department of Medical Microbiology
                                                                               and Infectious Diseases, University Hospital Erasmus Medical Centre,
ing samples by subregion better explains the sample                            Rotterdam; Department of Internal Medicine and Institute for Tropical
composition than grouping by continent. It is pos-                             Diseases, Harbour Hospital Rotterdam; 13Center of Tropical Medicine and
sible that we are missing even more granular effects                           Travel Medicine, Department of Infectious Diseases, Amsterdam University
                                                                               Medical Center, Amsterdam Public Health, Amsterdam Infection and
that would be found at the country or even city level                          Immunity, University of Amsterdam, Amsterdam, The Netherlands;
[40, 108].                                                                     14
                                                                                 Department of Internal Medicine and Institute for Tropical Diseases,
                                                                               Harbour Hospital, Rotterdam, The Netherlands.

Conclusions                                                                    Authors’ contributions
We provide new data regarding the effect of inter-                             AWD, MB, GD, and JP conceived the study design, experiments, and
national travel to low- and middle-income regions on                           analyses. MSA and JMH collected the samples and metadata and
                                                                               contributed to the design of the COMBAT study. JP, CS, MDJ, and DCM
the gut resistome of travelers from a high-income coun-
                                                                               oversaw the data collection and designed the COMBAT study. GG
try. We show that such travelers acquire AMR genes                             contributed to the functional metagenomics. SP and MB sequenced the
abroad and carry these AMR genes back to their coun-                           stool samples and functional metagenomic libraries. AWD and MB
                                                                               performed the computational analyses. AWD drafted the article and figures
tries of origin. These AMR genes include both known
                                                                               with critical revision performed by MB, JMH, GG, CS, GD, and JP. AWD
clinically relevant AMR genes that are common in path-                         addressed the reviewer and editorial comments with advice from MB, GD,
ogens (e.g., blaCTX-M and mcr-1) and functionally discov-                      and JP. All authors read and approved the final manuscript.
ered AMR genes with no known homologs in the
                                                                               Funding
current databases. We also show AMR gene acquisition                           The COMBAT study was funded by The Netherlands Organization for Health,
and carriage in the gut resistome is travel destination-                       Research and Development (ZonMw; 50-51700-98-120). This work was sup-
specific with compositional signatures lasting at least                        ported in part by awards to JP through the Dutch Research Council (VIDI
                                                                               grant 016.156.427) and GD through the National Institute of Allergy and In-
until the traveler returns home. Interventions to re-                          fectious Diseases of the US National Institutes of Health (R01AI123394), the
duce AMR burden in low- and middle-income coun-                                Congressionally Directed Medical Research Program of the US Department
tries with current high endemic AMR burdens may                                of Defense (W81XWH1810225), and the Edward Mallinckrodt, Jr. Foundation
                                                                               (Scholar Award). AWD received support from the Institutional Program Unify-
reduce traveler AMR gene acquisitions. Developments                            ing Population and Laboratory-Based Sciences Burroughs Welcome Fund
in risk stratification for AMR genes could help target                         grant to Washington University and the National Research Service Award-
such efforts [109].                                                            Medical Scientist grant to Washington University (T32 GM007200). The con-
                                                                               tent is solely the responsibility of the authors and does not necessarily repre-
                                                                               sent the official views of the funding agencies.
Supplementary Information
The online version contains supplementary material available at https://doi.   Availability of data and materials
org/10.1186/s13073-021-00893-z.                                                Source data for all figures is provided in the source data document
                                                                               (Additional file 3). Assembled functional metagenomic contigs and raw
 Additional file 1: Supplementary notes (A-F), supplementary table             shotgun metagenomic reads have been deposited and released to NCBI SRA
 legends (S1-S9), and supplementary figures (S1-S15).                          under BioProject ID PRJNA688274 [110].
                                                                               Other publicly available data used in this project:
 Additional file 2: Supplementary tables (S1-S9).
                                                                               Data from Dhakan et al. 2019 is deposited under BioProject PRJNA397112
 Additional file 3: Source data for all figure panels.                         [111].
 Additional file 4: Scripts that takes in community data matrix and            Data from Khongmee, Aranya from Chiang Mai University “Escherichia coli
 outputs Dirichlet Multinomial model object.                                   CRE10 isolated from stool of a human with gastroenteritis”, including E. coli
                                                                               CRE10 genome assembly GCA_004135815.1 and mcr-1 plasmid assembly
 Additional file 5: Takes in community data matrix and directory with
                                                                               NZ_CP034405.1 are deposited in BioProject ID PRJNA508865 [112].
 Dirichlet Multinomial model objects and outputs data from the best fit
                                                                               The software packages used in this study are free and open source. Scripts
 model.
                                                                               used to generate Dirichlet multinomial mixture models are included as
 Additional file 6: Outputs a data table for AIC values of DMN models          Additional files 4, 5 and 6. Scripts used for functional metagenomics
 and makes aggregated AIC and Laplace plots.                                   processing and analysis and scripts used for resistance gene annotation are
                                                                               available on GitHub at https://github.com/dantaslab [113].
You can also read