A High-Quality Assembly Reveals Genomic Characteristics, 1 Phylogenetic Status and Causal Genes for White Feather of 2 Indian Peafowl
←
→
Page content transcription
If your browser does not render page correctly, please read the page content below
A High-Quality Assembly Reveals Genomic Characteristics, 1 Phylogenetic Status and Causal Genes for White Feather of 2 Indian Peafowl shaojuan Liu South China Agricultural University College of Animal Science hao Chen Jiangxi Science and Technology Normal University School of Life Science jing Ouyang Jiangxi Science and Technology Normal University School of Life Science min Huang South China Agricultural University College of Animal Science hui Zhang South China Agricultural University College of Animal Science sumei Zheng South China Agricultural University College of Animal Science suwang Xi Jiangxi Agricultural University College of Animal Science and Technology hongbo Tang Jiangxi Science and Technology Normal University School of Life Science yuren Gao Jiangxi Science and Technology Normal University School of Life Science yanpeng Xiong Jiangxi Science and Technology Normal University School of Life Science di Cheng Jiangxi Agricultural University College of Animal Science and Technology kaifeng Chen Jiangxi Agricultural University College of Animal Science and Technology bingbing Liu South China Agricultural University College of Animal Science wanbo Li Jimei University xueming Yan Jiangxi Science and Technology Normal University School of Life Science huirong Mao ( maohuirong82@hotmail.com )
Jiangxi Agricultural University https://orcid.org/0000-0003-2588-1521 jun Ren South China Agricultural University College of Animal Science Research Keywords: Indian peafowl, Genome assembly, Phylogeny, PMEL, White feather Posted Date: July 1st, 2021 DOI: https://doi.org/10.21203/rs.3.rs-650113/v1 License: This work is licensed under a Creative Commons Attribution 4.0 International License. Read Full License

1         A high-quality assembly reveals genomic characteristics,
2          phylogenetic status and causal genes for white feather of
3                                       Indian peafowl
4    Shaojuan Liu1#, Hao Chen3#, Jing Ouyang3, Min Huang1, Hui Zhang1, Sumei Zheng1,
5    Suwang Xi2, Hongbo Tang3, Yuren Gao3, Yanpeng Xiong3, Di Cheng2, Kaifeng Chen2,
6    Bingbing Liu1,Wanbo Li4, Xueming Yan3*, Huirong Mao2*, Jun Ren 1*
     1
7        College of Animal Science, South China Agricultural University, Guangzhou 510642,
8    China
     2
9        School of Animal Science and Technology, Jiangxi Agricultural University,
10   Nanchang 330045, China
     3
11       College of Life Science, Jiangxi Science & Technology Normal University, Nanchang
12   330013, China
     4
13       Key Laboratory of Healthy Mariculture for the East China Sea, Ministry of
14   Agriculture and Rural Affairs, Jimei University, Xiamen 361021, China
     #
15       Both authors contribute equally to this paper.
     *
16       Corresponding author.
17   E-mail address: maohuirong82@hotmail.com (H. M); xuemingyan@hotmail.com (X.
18   Y)
19

20

21

22

23

24

25

26

27

28

                                                   1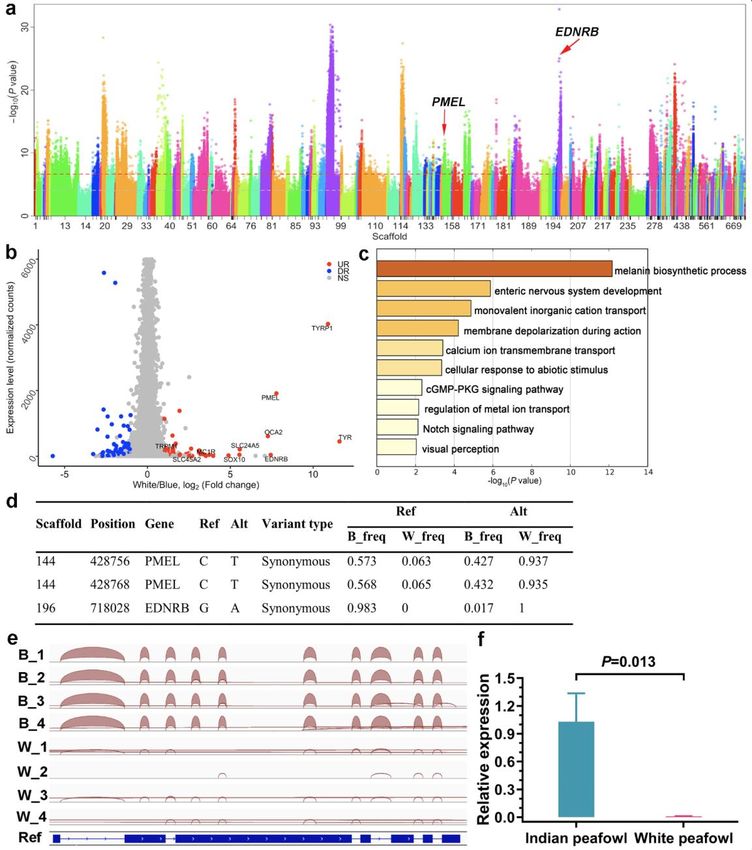
29   Abstract
30   Background: Indian peafowl (Pavo cristatus) attracts people's attention because of the
31   exclusively dazzling phenotypic characteristics. However, little is known about the
32   phenotypic evolution and phylogeny of Indian peafowl at the whole-genome level. So
33   far, there has been no report on the genetic mechanism of the formation of white feather
34   in white feather peafowl.
35   Results: This study assembled a draft genome of Indian peafowl with a genome size of
36   1.05 Gb (the sequencing depth is 362×), and N50 of the contig and scaffold was up to
37   6.2 Mb and 11.4 Mb, respectively. Compared with other birds, Indian peafowl changed
38   in terms of metabolism, immunity, skeletal development and feather development,
39   which provided a novel insight into the phenotypic evolution of peafowl, such as the
40   large body size and feather morphologies. It was confirmed that the phylogeny of Indian
41   peafowl was closer to that of turkey than that of chicken. Specially, it was identified
42   that PMEL was a causal gene leading to the formation of white plumage in blue and
43   white feather peafowl.
44   Conclusions: This study provides a peafowl genome with high-quality as well as a
45   novel understanding in the phenotypic evolution and phylogeny of peafowl among
46   other birds. The results contribute a valuable reference genome to the study of the avian
47   genome evolution. In addition, the discovery of the genetic mechanism of white
48   plumage not only is a breakthrough in the exploration of peafowl plumage, but also
49   provides clues and new ideas for further investigations of the avian plumage coloration
50   and artificial breeding in peafowl.
51   Keywords: Indian peafowl; Genome assembly; Phylogeny; PMEL; White feather

52

53

54

55

56

57

58

59

                                                 2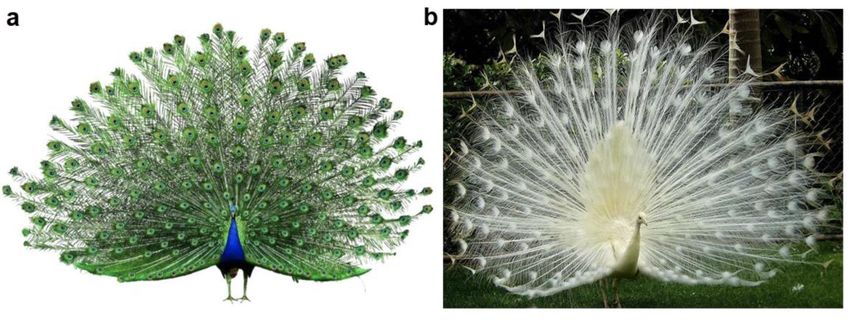
60   Introduction
61   Pavo cristatus, commonly called Indian peafowl or blue peafowl, is the king of birds,
62   representing elegance, honour, beauty, luck, and romance in many Asian cultures
63   (Figure 1a) (Gadagkar, 2003; Kushwaha & Kumar, 2016). Peafowl, belonging to the
64   Aves, Galliformes, Phasianidae, and Pavo, has two species: green peafowl and blue
65   peafowl. Indian peafowl, as the national bird of India, has been widely distributed in
66   Bangladesh, Bhutan, India, Nepal, Pakistan, and Sri Lankan (Kushwaha & Kumar,
67   2016; Ramesh & McGowan, 2009). Commonly, the male Indian peafowl is more
68   attractive than female because of its larger body size and more glittering plumage.
69   Indian peafowl is one of the largest and most beautiful birds in pheasant as a valuable
70   ornamental display with their fan-shaped crests, brightly blue plumage, and glaring tails.
71   Moreover, Indian peafowl is well known as a protein resource, because their meat,
72   internal organs, and bones have high nutritional values, even with medicinal values
73   (Mushtaq-ul-Hassan, Ali, Arshad, Mahmood, & Research, 2012; Paranjpe & Dange,
74   2019; Talha, Mia, & Momu, 2018).
75     With the improvement of whole genome sequencing technology, more and more
76   avian genomes were assembled, such as chicken (Gallus gallus) ("Sequence and
77   comparative analysis of the chicken genome provide unique perspectives on vertebrate
78   evolution," 2004), turkey (Meleagris gallopavo) (Dalloul et al., 2010), duck (Anas
79   platyrhynchos) (Z. Zhang et al., 2018), and other birds (Jarvis et al., 2014), which
80   provided basic references for the study of phenotypic characteristics, evolution,
81   economic traits, and environmental adaptation of birds. As for peafowl, the first draft
82   genome of peafowl was released in 2018. However, the length of scaffold and contig
83   N50 of the assembling were only 25.6 kb and 19.3 kb, respectively (Shubham K.
84   Jaiswal et al., 2018). Subsequently, Dhar, et al. improved peafowl genome by using
85   Illumina and Oxford Nanopore technology (ONT), and the length of scaffold N50 was
86   up to 0.23 Mb (Dhar et al., 2019). The previous studies of peafowl focused on courtship
87   behaviour (Dakin, McCrossan, Hare, Montgomerie, & Amador Kane, 2016), immunity
88   (Wang, Zhao, Liu, Shao, & Xing, 2019), and productivity (Samour, Naldo, Rahman, &
89   Sakkir, 2010). Additionally, most researches on the phylogenetic relationship of
90   peafowl and the Phasianidae were based on the mitochondrial genomes, DNA
91   transposable factors, and partial DNA nucleotide sequences, and the conclusions of

                                                 3
92 these researches are still controversial (J. Naseer et al., 2018; Shen et al., 2014; Zhou,
93 Sha, Irwin, & Zhang, 2015). Therefore, a better quality assembly of peafowl genome is
94 needed to provide baseline data for further studies on peafowl. It has been suggested
95 that the grey peafowl pheasant (Polyplectron bicalcaratum) could be the ancestor of
96 peafowl (Bush & Strobeck, 2003). However, the phylogenetic relationships of peafowl
97 with other pheasants are still unclear, though there have been several recent attempts to
98 investigate it. Study on Hainan peafowl pheasant provided evidences to argue whether
99 it is a subspecies of the grey peafowl pheasant (Chang et al., 2008). Zhou et al. (2015)
100 analysed the phylogenetic status of Indian peafowl in Phasianidae by using a complete
101 mitochondrial genome, and found out its closest genetic affinity with green peafowl
102 (Zhou et al., 2015). Sun et al. (2014) revealed the close relationships among Pavo,
103 Polyplectron and Argusianus within the Phasianidae (Sun et al., 2014). It is expected
104 that a more clarified taxonomic status of the peafowl in Phasianidae can be investigated
105 via the high-throughput sequencing technology.
106 Previous studies reported that there were many plumage colour mutants, including
107 white, black, variegated, cameo, and oaten (Ouyang et al., 2009; R. G Somes & Burger,
108 1993; R. G. Somes & Burger, 1991), among which, the most ornamental colour was
109 the white plumage, belonging to leucism rather than albinism since the feather was
110 white but the eyes had melanin pigmentation (Figure 1b). The inherited basis of
111 plumage colour has attracted researchers for a long time. The first report on it suggested
112 that the plumage phenotype of peafowl was determined by autosomal genes in a
113 recessive model (R. G. Somes & Burger, 1991). Another study verified that a single
114 autosomal locus was in control of all plumage phenotypes in peacock, where the pied
115 colour appeared in two heterozygous mutant alleles, with the black on recessive mutant
116 allele, and the all-white plumage in homozygous mutant allele as the most dominant (R.
117 G Somes & Burger, 1993). Nevertheless, further studies on the genetic mechanism of
118 the white plumage in peafowl are needed, i.e., to clarify the causative mutations of this
119 phenotype.
120 Therefore, a high-quality (near-chromosomal) reference genome of Indian peafowl
121 was constructed by using the third-generation de novo assembly technology. Based on
122 the assembly, it was devoted to investigate the molecular evolution and phylogenetic
123 classification of peafowl in the Phasianidae at the genome-wide level. Subsequently,
4124 comparative genomics analysis was performed to investigate the biological
125 characteristics of evolution through comparing the genome of Indian peafowl with the
126 high-quality genomes of other birds, human and mouse. Furthermore, the
127 transcriptomic and pooled resequencing data were analysed to identify the genetic
128 mechanism of the white plumage in Indian peafowl. This work will provide an updated
129 understanding of and key reference for genomic characteristics, phylogenetic status and
130 genetic mechanism of white feather in Indian peafowl.
131 Materials and Methods
132 Sample collection
133 All procedures used for this study and involved in animals fully complied with
134 guidelines for the care and utility of experimental animals established by the Ministry
135 of Agriculture of China. The ethics committee of South China Agricultural University
136 approved this study. A blood sample was collected from a female Indian peafowl for
137 genome assembling, and 51 blood samples from 35 blue feather peafowls and 16 white
138 feather peafowls for pooled resequencing in Leping Sentai special breeding Co., Ltd in
139 Jiangxi Province, China, under the principles and standards of animal welfare ethics.
140 Meanwhile, two liver and two muscle tissues were sampled from a female Indian
141 peafowl to assist the process of assembling the Indian peafowl genome. Additionally,
142 feather pulps from 8 blue and 8 white peafowls were collected for RNA-seq.
143 DNA and RNA extraction
144 Genomic DNA was extracted from blood samples by using a routine phenol-chloroform
145 protocol. The concentration of the extracted DNA was evaluated by using a Nanodrop
146 2000 spectrophotometer (Thermo Fisher Scientific, Waltham, MA, USA), and diluted
147 to a final concentration of 100 ng/μL. The integrity of DNA was checked via
148 electrophoresis on 0.8% agarose gel. Total RNA of feather pulp was extracted by using
149 TRIzol reagent (Thermo Fisher Scientific, Waltham, MA, USA). The purity and
150 degradation of RNA was detected by Nanodrop 2000 spectrophotometer and agarose
151 gel electrophoresis.
152 De novo assembling of the Indian peafowl reference genome
5153 Library Preparation and Sequencing: Genomic DNA was used to make a 350 bp insert
154 fragment libraries by using the Illumina TruSeq Nano method, starting with 100 ng
155 DNA. Mate pair libraries were made by using the Nextera Mate Pair Sample
156 Preparation Kit (Illumina) with the gel plus option, and sequenced by using Illumina
157 NovaSeq 6000 platform. For PacBio sequencing, genomic DNA was sheared by a g-
158 TUBE device (Covaris) with 20 kb settings for further preparing a 20 kb Single-
159 Molecule Real Time (SMRT) bell, and then the single-molecule sequencing was
160 completed on a PacBio RS-II platform. For 10X genomics sequencing, each GEM was
161 amplified by PCR and added P7 sequencing adapters for Illumina sequencing.
162 Genome Assembly: The genome assembling of Indian peafowl was performed in
163 five steps, which was illustrated in Supplementary Figure S1. The raw reads were
164 generated from two paired-end libraries sequenced on Illumina NovaSeq 6000 platform.
165 The sequencing adapters, contaminated reads, and low-quality reads were removed by
166 using megablast v2.2.26 (Y. Chen, Ye, Zhang, & Xu, 2015). The genome size was
167 calculated by using the formula: Genome size = kmer_Number / Peak_Depth. Secondly,
168 PacBio sequencing was used to control and correct errors. The error corrected data were
169 assembled by falcon software (C.-S. Chin et al., 2016), and the Overlap-Layout-
170 Consensus algorithm was used to obtain the consensus sequences, which were then
171 corrected by quiver software (C. S. Chin et al., 2013). Combined with the second-
172 generation sequencing data, the consensus sequences were recalibrated by using the
173 pilon software (Walker et al., 2014) to improve the accuracy, and high-quality
174 consensus sequences were obtained. Thirdly, the 10X genomics sequencing was used
175 to assist the genome assembly. The 10X genomics library was sequenced to obtain
176 linked-reads, which were aligned to the consensus sequences obtained from the PacBio
177 sequencing assembly, and then linked reads were added to assemble the super-scaffolds
178 by fragScaff software (Adey et al., 2014). Fourthly, similar to the third step, Chicago
179 sequencing data was used to assist assembly to map the draft genome assembly. Finally,
180 the Illumina reads were mapped to the draft genome by using BWA (Burrows-Wheeler
181 Aligner) (H. Li & Durbin, 2009). Then, pilon (version 1.22) was used to correct the
182 assembled errors based on the mapped results.
183 Consistency and completeness: The consistency and integrity of the assembled
184 peafowl genome were separately assessed by using the BUSCO (Benchmarking
6185 Universal Single-Copy Orthologs) (Simão, Waterhouse, Ioannidis, Kriventseva, &
186 Zdobnov, 2015) and CEGMA (Core Eukaryotic Genes Mapping Approach) (Parra,
187 Bradnam, & Korf, 2007; Parra, Bradnam, Ning, Keane, & Korf, 2009), based on single-
188 copy orthologues from the AVES (odb9) database. In order to evaluate the accuracy,
189 integrity and sequencing uniformity of the genome assembly, small fragment library
190 reads were selected and aligned to the assembled genome by using BWA software. All
191 the genomic sequences were generated by Novogene Inc, Beijing, China.
192 Genome Annotation: Genome annotation mainly included three aspects: repetitive
193 sequence annotation, gene annotation (including gene structure prediction and gene
194 function prediction) and non-coding RNA (ncRNA) annotation (Supplementary Figure
195 S2). The repetitive sequence annotation included the annotation through homologous
196 sequence alignment and ab initio prediction. The RepeatMasker and
197 RepeatproteinMask software (Tempel, 2012) were employed to identify known
198 repetitive sequences against the RepBase library (Jurka et al., 2005). In ab initio
199 prediction, LTR_FINDER (Z. Xu & Wang, 2007), RepeatScout (Price, Jones, &
200 Pevzner, 2005), and RepeatModeler (Flynn et al., 2020) were used to establish the de
201 novo repeat sequence library, and then repetitive sequences were predicted by
202 Repeatmasker software. The Tandem Repeats (TEs) in the genome were found by
203 Tandem Repeat Finder software (Benson, 1999). In gene annotation, it mainly
204 combined three prediction methods: homology-based prediction, de novo prediction,
205 and other evidence-backed predictions. Homology-based prediction used the protein
206 sequences of Gallus gallus, Meleagris gallopavo, Peking duck, Struthio camelus,
207 Nipponia nippon, and Eastern Zhejiang white goose, downloaded from Ensembl
208 (release 74), to align to the Indian peafowl genome by using TblastN (Kent, 2002).
209 Genewise (Birney, Clamp, & Durbin, 2004) was then used to align to the matched
210 proteins for a precise gene model.
211 In addition, Augustus (Stanke et al., 2006), GlimmerHMM (Majoros, Pertea, &
212 Salzberg, 2004), Geneid (Alioto, Blanco, Parra, & Guigó, 2018), GenScan (Burge &
213 Karlin, 1997), and SNAP software (Korf, 2004) were used for the ab initio predictions
214 of gene structures. The above predictions with transcriptome-based data being
215 combined, EVidenceModeler software (Haas et al., 2008) was used to integrate the gene
216 set and generate a non-redundant and more complete gene set. Finally, PASA was used
7217 to correct the annotation results of EVidenceModeler for the final gene set. Gene
218 function of the final gene set was annotated by using the protein database of SwissProt
219 (Bairoch & Apweiler, 2000), NR (O'Leary et al., 2016), Pfam (El-Gebali et al., 2019),
220 KEGG (Kanehisa & Goto, 2000), and InterPro (Zdobnov & Apweiler, 2001).
221 tRNAscan-SE software (Lowe & Eddy, 1997) was used to search for the tRNA
222 sequence of genome, with INFERNAL software (http://infernal.janelia.org/) (Nawrocki
223 & Eddy, 2013) from Rfam (Griffiths-Jones et al., 2005) to predict miRNA and snRNA
224 of genome.
225 Gene family
226 The amino acid sequences of the following were downloaded from NCBI database to
227 identify the gene families and single-copy orthologous genes. They are: Japanese quail
228 (Coturnix japonica) (Nishibori, Hayashi, Tsudzuki, Yamamoto, & Yasue, 2001),
229 chicken (Gallus gallus) (Bellott et al., 2017), turkey (Meleagris gallopavo) (Dalloul et
230 al., 2010), northern bobwhite (Colinus virginianus) (Oldeschulte et al., 2017), common
231 mallard (Anas platyrhynchos) (Gregory & James, 2014), zebra finch (Taeniopygia
232 guttata) (Korlach et al., 2017), collared flycatcher (Ficedula albicollis) (Ellegren et al.,
233 2012), medium ground-finch (Geospiza fortis) (G. Zhang et al., 2014), tibetan ground-
234 tit (Pseudopodoces humilis) (Q. Cai et al., 2013), rock pigeon (Columba livia) (Shapiro
235 et al., 2013), peregrine falcon (Falco peregrinus) (Zhan et al., 2013), saker falcon
236 (Falco cherrug) (Friedman-Einat et al., 2014), human (Homo sapiens) (Mohajeri et al.,
237 2016), and mouse (Mus musculus) (Church et al., 2011). The longest transcript of each
238 gene was extracted and then the genes with the length of protein sequences shorter than
239 50 amino acids were filtered. Based on the filtered protein-coding sequences data set,
240 Orthofinder v2.3.7 (Yu, Zavaljevski, Desai, & Reifman, 2011) was used to identify
241 gene families and orthologous gene clusters of 15 species. The single-copy orthologous
242 sequences from the gene families were aligned by using MAFFT v7.450 software
243 (Katoh & Standley, 2013), and then the poorly sequences were removed by using
244 Trimal software with default parameters (Capella-Gutiérrez, Silla-Martínez, &
245 Gabaldón, 2009). The final result was used as a single data set for the subsequent
246 comparative genome analyses.
8247 Phylogenetic tree and divergence time
248 To determine the phylogenetic relationship of 15 species, IQ-tree v2.1.2 software was
249 first used to find the best model for constructing phylogenetic tree with options “-m
250 MF” and the species tree with bootstrap 1000 based on the concatenated alignment of
251 single-copy orthologues sequences from 15 species (Minh et al., 2020). RAxML
252 software was used to construct phylogenetic tree with parameters “-m
253 PROTGAMMALGX -f a” with bootstrap 1000. Divergence time of 15 species was
254 estimated by using MCMCtree program implemented in PAML packages (Yang, 2007).
255 Five calibration time (human-mouse (85~97Mya), human-zebra finch (294~323Mya),
256 zebra finch-medium ground finch (30.4~46.8Mya), common mallard-zebra finch
257 (93.2~104.6Mya) and saker falcon-peregrine falcon (1.66~3.68Mya)) from TimeTree
258 database (Hedges, Dudley, & Kumar, 2006) were used as constrains in the divergence
259 time estimation. The MCMC process was run to sample 1,000,000 times, sample
260 frequency set to 10, and burn-in 40,000, to finally achieve a convergence by using
261 Tracer v1.7.1 (http://tree.bio.ed.ac.uk/software/tracer/).
262 Genome Synteny and Collinearity Analysis
263 To compare the genome synteny of peafowl with chicken and turkey, the homologue
264 of the genome was identified by using BLASTp (E-value < 1e-10). Gene pairs of synteny
265 blocks within the genome were identified by using MCScanX (Wang et al., 2012), and
266 the synteny blocks were showed by circos program from TBtools (C. Chen et al., 2020).
267 To estimate the positively selected genes for peafowl-chicken and peafowl-turkey, the
268 value of Ka/Ks (ω) for each gene pair was calculated by KaKs_calculator (Z. Zhang et
269 al., 2006), and the density curve of values was visualized by R software. The positively
270 selected genes (ω > 1) were conducted based on functional enrichment analysis.
271 Gene-family expansion and contraction
272 To identify the gene family expansion and contraction in peafowl, the gene families in
273 15 species and phylogenetic tree with divergent times were taken into account to
274 estimate the significance of gene gain and loss in gene family by using the CAFE v4.2.1
275 with a random birth and death model and significance of P-values < 0.05 (De Bie,
276 Cristianini, Demuth, & Hahn, 2006). The parameter λ represents the probability of gene
277 gain and loss in a divergent time. In order to investigate the evolutionary rates of
9278 different branches of the tree, the argument with “-t” was used to define three different
279 branches for 15 species: the first branch included mouse and human, the second branch
280 was the Phasianidaes, and other birds were regarded as the third branch. Then, they
281 were conjunct with the “-s” option to search the optimal λ value for different branches
282 by using the maximum likelihood.
283 Positive Selection Analyses
284 To determine the adaptive evolution under the positive selection in peafowl, the single-
285 copy orthologous protein sequences shared among the 11 species (peafowl, chicken,
286 turkey, common mallard, zebra finch, collared flycatcher, medium ground-finch,
287 tibetan ground-tit, rock pigeon, peregrine falcon and saker falcon) were searched,
288 filtered, and then converted to coding gene sequence (CDS) by using EMBOSS
289 backtranseq program (Rice, Longden, & Bleasby, 2000), and the CDS were then
290 aligned to codon by using PRANK with the option “-codon” (Löytynoja, 2014). The
291 above alignments were analysed by using CODEML program of the PAML package
292 4.9 (Yang, 2007). A branch-site model (TEST-II) (model = 2, NSsites = 2) was
293 conducted to identify the positively selected genes of peafowl. The model assumed that
294 a particular branch (foreground, alternative hypothesis) had a different ω value from all
295 the sites compared to all other branches (background, null hypothesis), suggesting that
296 positive selection occurred at only a few sites on a particular branch (foreground) (Yang,
297 2007). The peafowl was regarded as a foreground branch and other species as a
298 background branch. Additionally, the branch model was used to identify the rapidly
299 evolving genes in peafowl, assuming that the branch of peafowl was as an alternative
300 hypothesis (model = 2) and the branches of other species were as the null hypothesis
301 (model = 0). The dN/dS (ω) values between foreground branch and background branch
302 were estimated by using Likelihood Ratio Test (LRT) values based on chi-square test.
303 When the ω value in the foreground branch was greater than that of the background
304 branch, it suggested that the genes of the foreground branch were under positive
305 selection (P < 0.05), and the positively selected sites were determined by using the
306 Bayesian Empirical Bayes method. All the positively selected genes were performed in
307 functional enrichment analysis by using KOBAS (Xie et al., 2011).
308 Whole-genome resequencing and variant calling
10309 The genomic DNA from 35 blue feather peafowls and 16 white feather peafowls were
310 pooled, respectively. Then 1.5 μg DNA per pool was used for constructing the
311 sequencing libraries by using Truseq Nano DNA HT Sample preparation Kit (Illumina,
312 USA) following manufacturer’s constructions. Each pooled DNA was fragmented
313 through sonication to a size of 350bp and end repaired, A-tailed, and ligated with the
314 full-length adapter for Illumina sequencing with further PCR amplification. PCR-
315 amplified sequencing libraries were purified (AMPure XP system) and analysed for
316 size distribution on Agilent2100 Bioanalyzer, and were quantified by using real-time
317 PCR. These libraries constructed above were sequenced on an Illumina NovaSeq
318 platform and 150bp paired-end reads were generated with insert size around 350 bp.
319 The raw data were filtered by removing reads with ≥10% unidentified nucleotides (N),
320 reads with > 50% bases having phred quality < 5, and reads with > 10 nt aligned to the
321 adapter allowing ≤10% mismatches. The clean reads were mapped to the assembled
322 reference genome by using BWA with parameters “mem -t 4 -k 32 –M –R”. Alignment
323 files were converted to BAM files by using SAMtools software (settings: –bS –t) (H.
324 Li et al., 2009). In addition, potential PCR duplications were removed by using
325 SAMtools command “rmdup”. Single nucleotide polymorphisms (SNPs) and
326 insertions/ deletions (Indels) (< 50 bp) were detected by using Genome Analysis
327 Toolkit v 4.0 (GATK) pipeline (McKenna et al., 2010).
328 RNA sequencing (RNA-seq) on PacBio platform
329 The cDNA of feather was acquired through PrimeScript™ RT reagent Kit with gDNA
330 Eraser (TaKaRa Bio. Inc, Dalian, China) according to the manufacturer’s instructions.
331 The cDNA was performed damage repair, end repair, SMRT (single-molecule, real-
332 time) dumbbell-shaped adapters, and ligation of the adapters to construct a mixed
333 library. Primers and DNA polymerase were then combined to form a complete SMRT
334 bell library. The qualified library was used for sequencing on a PacBio Sequel platform.
335 The clean data were aligned to the reference genome of Indian peafowl by using STAR
336 v2.5.3a (Dobin et al., 2013). The Transcript assembly and gene expression levels were
337 conducted by using StringTie v1.3.3 (Pertea, et al., 2015) and featureCounts (Liao, et
338 al., 2014) in Subread software (Liao, Smyth, & Shi, 2013). Differentially expressed
339 genes (DEGs) between blue and white feather were identified through DESeq2 (Love,
340 et al., 2014) in condition of fold change >2 and P-value < 0.01. Subsequently, the
11341 functional enrichment analyses of DEGs were annotated through GO (Gene Ontology)
342 (Ashburner et al., 2000) and KEGG (Kyoto Encyclopedia of Genes and Genomes)
343 database.
344 cDNA amplification
345 cDNA of feathers was reversely transcribed with PrimeScript™ RT reagent Kit with
346 gDNA Eraser (TaKaRa). The reverse transcription quantitative PCR (RT-qPCR) was
347 conducted in a total volume of 10 µl including 5 µl SYBR Taq II kit (TaKaRa), 0.3 µl
348 Rox Reference Dye (50x), 2.7 µl distilled water, 1 µl cDNA and 1 µl primers, and
349 performed on a 7900HT RT-qPCR system (ABI). β-actin was selected as the internal
350 reference gene. All primer sequences were presented in Supplementary Table S20.
351 Results
352 Genomic characteristics of Indian peafowl
353 The third-generation PacBio single-molecule real-time sequencing technology and the
354 second-generation Illumina sequencing technology were used and combined with 10X
355 genomics to assemble the Indian peafowl genome. The distribution of 17-kmer showed
356 a major peak at 154× (Supplementary Figure S3). Based on the total number and
357 corresponding k-mer depth of 154, the Indian peafowl genome size was estimated to
358 1.05 Gb. A total of two libraries were constructed with a sequencing volume of 164.03
359 Gb and a coverage depth of 154× performed on Illumina NovaSep 6000 platform. 10X
360 Genomics sequencing platform yielded 112.57 Gb sequencing data with a coverage
361 depth of 92×, and 110.74 Gb sequencing data was produced by using the PacBio
362 sequencing platform with a coverage depth of 103× (Supplementary Table S1). In total,
363 387.34 Gb sequencing data and a total coverage 362× were obtained from the three
364 sequencing strategies with the lengths of scaffold N50 and contigs N50 separately up
365 to 6.2 Mb and 11.4 Mb, which exhibited 446-fold and 50-fold improvement in the
366 scaffold N50 compared to previously published Indian blue peafowl genome reported
367 by Jaiswal, et al. (Shubham K. Jaiswal et al., 2018) and Dhar, et al. (Dhar et al., 2019)
368 (Figure 2, Table 1 and Supplementary Table S2). Current peafowl assembly anchored
369 into 726 scaffolds with 1.05 Gb of sequences and guanine-cytosine (GC) content was
370 42.03% with normally ratio of A, T, G and C (Figure 2 and Supplementary Table S2 -
371 S3). Notably, the GC contents of scaffold 108 and scaffold 31 were more than 50%,
12372 and the gene density of them was relatively conferted (Figure 2). Moreover, it was
373 apparently observed that the density of tandem repeat sequences in scaffold 39 was the
374 higher than any other scaffolds (Figure 2).
375 To assess the completeness and base accuracy of the assembled Indian peafowl
376 genome above, the short reads were aligned back to the draft genome with high
377 mapping rate (98.05%), high coverage rate (99.87%) and low homozygous SNP rate
378 (0.0002%), generally reflecting the accuracy of genome assembly (Supplementary
379 Table S4-S5). The draft assembly was further evaluated by CEGMA, and the results
380 showed that 88.71% of 248 core genes selected from 6 eukaryotic model organisms
381 could be covered. Additionally, 97.4% complete genes (including 96.8% complete and
382 single-copy genes and 0.6% complete and duplicated genes) were predicted, 1.7%
383 fragmented genes and 0.9% missing genes were identified from 2,586 genes in Aves
384 dataset by using the BUSCO (Supplementary Table S6). Collectively, these important
385 indicators implied relatively high genome coverages and continuity for Indian blue
386 peafowl genome, providing an important resource for molecular breeding and
387 evolutionary studies for peafowl. The Indian peafowl genome with integrated
388 annotations has been deposited in the Genome Warehouse in National Genomics Data
389 Center, Beijing Institute of Genomics (BIG), Chinese Academy of Sciences, under
390 accession number GWHAZTP00000000 publicly accessible
391 at https://bigd.big.ac.cn/gwh ("Database Resources of the National Genomics Data
392 Center in 2020," 2020).
393 Taking the Gallus gallus, Meleagris gallopavo, Peking duck, Struthio camelus,
394 Nipponia nippon, and Eastern Zhejiang white goose genome as references, and
395 according to the homologous alignment and ab initio prediction, the peafowl genome
396 comprised 15.20% non-redundant repeat sequences, including 1.27% tandem repeats,
397 14.12% transposable elements and 7.35% transposable element protein (Supplementary
398 Table S7). A total of 14.56% of transposable elements was identified after combine
399 TEs, 0.70% of which was DNA transposons, 3.93% was long terminal repeats (LTRs),
400 0.01% was short interspersed nuclear elements (SINE), and 10.68% was the long
401 interspersed nuclear elements (LINE) (Supplementary Figure S4 and Supplementary
402 Table S7-S8). Altogether, 19,465 non-redundant protein-coding genes were predicted,
13403 of which 15,766 (81%) were annotated to function by six public databases, including
404 NR, Swissprot, KEGG, InterPro, GO and Pfam (Table 1 and Supplementary Table S9-
405 S10). Additionally, 354 microRNAs (miRNAs), 308 transfer RNAs (tRNAs), 151
406 ribosomal RNAs (rRNAs) and 334 small nuclear RNAs (snRNAs) were also identified
407 (Supplementary Table S11). Notably, compared with the other birds such as turkey,
408 chicken, duck or previously reported draft peafowl genome, more non-redundant
409 protein-coding genes and repetitive sequences as well as non-coding RNA in this draft
410 peafowl genome were predicted. Overall, this assembly has more continuity,
411 completeness, and accuracy, and the annotation of core eukaryotic genes and universal
412 single-copy orthologs have also been improved.
413 Gene families and phylogenetic relationship within the Phasianidaes
414 The protein sequences of 15 species were used to search the orthologues by using the
415 OrthoFinder (Emms & Kelly, 2015). The results showed that a total of 18,038
416 orthogroups were identified in 15 species, of which 5,999 single-copy orthologues were
417 shared among these species (Figure 3a). In addition, 93 gene families were identified
418 specific to peafowl and 11,447 gene families were shared by peafowl and other
419 Phasianidaes (chicken, turkey and Japanese quail) (Figure 3b). The peafowl species-
420 specific gene families were mainly involved in the immune response and biological
421 process such as FOXP3, FZD3, and TP53 participated in many immunological process
422 and played an important role in melanoma and bone homeostasis (Supplementary Table
423 S12) (Fischer et al., 2019; C. Li et al., 2019; Thoenen, Curl, & Iwakuma, 2019). FOXP3
424 is necessary for the development of regulatory T lymphocytes and is essential for
425 maintaining the immune homeostasis and immune self-tolerance to the environmental
426 antigens by eliminating natural reactive T cells in the thymus and peripheral organs.
427 Meanwhile, FOXP3 plays an important role in the bone and hematopoietic homeostasis,
428 inflammatory bone loss diseases and abnormal bone weight, which can affect lymphoid
429 hematopoiesis by acting on the development and function of osteoclasts (Fischer et al.,
430 2019). TP53 plays an important role in inhibiting the progression of bone and soft tissue
431 sarcoma. The loss of TP53 activity can promote the osteogenic differentiation of bone
432 marrow stromal cells and the development of osteosarcoma of bone marrow
14433 mesenchymal stem cells, which can prevent the malignant transformation of bone
434 marrow mesenchymal stem cells (Thoenen et al., 2019). In this study, the enrichment
435 of these genes specific to chicken and turkey in peafowl showed that the healthy
436 development and immunity of bones were of great significance in peafowl evolution,
437 which was conducive to achieving people's demand for rapid growth, large size, and
438 strong disease resistance in domestication of peafowl.
439 To determine the phylogenetic relationship within the Phasianidae family, 5,999
440 single-copy orthologues were concatenated and aligned to construct phylogenetic tree
441 with a bootstrap value of 1,000 by using the maximum likelihood method
442 (Supplementary Figure S5 and S6). The results showed that the Galliformes order were
443 clustered, of which the Phasianidae family formed a group. Moreover, peafowl was
444 found closer to turkey than chicken in the Phasianidae family that was inconsistent with
445 Jaiswal, et al. reported (Shubham K. Jaiswal et al., 2018), the relationship of chicken
446 and quail was closer than turkey, and duck belonging to the Anseriformes order was
447 close to the Galliformes order (Figure 3c). Additionally, the divergence time of all
448 species was estimated and calibrated through the divergence time between human and
449 mouse, human and zebra finch, zebra finch and medium ground finch, common mallard
450 and zebra finch, and saker falcon and peregrine falcon from the TimeTree database.
451 The divergence between Galliformes and Anseriformes was estimated to be 81.2
452 million years ago (Mya). The divergence between northern bobwhite and Phasianidae
453 family was represented by the calibration point of northern bobwhite and turkey. The
454 divergence between the peafowl and turkey was about 35.1 Mya, sharing a common
455 ancestor with chicken about 36.9 Mya (Figure 3c). However, divergence between
456 chicken and Japanese quail was estimated to be 34.7 Mya, within the range of
457 divergence (33.2~42.3 Mya) from TimeTree (T. Cai et al., 2017), which suggested that
458 the relationship between the common ancestor of peafowl and turkey, chicken and
459 Japanese quail was very close to the relationship between these four species. The
460 divergence time of pheasant birds is in the Tertiary era, which marks the advent of the
461 modern biological era and is the heyday of the divergence of animals and plants. It
462 presents that the new generation replaces the ancient types, with the increasing of the
463 same species, common and diverse divergence of birds, and rapid evolution of more
464 species during the Tertiary era.
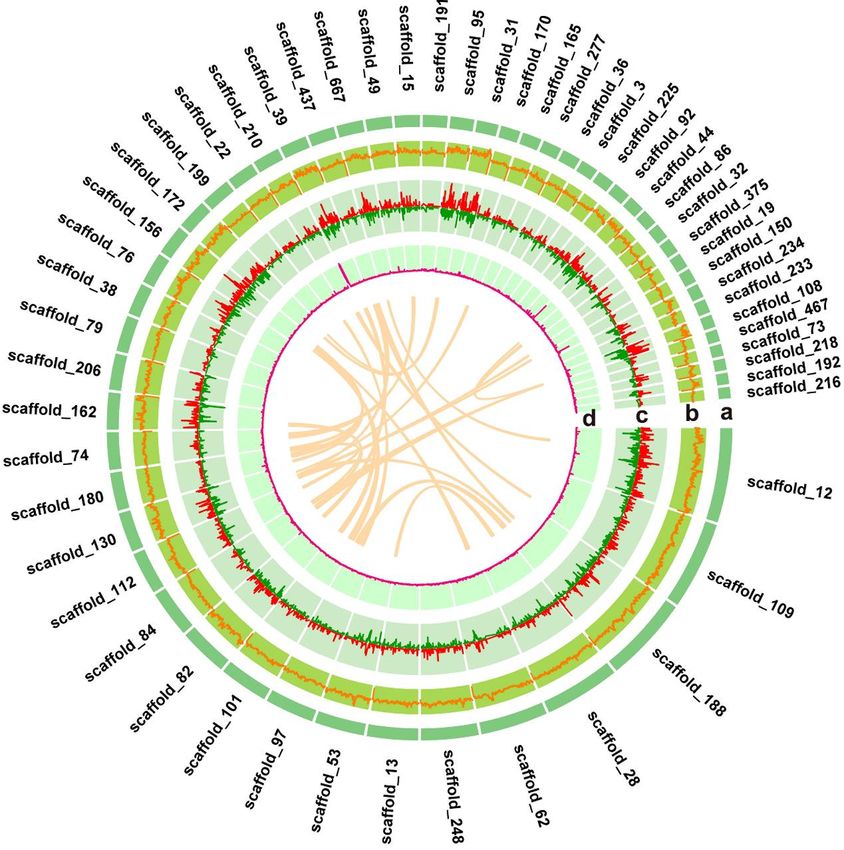
15465 Genome synteny and collinearity among the Indian peafowl, chicken, and turkey
466 Collinearity analysis can reflect the homology of different species and genetic
467 relationship. Genes with the pairwise ratio of nonsynonymous to synonymous
468 substitutions (dN/dS) could be used to infer the positive selection and contributed to
469 understanding the evolutionary characteristics in species. In this study, the pairwise
470 synteny was compared to peafowl and chicken, peafowl and turkey, and the ratio of
471 dN/dS was calculated. The scaffolds of length greater than the scaffold N70 (5 Mb) in
472 peafowl genome and other collinear scaffolds marked as others (Figure 4a and 4b) were
473 displayed. Moreover, the distribution density of the dN/dS ratio was calculated and
474 showed in Figure 4c. 97 positively selected genes (dN/dS > 1) in peafowl compared to
475 chicken were associated with the biological process and immune-related pathways (IL4,
476 CD3D, CD3E and HLA-DMB) (P < 0.05), such as, Th1 and Th2 cell differentiation, T
477 cell receptor signaling pathway, and intestinal immune network for IgA production.
478 Besides, compared with turkey, 43 positively selected genes were significantly enriched
479 in the GO terms of organelle (GO:0043226), extracellular space (GO:0005615), and
480 epithelium migration (GO:0090132), and the pathways of glutathione metabolism
481 (GPX1, GPX2 and GPX4) and thyroid hormone synthesis (GPX1, DUOXA2 and GPX2)
482 (P < 0.05) (Supplementary Table S13 and S14), which were involved in gastrointestinal
483 health, anti-stress, growth development and metabolism. Notably, as a common
484 positive selection gene, EDN1 was reported to participate in many biological process,
485 such as epithelium migration and differentiation, pigmentation and their receptors
486 (EDNRs) widely distributed in various tissues in chicken (H. Liu et al., 2019). These
487 enrichment results indicated that the positively selected genes in peafowl were mainly
488 related to intestinal immunity, anti-stress, growth development and metabolism, and
489 pigmentation compared with turkey and chicken in the evolutionary process, which was
490 beneficial for peafowl to enhance adaptability, improve disease resistance and anti-
491 stress ability, enrich plumage colour, and better adapt to the living environment of long-
492 term artificial breeding.
493 Gene family expansion and contraction across the Indian peafowl genome
494 Likelihood analysis could identify the evolutionary rate and the significant expansion
495 and contraction of gene family in species (De Bie et al., 2006). In this study, the changes
496 of gene family in peafowl with likelihood ratio test were examined. Compared to the
16497 gene families in other species, the results suggested that 121 expansions and 2,999
498 contractions of gene families (P < 0.05) were detected in peafowl (Figure 3c), of which,
499 21 significantly gained genes were mainly involved in energy metabolism and storage
500 (GIMAP1, GIMAP2 and GIMAP8) and immune response (CD244) (P < 0.05), such as
501 the GO terms of natural killer cell activation involved in immune response
502 (GO:0002323), MHC class I protein binding (GO:0042288), positive regulation of
503 interleukin-8 production (GO:0032757), positive regulation of interferon-gamma
504 production (GO:0032729), and lipid droplet (GO:0005811) (Supplementary Table S15).
505 Conversely, 23 significantly contracted genes were mainly relevant to the biological
506 process such as fatty acid degradation (ALDH3A2) (GO:0001561), myocardium
507 development (GO:0048739), muscle contraction and cardiac disease (MYH6, MYH7,
508 and MYH7b), olfactory receptor activity (OR52B2, OR52K1 and OR4S1)
509 (GO:0004984), and the pathways of olfactory transduction, metabolism and cardiac
510 muscle contraction (Supplementary Table S16). For example, the expression of MYH6
511 and MYH7 directly dictated the slow- or fast-twitch phenotype in skeletal muscle and
512 played a vital role in cardiomyocyte energetics and metabolism (Stuart et al., 2016;
513 Toepfer et al., 2020). The olfactory genes were importantly characteristic during the
514 adaptive evolution in birds (Steiger, Kuryshev, Stensmyr, Kempenaers, & Mueller,
515 2009). Peafowl is artificially raised and feed-derived food as a result of the declining
516 of finding food and flighting ability in the wild under the long-term domestication,
517 which is likely to cause the contraction of genes related to the sense of smell and the
518 regulation of skeletal muscle movement in peafowl. In addition, it was observed that
519 the branch of Phasianidae had a higher rate of birth and death than that of other two
520 branches, indicating that the family Phasianidae experienced a rapid evolution.
521 Positively selected genes in the Indian peafowl genome
522 To reveal the adaptive divergence and evolution of peafowl, positive selection was
523 analysed by using the branch-site model in CODEML program. The significantly
524 positive sites were evaluated by the Bayes Empirical Bayes values (BEB ≥ 0.95), which
525 demonstrated that the sites were under positive selection in branch-site model A
526 (foreground). In the branch of peafowl (foreground), 3,417 genes were under
527 significantly positive selection based on the Bayes Empirical Bayes values (P < 0.05).
528 These genes were annotated and classified through the analysis of GO ontology and
17529 KEGG pathways in order to further explore the impact of adaptive evolution on peafowl.
530 According to the results of functional enrichment analyses, it was briefly summarized
531 that these positively selective genes were mainly participated in the process of lipid
532 metabolism (i.e., GO:0005811, GO:0030169, and GO:0008289), limb and skeletal
533 development (i.e., GO:0060173, GO:0001503, and GO:0030509), immune response
534 (i.e., GO:0070498, GO:0043123, and GO:1901224), pigmentation (GO:0042470 and
535 GO:0030318), sensory perception (i.e., GO:0008542, GO:0008542, and GO:0007605),
536 and other GO terms (Supplementary Table S17). Additionally, the pathways of
537 positively selected genes were significantly enriched in metabolic pathways, PI3K-Akt
538 signaling pathway, NF-kappa B signaling pathway, pathways in cancer, MAPK
539 signaling pathway, TNF signaling pathway, Jak-STAT signaling pathway, mTOR
540 signaling pathway, FoxO signaling pathway, fatty acid metabolism, IL-17 signaling
541 pathway, cholesterol metabolism, Th17 cell differentiation, and so on (Supplementary
542 Table S18), which were mainly associated with immunity, energy metabolism, and cell
543 growth and differentiation.
544 Furthermore, the branch model was used to identify a total of 10 rapidly evolving
545 genes in peafowl, including BCl7A, MEF2C, MED27, COPS7A, NMNAT2, SLC25A25,
546 TNIP2, ETS1, CCDC6 and GSG1L. Functional enrichment showed that the
547 significantly pathways included pathways in cancer, nicotinate and nicotinamide
548 metabolism, thyroid cancer, renal cell carcinoma, parathyroid hormone synthesis,
549 secretion and action, thyroid hormone signaling pathway, apelin signaling pathway,
550 fluid shear stress and atherosclerosis (P < 0.05). The significant GO terms were
551 involved in melanocyte differentiation, skeletal muscle and bone development,
552 immunity, and response to stress (Supplementary Table S19). Particularly, it was
553 observed that MEF2C participated in most of GO terms and pathways, which might
554 have important implications in the rapid evolution of peafowl. Cartilage formation was
555 a key process in vertebrate bone development and health maintenance that most bones
556 were developed through cartilage ossification. MEF2C could regulate muscle and
557 cardiovascular development, and was not only a core component of development in
558 regulating muscle, nerve, cartilage-like, immune and endothelial cells, but also
559 necessary for normal chondrocyte hypertrophy and ossification (Dong et al., 2017;
560 Mackie, Ahmed, Tatarczuch, Chen, & Mirams, 2008). Potthoff, et al. suggested that
18561 MEF2C could directly regulate the transcription of myosin gene, and the loss of
562 MEF2C in skeletal muscle caused improper sarcomere organization, which revealed
563 the key role of MEF2C in maintaining sarcomere integrity and skeletal muscle
564 maturation after birth (Potthoff et al., 2007). Arnold, et al. indicated that the
565 transcription factor MEF2C could regulate muscle and cardiovascular development,
566 and control skeletal development by activating the genetic program of chondrocyte
567 hypertrophy (Arnold et al., 2007). In this study, it was observed that MEF2C underwent
568 rapid evolution in peafowl, which was conducive to the development and morphology
569 of bones and the maintenance of body shape of peafowl. This may be due to the increase
570 in weight and body size of peafowl in order to meet people’s needs during the
571 domestication process, and could be well explain the evolutionary phenotype
572 characteristics of peafowl.
573 Genes with allele frequency between blue and white feather Indian peafowl
574 To localize the genomic region underlying the plumage colour, the allele frequency
575 between blue and white feather peafowl was analysed. The clean data of two pooled
576 resequencing were aligned to the assembled peafowl genome by using the Samtools
577 with option “mpileup”, and filtered to calculate allele frequency differences by using
578 Population2 software (Kofler, Pandey, & Schlötterer, 2011). The significance of allele
579 frequency differences was estimated by Fisher's exact test. The up- and downstream of
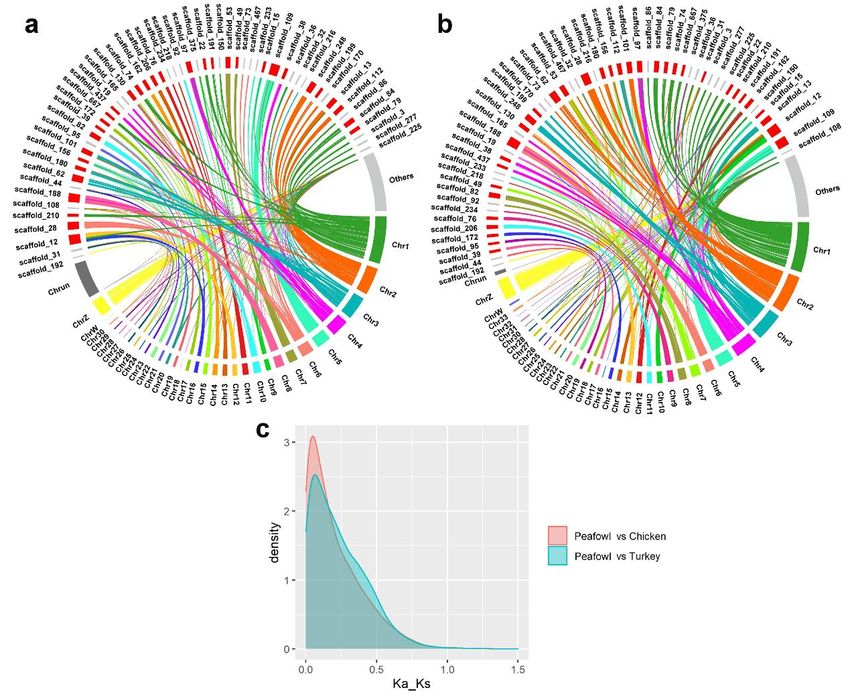
580 50 Kb with -log10 (P-value) greater than 30 as potential candidate regions was
581 extracted . As a result, it was found that EDNRB in scaffold 196 and PMEL in scaffold
582 144 were significantly related to plumage pigmentation (Figure 5a). Additionally, 69
583 down-regulated genes and 52 up-regulated genes between blue and white peafowl were
584 detected, of which ten up-regulated genes (TRYP1, TYR, PMEL, EDNRB, OCA2,
585 SLC24A5, SOX10, MC1R, SLC45A2 and TRPM1) were associated with melanin
586 deposition (Figure 5b). The functional enrichment of DEGs showed the most significant
587 pathway was enriched in the process of melanin synthesis based on the criterion of P <
588 0.05 as significant (Figure 5c). In order to further investigate the allele imbalance
589 difference sites of DEGs, the allele frequency of ten pigmentation-related genes in the
590 blue and white peafowl was calculated, and the function of sites was annotated by using
591 the snpEff software (Cingolani et al., 2012). An observation showed that two
592 differential sites were located in PMEL and one in EDNRB, but none of the differential
19593 sites were obviously functional mutations, such as missense mutations, splicing
594 mutations, or nonsense mutations (Figure 5d). These results suggested that the
595 formation of white feathers was most likely related to the differential expression of
596 PMEL and EDNRB in peafowl.
597 Candidate causative gene for the phenotype of white feather in blue and white
598 feather peafowl
599 To detect the PMEL and EDNRB transcripts in blue and white feather peafowl, the
600 RNA-seq data of PMEL and EDNRB were examined by using the integrative genomics
601 viewer (IGV) application, and it was observed no difference in the transcript of EDNRB
602 in the two types of feather pulp (Supplementary Figure S7), suggesting that ENDRB
603 was normally expressed in blue and white feather peafowl. When compared the
604 transcript of PMEL in blue and white feather peafowl, it was found that PMEL was
605 almost not expressed in white feather peafowl (Figure 5e). To further determine the
606 mRNA expression of PMEL in white feather peafowl, reverse transcription quantitative
607 PCR (RT-qPCR) of PMEL was conducted in blue and white feather peafowl
608 (Supplementary Table S20). RNA samples were extracted from feather pulps and used
609 for subsequent PCR. Surprisingly, it was observed that the mRNA expression of PMEL
610 in white feather peafowl significantly reduced in comparison to that in the blue feather
611 peafowl (P = 0.013) (Figure 5f), which was consistent with the result of RNA-seq data.
612 Hence, it was argued that PMEL was a strong candidate causative gene for the
613 formation of white feathers in blue and white feather peafowl. Further investigations
614 are needed to conduct on the mechanism for the downregulated expression of PMEL in
615 white feather peafowl.
616 Discussion
617 With the development of sequencing technology, the reduction of sequencing costs and
618 the improvement of assembly methods, the increasing genome sequence maps of
619 various species have been published, making the whole genome sequencing to be an
620 important method for conducting basic genetic research on species. Recently, many
621 avian genomes have been assembled, providing good materials to study the genetic
622 mechanisms of evolution, behaviour and pathology. In this study, three sequencing
623 strategies were combined to construct the India peafowl genome, and totally 1.05 Gb
20624 draft genome sequence was obtained, and even the sequencing depth was up to 362×.
625 Moreover, the lengths of contigs N50 and scaffold N50 were respectively achieved to
626 6.2 Mb and 11.4 Mb, which was closer to the chromosomal level. Compared with other
627 avian genomes and the draft genomes of peafowl assembled by Jaiswal, et al. and Dhar,
628 et al. (Dhar et al., 2019; Shubham K. Jaiswal et al., 2018), the Indian blue peafowl
629 genome in this study showed a significantly improved assembly quality, including
630 consistency, accuracy and integrality. This draft genome of peafowl was a considerable
631 improvement in terms of the quality of genome assembly and provided a strong support
632 and guarantee for the subsequent comparative genomic analysis.
633 The phylogeny of birds has always been a matter of great concern and controversy.
634 Generally, researches on phylogenetic relationship of birds are much more based on
635 mitochondrial DNA, cytochrome b gene, nuclear genes or a combination of them
636 (Armstrong, Braun, & Kimball, 2001; Meng, Dai, Ran, Li, & Yue, 2008; Junaid Naseer
637 et al., 2017). Jaiswal’s study demonstrated that the phylogenetic trees of peafowl
638 constructed by the data of nuclear intron regions and mitochondrial genomes supported
639 that peafowl and chicken were clustered and closer than turkey (S. K. Jaiswal et al.,
640 2018). Whereas, the phylogenetic tree based on retroposon insertion and the
641 chromosomal showed that peafowl was closer to turkey than to chicken (Shibusawa et
642 al., 2004). Similarly, Kaiser’s research suggested that the result by using genome-based
643 retrotransposon data to construct the taxonomic status of Phasianidae including chicken,
644 turkey, Japanese quail and peafowl was consistent with Shibusawa’s study, but was
645 disaccord with the observation based on nucleotide sequence that the relationship of
646 chicken and turkey was closer than peafowl (Kaiser, van Tuinen, & Ellegren, 2007).
647 Many studies based on different data types to construct the tree proved that it was
648 uncertain and controversial in the phylogenetic classification of Phasianidae families
649 and may need to search for more evidence to verify. In this study, the single copy
650 homologous amino acid sequence from the whole genome sequencing data was used to
651 construct phylogenetic tree, and it was observed that the position of peafowl was closer
652 to turkey than to chicken, which was disagreed with previous studies (Dhar et al., 2019;
653 Shubham K. Jaiswal et al., 2018). In addition, according to the divergent time, it was
21654 estimated that the divergence between peafowl and turkey was near to the divergence
655 time among chicken and the ancestors of peafowl and turkey, which indicated that the
656 relationship among them was very close, and inconsistent phylogenetic trees were
657 constructed under different strategies.
658 In recent years, since the rapid development of genomics and the accumulation of
659 genomic data, comparative genomics has become a research hotspot, which could
660 explain biological functions and evolutionary characteristics at the genome-wide level.
661 Especially, avian genomes were favour of people to investigate the adaptive evolution
662 and species-specific biological characteristics by discovering novel genes and gene
663 function through comparative genomics analysis. In this study, comparative genomics
664 analysis was conducted on peafowls and other birds to explore the uniquely biological
665 characteristics of peafowl during the evolution.
666 Species-specific immune-related genes were always positively selected in the
667 adaptive evolution in many species. In this study, the number of GO terms and
668 pathways related to immunity in peafowl was more than that of others, such as the
669 expansive genes and rapidly evolving genes involved in the process of MHC class I
670 protein binding, TNF signaling pathway, NF-kappaB signaling, IL-17 signaling
671 pathway and Th17 cell differentiation. Likewise, it was observed that many olfactory
672 genes and myosin genes were lost in peafowl. Mysosin was a functional protein and
673 structural protein, which directly regulated muscle contraction, movement and cardiac
674 functions in animals (Harrington & Rodgers, 1984). Olfaction performed a crucial role
675 in life of birds, which contributed to recognise foods, make courtship, or detect danger
676 (Khan et al., 2015; Lu, Wang, Lei, Yu, & Zhao, 2016). It was reported that birds could
677 recognize close relatives to avoid inbreeding and distinguish direction in migration by
678 using their acute sense of olfaction (Holland et al., 2009; Krause, Krüger, Kohlmeier,
679 & Caspers, 2012). However, in this study, peafowl was artificial farmed and the feed-
680 derived food was sufficient, causing the gradual degradation of the ability to find food
681 in the wild and fly, which may explain the loss of myosin family and olfactory family
682 and contribute to inbreeding and reduction of energy expenditure.
683 Generally, most of the body size of birds was small due to the pressure of body
684 weight and reduction in energy expenditure (Blackburn & Gaston, 1994). However, the
685 peafowl is known to have large body size, huge tail, and beautiful plumage, which is
22686 likely to be gradually evolved due to better adaption to ecological environment. In this
687 study, the enrichment analysis of positive selection genes was mainly involved in
688 skeletal development, bone morphology, energy metabolism and storage, such as the
689 mTOR signaling pathway, MAPK signaling pathway, BMP signaling pathway, limb
690 development, lipid droplet, and lipid binding. mTOR was a central integrator of cellular
691 growth and metabolism, and the mTOR signaling pathway played a vital role in innate
692 and adaptive immune responses and regulating energy balance (Jones & Pearce, 2017;
693 J. Xu, Ji, & Yan, 2012). BMP was an important member of the transforming growth
694 factor-β (TGF-β) superfamily through regulating the activity of downstream genes to
695 participate in many important biological processes, such as nervous system
696 differentiation, tooth and bone development, and cancer (Buijs et al., 2007; Huang,
697 Zhong, Post, & Karperien, 2018). MAPK signalling pathway also participated in the
698 regulation of feather growth and development (Fang et al., 2018). Moreover, as the
699 rapid evolving genes, MEF2C exhibited many functions such as bone and muscle
700 development, immune, and melanocyte differentiation (C. F. Liu, Samsa, Zhou, &
701 Lefebvre, 2017; Tang et al., 2016; Trajanoska, Rivadeneira, Kiel, & Karasik, 2019).
702 Furthermore, the glittering plumage and long tail also deeply attracted people’s
703 attention. Many positively selected genes associated with pigmentation like TYR, SZT2,
704 NF1, ARCN1, KIT, HPS5, FIG4, LYST, RACK1, USP13, Hps6, OCA2, MITF and BCL2
705 were also identified. All of the above results could be well contributed to understanding
706 the phenotypic characteristics, such as large body size, long tail, and dazzling plumage
707 in peafowl during the adaptive evolutionary process.
708 To date, a number of researches about the genetic mechanism of plumage colour in
709 avian have been reported (Domyan et al., 2014; Robic et al., 2019). In the present study,
710 the mechanism of the formation of white plumage phenotype was explored in peafowl
711 combined transcriptome analysis and RT-qPCR with resequencing data. As for the
712 result of allele frequency difference, the PMEL and EDNRB related to melanin were
713 screened. Meanwhile, it was detected that the PMEL and EDNRB were contained in the
714 DEGs from the transcriptome analysis, and it was found that the enrichment of DEGs
715 was also involved in melanin biosynthetic process, which was in accordance with the
716 result of allele frequency difference. Then, it was identified that the PMEL and EDNRB
717 were the candidate genes of white plumage through the results of the allele frequency
23You can also read