BUILDING A TRANSPORT SYSTEM OF THE FUTURE - THE TRAFFIC CONTROL CENTRE'S PERFORMANCE REPORT 2020 - POLIS Network
←
→
Page content transcription
If your browser does not render page correctly, please read the page content below
BUILDING    THE TRAFFIC

A TRANSPORT SYSTEM
                      CONTROL CENTRE’S
                      PERFORMANCE REPORT

      OF THE FUTURE   2020
02
                Introduction by the Head
                of the Traffic Control Centre                              36   Road Safety                                           80    Advanced
                                                                                                                                            Technologies
                     Moscow’s Transport                                    38   The Photo and Video Recording System                        for Moscow Transport
                04
                     System Today                                               40 How the Photo and Video                                  of the Future
                                                                                    Recording System Operates
                                                                                                                                      82    Big Data Analytics
                                                                           42   Vision Zero                                           84    Biometrics – a New Level of Safety
                     06    What Does the Traffic                                44 Speeding is the Main Cause                               and Service on Transport
                           Control Centre Do?                                       of Road Accidents                                 86    The ITS – Deployment to Full
                                                                                46 Communication Campaigns –                                Capacity, Process Automation
                                                                                    Promoting Compliance with Traffic Rules                 and Robotics
                          08
                                    History of the Traffic                                                                            88    Autonomous Transport –
                                    Control Centre                                                                                          the Future is Here

                           10
                                     Background
                                     and Challenges                                                                                         Unconventional
                                                                                                                                      90
                                                                           48   Traffic Control                                             Cases at the Traffic
Contents                       14    Key Impacts of the Traffic
                                     Control Centre                        50   Integrated Traffic Control System                     90
                                                                                                                                            Control Centre
                                                                                                                                            Moscow During the COVID-19
                                                                                and Maintenance of Technical Means                          Pandemic
                                                                                of Traffic Control                                    92    Transport Services
                           16        International and Russian                                                                              for the 2018 Football World Cup
                                     Recognition
                                                                                                                                      94    Our Employees
                          18        Strategy of the Traffic
                                    Control Centre                         52   What We Do
                                                                                for Moscow Residents
                                                                           54   For Pedestrians                                       100   Moscow
                     22    The Intelligent                                 56   For Public Transport Passengers                             and Global Cities
                           Transport System                                58
                                                                           60
                                                                                For Cyclists and Scooter Users
                                                                                For Drivers                                           102 Fines
                     24    Structure of the Intelligent Transport System   62   For All Moscow Residents
                     26    Dynamic Transport Model                              62 Next-Generation Transport Hubs
                     28    The Mayor’s Automated Workstation System             66 Digital Services for Muscovites
                     30    The Smart Intersection System                        70 Environment
                                                                                                                                104   FAQs
                     32    The Command Centre at the Traffic                    76 Assistance on the Roads
                           Control Centre                                           Traffic Control Centre Patrols
                     34    How Does the ITS Respond to Emergencies?             78 Traffic Control Centre Activities
                                                                                                                              106   Getting in Touch
INTRODUCTION BY THE HEAD
OF THE TRAFFIC CONTROL CENTRE Innovations.
The Intelligent Transport System
Environmental friendliness. Urban Health concept
The development agenda of the capital as a whole and its transport system in particular includes the
environmental safety of Moscow and Muscovites along with physical safety. The COVID-19 pandemic that has
The introduction of the Intelligent Transport System has led to a seismic change
in the traffic situation thanks to smart traffic lights, a network of cameras and affected the whole world has shown that respiratory diseases and a vulnerable immune system in general result
sensors that analyse and regulate traffic flows, as well as other IT solutions, from, among other factors, life in densely populated megacities. For several years now, the Traffic Control Centre
“
which, for Moscow residents, often remain hidden from view. Today, about has been implementing measures to reduce the amount of harm road vehicles cause to the environment and
3.2 million vehicles hit the capital’s roads every day, creating a huge load people. We are actively developing a pedestrian environment and infrastructure for green transport (bicycles
on the street and road network. This is why seeking out and implementing and scooters), and are improving pedestrian accessibility of public transport stops. By 2023, Moscow Transport
This year, the Traffic Control Centre of the Moscow Government innovative traffic management solutions that meet the growing mobility plans to create an infrastructure that facilitates the convenient use of electric transport.
celebrates its 20th anniversary. Over these years, the Traffic Control demands of Muscovites and visitors to the capital remain a key task for the
Moscow is a megacity that continues to develop rapidly across all areas, which gives us the impetus for
Traffic Control Centre. Specifically, the Traffic Control Centre plans to upgrade
Centre has evolved from a small department comprised of five continuous improvement. Ahead of us lie new challenges and tasks to create a comfortable and safe
the traffic light control system and roll out a smart intersection management
employees to one of the world’s largest traffic management systems. environment for everyone.
system throughout the city. Overall, we set ourselves an ambitious goal to
Large-scale infrastructure and IT projects have been developed and minimise the number of days with a road congestion score above 8 on a scale
successfully implemented to make Moscow residents feel safer and more from 0 to 10.
Mikhail Kizlyk
comfortable when moving around the city. Head of the Traffic Control Centre
Safety.
The capital’s transport system received a huge development impetus Vision Zero programme
in the past ten years under the leadership of Moscow Mayor Sergey Road safety and the preservation of human life are the key values that
Sobyanin. With the launch of major public transport projects (such as the guide us. The approaches under the Swedish Vision Zero programme are
MCC, MCDs, and the new Magistral route network), the street and road used to reduce road fatalities in Moscow. The capital has already achieved
2,343
and exceeded the targets set by Russian President Vladimir Putin: in 2019,
network has expanded and evolved. More than 1,000 km of new roads
+20%
there were 3.5 road fatalities per 100,000 people. This level of safety is
have been constructed, dedicated lanes for surface transport have been comparable to New York (where the social risk is 2.6), Chicago (3.6) and
introduced and a cycling and pedestrian environment has been built. I Milan (4.0). The objective is to reduce the social risk to 3.3 by 2023, and
can confidently say that all this has had a remarkable effect on traffic. to achieve an index of less than 1 fatality per 100,000 people by 2040.
For this purpose, a new road accident prediction and prevention model will
lives
For instance, the average speed on major routes has increased by 20% average daily
be developed and implemented, and strict control over taxi and car sharing saved since 2010
over ten years. At the same time, in 2019, the Moscow Metropolitan traffic speed vs 2010
safety will be established. Advances in unmanned technology, and the as a result of measures
Area dropped out of the top 5 most congested cities in the ranking subsequent launch of autonomous transport in Moscow will improve road to reduce road fatalities
compiled by the Dutch company TomTom. safety by minimising the human factor.
2 THE TRAFFIC CONTROL CENTRE’S PERFORMANCE REPORT | 2020 | BUILDING A TRANSPORT SYSTEM OF THE FUTURE 3
Electronic
Services
The Intelligent
Transport System
(ITS)
100%
of vehicles
For details on the ITS,
see pages 22–35
MOSCOW’S TRANSPORT >35 5 and infrastructure
facilities in Moscow
SYSTEM TODAY million MOBILE APPS
are monitored
by the ITS
24/7
TROIKA CARDS
COMMAND CENTRE
AIR ROAD PEDESTRIAN RAIL SURFACE PUBLIC
180,000
INFRASTRUCTURE INFRASTRUCTURE INFRASTRUCTURE FRAMEWORK TRANSPORT TAXI
CCTV CAMERAS
4 passenger airports 6,200 km – 410 streets, squares Metro 11,500 vehicles 141,000 taxis licenced
3 Aeroexpress routes for Moscow
Transport Hub passengers
total length of roads and public spaces modernised
(361 km)
244 stations
595 km of rail tracks
1,050 routes
372 km of dedicated lanes
to operate in Moscow
and the Moscow Region 2,960
>800 navigation pylons 1,546 parking spaces PHOTO AND VIDEO RECORDERS
on the streets 418 km of tram tracks in 450 parking lots
3,458 new passenger
>40,000
MCC specifically for taxis
shelters
31 stations
CYCLING
TRAFFIC LIGHTS CONNECTED
Private Public
54 km of rail tracks TO THE SYSTEM
transport transport
INFRASTRUCTURE
accounts for accounts for
MCD-1 and MCD-2 3,900 29% 71%
6,511 bicycles across 60 stations
VEHICLE DETECTORS
8 million trips 20 million trips
629 rental stations CAR 132 km of rail tracks
WATERWAY
895 km of bicycle
paths and lanes (including
PARKING
177
INFRASTRUCTURE dedicated lanes)
6,000 e-scooters 85,600 paid parking
Suburban rail transport
(within the city boundaries)
CAR SHARING
THE MOSCOW INFORMATION DISPLAYS
ON ROADS
80 km of the Moskva River
11,300 parking spaces
for private bikes
spaces within the street 56 stations 30,000 vehicles
TRANSPORT HUB
28
and road network
flows through the city
220 km of riverside
21,100 parking spaces
1,979 km of rail tracks 6 operators is the largest in the world
and the first in Europe
in at-grade car parks
with lifting gates
14,300 parking spaces million trips
at park-and-ride facilities by passenger traffic are made by
passengers within
the city every day
4 THE TRAFFIC CONTROL CENTRE’S PERFORMANCE REPORT | 2020 | BUILDING A TRANSPORT SYSTEM OF THE FUTURE 5
TRAFFIC CONTROL
WHAT DOES CENTRE FUNCTIONS Traffic control Traffic management – operational and strategic Ensuring road safety
THE TRAFFIC The operation of a 24/7 command centre
1
The monitoring of, and prompt response
The development of the Intelligent Transport System
1
The creation and development of an effective and innovative ITS for the city
Enforcing violations of road traffic rules, rules
for traffic on the water, and parking rules
CONTROL to, the current traffic situation
2 Monitoring and analytics covering:
2
The installation and maintenance of equipment, upgrading and supporting
capabilities
1
Photo and video recording systems:
• deciding on camera locations
CENTRE DO?
• acting as a customer.
• surface public transport operation 3
The alignment of existing IT solutions
2 The technical preparation of materials on
• freight transport movement
administrative violations based on data from photo
• the operation of taxis and shared cars
Operational and strategic analytics and video recording systems
• the operation of the public bicycle rental
The Moscow Government’s Traffic 1 Collecting, processing and analysing traffic data 3 Waterways and river transport monitoring
system.
Control Centre is the City of Moscow’s
3 Analysis of private car traffic 2
Modelling passenger and transport flows
principal customer for the development
3
Commissioning expert reviews for projects, including traffic control, Ensuring road safety
and implementation of the traffic
integrated traffic control systems, the construction and reconstruction 1 Vision Zero – drafting and implementing a pro-
management strategy. of the street and road network
ITS – The Intelligent Transport System gramme (analysing multiple factors that contribute
4
Preparing operational and strategic reports to road accidents and eliminating their causes)
Strategic planning of street and road infrastructure The construction and improvement
THE TRAFFIC 1 Traffic control projects and traffic schemes: development of street and road infrastructure
1 Installation of road signs, safety barriers, base plates, poles, etc.
CONTROL CENTRE’S 2 Urban planning: input into development
3 Design standards and requirements: input into development 2 Installation of new passenger shelters at public transport stops
MISSION and revision
4 Introducing traffic control innovations: new technical means
3 Installation of photo and video recorders
4 Installation of CCTV cameras
Develop a street and road network that of traffic control and approaches to design
enables traffic in the city to become as 5 Collecting and processing requests/suggestions for traffic Digital services and information for citizens
fast, comfortable and safe as possible control changes
for all participants – pedestrians,
cyclists, urban transport passengers, Keeping residents up to date on: Communication campaigns covering
Operational planning of traffic control the Traffic Control Centre’s focus areas:
and motorists. • the current traffic situation
1 24/7 traffic monitoring and adjustment of traffic light timings • changes to urban transport services • Promoting compliance with traffic rules, etc.
2 Temporary traffic diversions including road closures • incidents on urban transport.
3 Assistance in reporting a road accident and removing debris Interaction with citizens:
Technical means of traffic control
from roads The development of digital services: • Responding to requests, meeting
comprise traffic lights, road signs,
fences, road bumps, etc. • A single MaaS-based mobile application, with residents and adopting new digital
personalised communications, etc. communication channels
6 THE TRAFFIC CONTROL CENTRE’S PERFORMANCE REPORT | 2020 | BUILDING A TRANSPORT SYSTEM OF THE FUTURE 7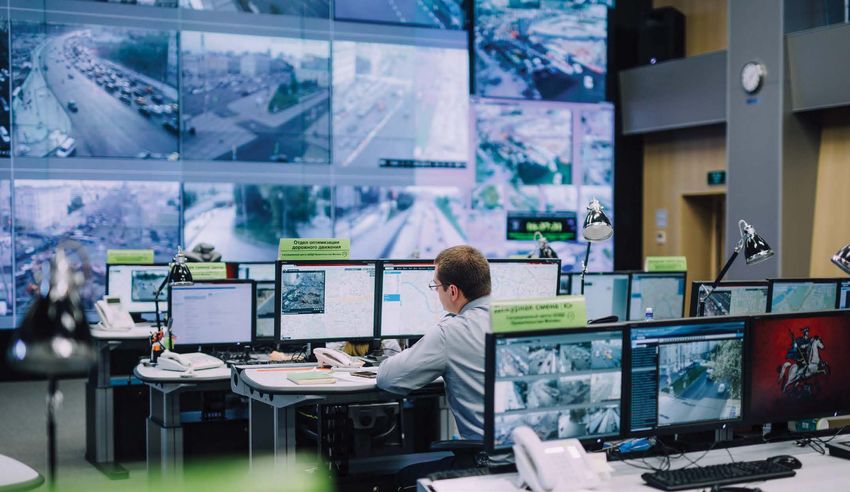
Major efforts to reconstruct and improve
the street and road network under
the My Street programme were launched The new Bicycle Patrol
100% of Moscow’s major routes are service was launched Successfully provided
covered by the ITS transport services for the
A freight framework was launched 2018 FIFA World Cup
HISTORY OF THE TRAFFIC A pilot freight framework in the Northern and North-Eastern
Administrative Districts Neural
was launched in the Eastern
networks
Administrative District
CONTROL CENTRE
started to be
2016 implemented 2018
Traffic information displays
started operating
2010 Each district
2014 of Moscow has Launch of the e-scooter
The MaaS-based Moscow Transport
The Main Directorate for Traffic Safety a dedicated traffic mobile app was released
rental system
was superseded by the Traffic Control 2011 coordinator
Centre for changing traffic schemes and The Mobile Command Centre was set up responsible for road
signs, markings and Monitoring of the Moskva River launched 2019
traffic light timings, building the technical The Intelligent Transport (a staff bus connected to the ITS) pedestrian crossings.
means of traffic control, as well as System development
preparing all design documentation for concept and key The reconstruction and launch
transport and road infrastructure facilities requirements were Portable photo and video recorders of the major transport hubs
approved were introduced on Savelovskaya and Kievskaya Squares
A dynamic transport model The Road
of the Moscow Metropolitan Area Patrol service
was built at the Traffic Control Centre started A working group for investigating,
operating analysing and preventing road
accidents was established
1999 The Command Centre
was set up at the Traffic
A coordinated traffic
light control system
2017
The Traffic Control Control Centre was introduced 450
Centre of the Moscow smart
Government was
established
On-street paid parking
was introduced
intersections
with priority 2020
Successfully organised transport
services for the 2017 FIFA
100 % passage 9 months
of Moscow (within for public (actual)
Confederations Cup
the Moscow Ring Road) transport
Parking control system Electric car
2013 started operating infrastructure started
covered by the freight
framework zone
to be developed
Restrictions on the movement
+1,000 Neural
new bicycles networks:
of freight transport within
2012 Moscow were introduced
across 119 rental Build up capabilities roll out within the ITS,
2015 Moscow car sharing system
stations at the Traffic Control
Centre’s Command Centre
introduce on metro
and surface transport
The first stationary Truck weighing stations for freight launched Almost to develop Moscow
vehicles started operating waterways
+6
Plans
photo and video 2,000 photo
recorders started and video new Start implementing the 15-year
operating in Moscow Public bicycle rental system was launched The Moscow Assistant recorders development strategy of the
bicycle
mobile app was launched Integrated Traffic Control before the end of 2020
lanes System
8 THE TRAFFIC CONTROL CENTRE’S PERFORMANCE REPORT | 2020 | BUILDING A TRANSPORT SYSTEM OF THE FUTURE 9
... but the number of vehicles The Moscow Metropolitan Area is one
2 being registered within 4 of the largest metropolitan areas
BACKGROUND 100 km
of roads have been
the Moscow transport hub
outpaces even the record-
breaking speed of road
in the world and the largest in Europe
It is rapidly expanding and becoming more dense. As the metropolitan area expands, effective trans-
AND CHALLENGES
port management becomes increasingly important.
constructed in Moscow construction Objective: Population of the Moscow Metropolitan
every year Vehicles registered within the Moscow transport hub,
Ensure smart distribution of commuter
flows
Area, mln people
21
since 2011... mln vehicles
5.7
8.2
17.1
1 New road infrastructure 2010 2019
+43% 2019 2025 (forecast)
The Moscow Metropolitan Area – Moscow and its suburbs within
2011 – September 2020 a 60–70 km radius: 13,600 sq km (area within two suburban zones)
The disbalance between
3 residential and employment
areas in Moscow persists despite its polycentric 5 6
>1,000 km >290
OF NEW ROADS NEW BRIDGES, TUNNELS
245
NEW OVER-GROUND
development. Thus, commuting becomes an issue,
with many residents travelling to work in another part
AND OVERPASSES AND UNDERGROUND
PEDESTRIAN CROSSINGS
of the city and back. This creates a huge, concentrated
load on the transport system. In July 2012, a part The amount
PwC, Quality of Living survey, 2018 Distribution of residential and employment areas of the Moscow of residential real
in Moscow by transport area
Region became estate commissioned
Moscow is among the top 3 megacities in the world for road length growth rates,
second only to Beijing, and ahead of New York, London and Hong Kong.
Interesting facts 9%
of the Moscow
59%
of jobs are
a district annually reached
55% of the world’s
population lives located within of Moscow an all-time high
population (4.2 billion
within the the boundaries
people) currently lives
boundaries of the Third
in cities.
of the Third Ring Road
Ring Road MOSCOW’S FOOTPRINT INCREASE IN THE AMOUNT OF COMMISSIONED
68% of the world’s HAS INCREASED RESIDENTIAL REAL ESTATE SINCE 2010
population (6.7 billion
people, +60%) will live
in cities by 2050.
by 2.4 times
(2,600 sq km)
by 2.8 times
according to the Urban Planning Policy
Source: the UN’s Revision of
World Urbanization Prospects ~46%
OF VEHICLES ON MOSCOW’S STREET AND ROAD
Objective:
and Construction Department of Moscow
Ensure new residential districts have transport accessibility, including connections between
NETWORK COME FROM OTHER REGIONS all other districts, without overloading the existing infrastructure
10 THE TRAFFIC CONTROL CENTRE’S PERFORMANCE REPORT | 2020 | BUILDING A TRANSPORT SYSTEM OF THE FUTURE 11
3.1–3.2
                                                                         MILLION VEHICLES
                                                                                                                                2.7
                                                                                                                                MILLION VEHICLES
                                                                                                  Maximum                            Maximum
                                                                                               congestion score   DRY WEATHER     congestion score   WET WEATHER

                                                                                                8 – 9                              5 – 6
                                                                 Having

                                                              500,000
                                                               less vehicles on the roads has
                                                               dramatically reduced congestion                                           #roadfacts

12
                                                             WEEKDAY
     THE TRAFFIC CONTROL CENTRE’S PERFORMANCE REPORT | 2020 | BUILDING A TRANSPORT SYSTEM OF THE FUTURE                                                        13
Pedestrian Cycling
infrastructure infrastructure
relevance relevance
KEY IMPACTS
OF THE TRAFFIC CONTROL CENTRE
Traffic speed, convenience
and safety, as well
Moscow
has become
pedestrian 2013
0.07 MILLION
Twice
as the environmental year of shared
Traffic speed situation in Moscow friendly! bike opening RIDES DURING
THE SEASON
depend on the performance AS OFTEN MUSCOVITES
+20%
of the Traffic Control Centre. OPT TO WALK (5 TIMES 2019
5 MILLION
MORE OFTEN IN SUMMER) RIDES PER SEASON
Average speed of private vehicles TRAFFIC INDEX Average number of unique trucks per day,
along Moscow’s key highways, km/h TomTom, The Netherlands (2020) ’000
average speed of private
70
vehicles along key
2019 54 2019 240 highways of the city
times
+20% –12%
in 2019 vs 2010
2010 45
1st place 2013 272 more rides
on shared
2012
(Moscow)
bikes
in 2019
6th place
Average travel time from the Moscow Ring Road down Punctuality and reliability of surface transport vs 2010
to the city centre, minutes 5 places services using dedicated infrastructure, %
2019
2019 56 2019 97
2010 67 –16% (Moscow and the Moscow Region)
2010 76 +28 p. p.
Physical safety
Social risk1 Total road accidents, ’000 Road injuries, people Road fatalities, people Environmental safety Public transport
2019 3.5 2019 160 2019 10,723 2019 433
relevance
2010 6.6 –47% 2010 609 4 times 2010 13,592 –21% 2010 763 –42% Share of Euro-4 and higher vehicles, %
NOx
2019 >65 nitrogen
2.1times
2010 28 2.3 times oxides Share of people using public transport, %
Road accidents Accident cluster sites Car thefts
Emissions from road vehicles, million tonnes per year
11,757
9,296 524 473
993
865 4,734
2019 226 2019 2,458
lower average
3,293 concentration of harmful СO 62
–21% –10% –13% –30%
2010 758 3.5 times 2010 11,805 5 times 2019 0.7 substances in the air carbon 2010
70 +13 p. p.
2010 2019 2010 2019 2010 2019 2010 2019
2010 1 –21% in 2019 vs 2010
2019
involving casualties involving public transport involving children (under involving pedestrians 1
18) Road fatalities per 100,000 residents.
14 THE TRAFFIC CONTROL CENTRE’S PERFORMANCE REPORT | 2020 | BUILDING A TRANSPORT SYSTEM OF THE FUTURE 15
Global leadership
Other achievements Governmental
Commission
for Traffic Safety
(2019)
No.1
in Russia
INTERNATIONAL
www.government.ru for road safety
by number of CCTV cameras Russia
AND RUSSIAN RECOGNITION
Moscow is among Beijing
No.1
Moscow’s ITS is the best solution the world’s top 5 cities
Shanghai
for a smart city. by number of CCTV cameras.
Digital Heights BCG, Development London
TomTom (2017)
2019 award, of Comfortable Urban
globally
Traffic congestion Russian Internet Week Environment in Moscow
and Leading Cities
Moscow
www.tomtom.com
for smart parking space
Worldwide (2018) New York The Netherlands arrangement
www.digital-summit.ru
www.tomtom.com
Greenpeace (2019)
No. 6
The Netherlands
Global leadership Road safety
Greenpeace, the world’s leading
Traffic congestion in Moscow environmental organisation, considers
by rate of road construction Elements of success:
1st place
and environment the Moscow Government’s efforts to
introduce electric transport a breakthrough.
Urban transportation
systems of 24 global globally
Moscow is among the top 3 Beijing
cities (2018) for transport system
megacities in the world by road
Transport Development development
length growth rates. Moscow www.mckinsey.com
2012 Index, Moscow State
PWC, www.greenpeace.ru
New York
University (2020)
25% 13
Quality of Living
th survey (2018) www.indexmsu.ru Among the world’s largest
London megacities, Moscow tied for 2nd
Russia
LOWER TRAFFIC CONGESTION place www.pwc.ru place with Singapore in the sub-
IN MOSCOW VS 2012 2017 Hong Kong index of road safety and the impact Singapore Greater Hong Kong London Madrid Moscow Chicago
of transport on the environment in Paris
2018 (8th place in 2010).
TomTom Traffic Index
Starting from 2017, TomTom has taken
the Moscow Metropolitan Area (Moscow
and the Moscow Region) as the study area.
Global leadership by number London
Space
reorganisation
of car sharing vehicles
2 nd
Singapore
The Moscow Assistant
CIHT (2020) mobile app
No.1
Traffic congestion in Moscow and the Moscow Region Moscow place Special recognition for is ranked among the
Sustainable Transport Award
top 12
Moscow
Hong Kong the successful organisation
(2018)
5th place Tokyo of transport services for
6 globally Honourable mention for reorganising the 2018 Football World Cup
th most innovative global
Tokyo
Beijing the city space and improving conditions technological solutions
by number of car Saint Petersburg for pedestrians to COVID-19 out
place sharing vehicles Shanghai of 704 projects.
2018 2019 Shanghai
8th place
Autostat, Russia (2020)
www.staward.org StartupBlink (2020)
In 2019, the Moscow Metropolitan Area dropped Moscow www.ciht.org.uk
out of the world’s top 5 most congested cities www.autostat.ru Istanbul www.startupblink.com
2010 USA UK
and metropolitan areas, moving to 6th place. Israel
16 THE TRAFFIC CONTROL CENTRE’S PERFORMANCE REPORT | 2020 | BUILDING A TRANSPORT SYSTEM OF THE FUTURE 17Leading
Vision Zero
What has been What will be participant cities
Safe achieved since 2010? achieved by 2040?
roads
STRATEGY VISION ZERO
2 times New road Taxi and car
New York Stockholm London
OF THE TRAFFIC
is a road traffic safety LOWER SOCIAL accident sharing safety
Preventive analysis
project that aims to achieve RISK RATE prediction control
of traffic accidents Selected
zero road fatalities. and prevention
based on historical data case
For details, see page 36 predicts the exact time
CONTROL CENTRE
model
First passed by the Swedish parliament and place of a potential accident
in 1997. and recommends the most optimal course
of action to avoid it (route of patrol unit, transport
Social risk, road fatalities
service notification, signals to self-driving vehicles, warnings
per 100,000 residents
to other road users on the city's road information displays)
6.6
3.5 3.3
2.2Sources: open data: Land Transport Authority
What has been What will be What has been What will be (www.lta.gov.sg), NYC Connected Vehicle Project
In developing its transport Interesting facts
system, Moscow follows achieved since 2010? achieved by 2040? Healthy Safe achieved since 2010? achieved by 2040? (www.cvp.nyc/), Smart City Lab (www.smartcitylab.com),
JREast (www.jreast.co.jp), Jelbi (www.jelbi.de/en/home/),
the global URBAN streets roads www.london.gov.uk, cdn.paris.fr etc.
HEALTH concept, which
is based on prioritising
health and an active
66%
OF TRIPS ON PUBLIC
Development of the pedestrian
environment
Share of residents
living within 20 minutes
VISION ZERO
is a multi-national road 2 times
LOWER SOCIAL
New road
accident
Taxi and car
sharing safety
The innovation of this approach
is that it does not require separate accident factors (e.g. speeding) or separate accident cluster
of the rail framework, %
86 traffic safety project that prediction control
and comfortable life TRANSPORT ARE MADE USING
ECO-FRIENDLY VEHICLES
Improvement of public
transport stop accessibility
2023 plan
aims to achieve zero road
RISK RATE
and prevention
sites (e.g. the Moscow Ring Road) to be processed individually. These factors are combined to give
a broader picture (e.g. collision of vehicles on the Moscow Ring Road involving a combination
when managing the way BY FOOT
80
2019
95
2030 plan fatalities.
For details, see page 36 model of parameters such as speeding, cloudy weather, Friday, evening peak hours).
21%
Development of infrastructure
densely populated cities for “green” last-mile First passed by the Swedish parliament To help implement this, a digital tool will be developed to identify
run. (218,000 TONNES) LESS transport – bicycles 89
2023 plan
in 1997. Social risk, road fatalities
and propose measures to prevent similar accidents in the future,
EMISSIONS FROM ROAD and scooters per 100,000 residents
BY SURFACE 72 100 and to assess their potential effectiveness.
VEHICLES PER YEAR 2019 2030 plan
Development of infrastructure TRANSPORT 6.6
for electric cars
3.5 3.3
2.2A single headquarters
ensuring 24/7
THE INTELLIGENT HOW THE ITS
OPERATES
Software Command
CENTRE
monitoring
and management
of traffic in Moscow
TRANSPORT SYSTEM ITS subsystems and electronic services
for intelligent traffic management
leverage big data.
For details, see pages
32–33
180,000 Data storage
The development scenario for the Moscow ITS was approved in 2011. It was built
Big data
on the experience of Singapore, Berlin and London; however, Moscow’s street and road
network and urban mobility have their own specifics. Therefore, solutions for other
1 collection
CCTV CAMERAS 2 and
megacities could only be used in a limited way.
Step Step processing THE MAYOR'S AUTOMATED
WORKSTATION
THE ITS
~3,000 OBJECTIVES
3
DYNAMIC MODEL
ITS equipment PHOTO AND VIDEO ITS server
RECORDERS
Step
3,900
STATIC MODEL Monitor traffic
ITS equipment collects Data are stored and processed
and respond
big data about all transport,
as well as traffic infrastructure SENSORS
on the ITS server
Management SURFACE TRANSPORT AND
to incidents on transport
and at infrastructure
and mobility in Moscow and services URBAN SERVICE OPERATION facilities
>40,000
MONITORING SYSTEM
Coordinate the
PHOTO AND VIDEO management of traffic
THE MOSCOW ITS is currently TRAFFIC LIGHTS
RECORDING SYSTEM flows
a 100% independent Russian 177,000 The ITS is a database of city
TRAFFIC LIGHT CONTROL SYSTEM Enforce traffic
violations and boost
development, fully customised
road safety
INFORMATION DISPLAYS etc.
100%
life that enables operational
Monitor the operation
to the capital’s unique profile
traffic management of surface public transport
>1,000
DIGITAL ROAD SIGNS
and strategic planning
of the transport system’s
For details,
see pages 24–31
and ensure it is prioritised
over other transport
of Moscow is covered development
by the ITS Monitor urban services
(utilities equipment, etc.)
! Inform traffic participants
THE MOSCOW ITS about the traffic situation and
3.2 million 6,200 km 28 million 500 million 99%
IS THE BEST SOLUTION any diversions
FOR A SMART CITY
Regulate and develop the taxi, car-
UNIQUE VEHICLES ON THE CITY’S LENGTH OF ROADS IN MOSCOW RIDES PER DAY WITHIN MOSCOW TELEMATICS DATA POINTS FROM ITS EQUIPMENT OPERABILITY (Digital Heights Awards
sharing and bicycle rental markets
ROADS DAILY THE ITS EQUIPMENT SHOWING (70% IN 2014) 2019, Russian Internet
20 million 8 million
THE NUMBER OF TRIPS PER DAY Week) Forecast the ways the traffic situation
on public transport on private transport will develop
22 THE TRAFFIC CONTROL CENTRE’S PERFORMANCE REPORT | 2020 | BUILDING A TRANSPORT SYSTEM OF THE FUTURE 23Monitors Moscow waterways and all relevant facilities, identifies vessels,
automatically detects speed violations and the rules of vessel mooring
and lay-up. Capabilities:
• Recording relevant incidents for authorised agencies
>25 PB
total volume
=
The total volume of all internet data
processed by Google in 2008 TRAFFIC LIGHT
CONTROL SYSTEM
STRUCTURE • Generating a comprehensive picture of events on the waterways
• Analytical comparisons
OF ITS DATA STORED
OF THE INTELLIGENT FACIAL
TRANSPORT SYSTEM RECOGNITION
SYSTEM
RIVER TRANSPORT
SURFACE PUBLIC
MONITORING
STATIC TRANSPORT INTEGRATED TRAFFIC TRANSPORT
SYSTEM
Moscow’s Intelligent Transport MODEL CONTROL SYSTEM AND SPECIAL
System comprises software SERVICE VEHICLES
and hardware components that
CCTV SYSTEM MONITORING SYSTEM
PHOTO AND VIDEO
ensure the collection, processing, RECORDING SYSTEM
storage and update of data SMART
on mobility in the city. DYNAMIC TRANSPORT INTERSECTION
MODEL SYSTEM
Core ITS
systems Software rolled out to municipal photo
Traffic lights can operate in three
modes:
and video recorders installed on public • Local (basic) – following a pre-
transport and transport infrastructure programmed cycle
facilities. It takes a fraction of a second • Coordinated – traffic lights
A single data warehouse comprising to recognise faces: are interconnected to ensure
traffic control projects and technical • of people wanted a “green wave” (passage
means of traffic control throughout by police for offences or people with minimum stops)
>30
Monitors and tracks vehicle Moscow. All information on probation – to enable further • Adaptive – traffic lights
movements in real time. Enables Shows existing transport about traffic control in the city Smart adaptive traffic lights The “eyes” watching over Moscow actions by law-enforcement recognise the traffic situation
effective control over the traffic and passenger flows in Moscow, is collated on one digital platform. exchange data with sensors 24/7. All CCTV cameras agencies and adjust accordingly based
situation in the city and prompt including pedestrian routes. Enables Currently, a strategy for the system’s on surface urban transport are monitored in the Command Monitors the operation of buses, • to improve transport convenience – on the data received
ITS systems
A system that automatically records
adjustment of traffic lights’ operation changes in the transport network’s further development is being and ensure priority passage Centre at the Traffic Control Centre, electric buses, trams, taxis, shared for example, to automate fare Plans for the near future include
55 types of traffic violations.
mode. operation to be predicted when new elaborated. for buses, electric buses and trams. where the traffic situation across cars and city service vehicles (hous- collection. introducing a centralised
Each system is designed
districts are built and new urban the entire city is monitored in real ing and communal services equip- coordinated and adaptive traffic
to address certain transport For details, see pages 26–27 transport lines are launched. For details, see page 50 For details, see pages 30–31 time. For details, see pages 38–41 ment, etc.) For details, see pages 84–85 light control system
and city-wide issues.
24 THE TRAFFIC CONTROL CENTRE’S PERFORMANCE REPORT | 2020 | BUILDING A TRANSPORT SYSTEM OF THE FUTURE 25Using data from the Dynamic
transport model Key Indicators
The Dynamic EACH INDICATOR IS COMPARED
Transport Model Assessment of the current traffic
situation – traffic speed and intensity
TO HISTORICAL DATA For traffic congestion points,
the average score for the period
is given in a small circle
The current traffic speed
to and from the city centre
The dynamic transport model allows
users to assess the current traffic situation Information for residents
(traffic speed/intensity), make short-term on the current traffic situation
forecasts, inform residents and track traffic 7 August General
Varshavskoe motorway
road congestion
events (road accidents, road closures, according according from to
to Yandex to the MTCC the city centre the city centre
repairs of sections of the road network,
etc.). Analytical reporting
Statistics
NEAD Speed
NAD
CARS 17,544
Interactive visualisation of real-time 14,577 20,777
Over 24 hours from the city centre
NWAD 19,157
data on the traffic situation For quantitative metrics, 722,988 2,574,920 −4% 32 km/h
The dynamic transport model underpins the variance between Currently
12,088 to the city centre
15,691 34 km/h
THE MOSCOW TRAFFIC SITUATION the current indicators 119,688 +1% 681,606 +1% EAD
and the previous
AROUND THE DISTRICT AROUND THE CITY
14,241
MONITORING MAP 17,919
given period
SURFACE PUBLIC TRANSPORT
is calculated
455 −2% 7,027
AROUND THE DISTRICT AROUND THE CITY
WAD
TAXI
19,549
5,847 −4% 35,069 +1% 20,824 SEAD
AROUND THE DISTRICT AROUND THE CITY
13,704
12,820
CAR SHARING
SWAD SAD
3,386 −1% 24,485
12,854
AROUND THE DISTRICT AROUND THE CITY
18,359
15,174
20,972
The model combines data
ROAD ACCIDENTS
from the static traffic model GPS DATA DATA FROM INVOLVING CASUALTIES
based on the PTV Visum 1 5 +66%
>100 million >4,000
AROUND THE DISTRICT AROUND THE CITY
solution with real-time
data. The data source ROAD CLOSURES
is the ITS equipment
The traffic situation monitoring map was presented installed on the street AUTHORISED CLOSURES CAD
99 +1% 544 +4%
to the President of the Russian Federation Vladimir Putin and road network,
TELEMATICS DATA VEHICLE on 14 March 2016 at the meeting of the State Council’s as well as the ITS
subsystems
NON-AUTHORISED CLOSURES
31 −11% 134 −10%
Presidium on road safety in Russia. AROUND THE DISTRICT AROUND THE CITY
Total over from the District: 129,298
POINTS PER DAY DETECTORS 24 hours to the District: 149,716
26 THE TRAFFIC CONTROL CENTRE’S PERFORMANCE REPORT | 2020 | BUILDING A TRANSPORT SYSTEM OF THE FUTURE 27Kremlin Ring The specified Analytics
and data, both archived
Garden Ring
What does it show? and current and projected,
are available throughout
Boulevard Ring Moscow as a whole and
The Mayor’s
with in-depth analysis of key
highways.
Urban traffic By zone
Automated Workstation
Analytics is used to make
• Traffic congestion: unique vehicles on the city’s roads, average speed, fundamental decisions on
scoring, length of traffic jams 19 major routes
the development of the
• Traffic events: road closures, accidents, emergencies, etc. (with details) Moscow transport system.
The Mayor’s Automated Workstation is a single traffic situation
• ITS equipment (traffic lights, photo and video recorders and CCTV Moscow Ring Road
monitoring system that operates on a 24/7 basis.
cameras, traffic detectors, traffic information displays, digital road signs,
weather stations, etc.): locations, data, operability The Third Ring Road
• Integrated traffic control system: traffic control projects with technical
>40
DIFFERENT DATA SOURCES
300,000
ITEMS MONITORED
5,000
VIDEO SURVEILLANCE
means of traffic control throughout Moscow (planned)
• Urban parking: zones, cost, availability (planned)
Displaying all events on the road
Indicators of the traffic situation
STREAMS
Road safety Monitoring the operation Monitoring
3
of the public bicycle rental system of service vehicles future (forecasts)
For who? • Road accidents: statistics, locations, details
• Photo and video recorders: location, efficiency
• Station map
• Usage statistics, sessions, display of free bikes and lanes
• Number of vehicles on the roads
• Location data online
present (current state)
• Active accident centers: locations, details (planned) adapted for Cycling (planned) horizons past (archives)
For the city administration
By period
Monitoring of surface Monitoring the operation of Monitoring
For what? public transport operation taxis and Car Sharing System the Moskva River
• 100% online monitoring • Provision of vehicles (the number of vehicles) • The number of taxi and Car Sharing System on the roads • Video surveillance of the River
and control of city traffic • Registration cards for each vehicle and their tracks online • River transport monitoring Development plans
• Location data online • Speed (planned)
• Live bus arrivals on digital information displays • Vehicle registration card: information about the company, Customised widget:
• 100% reporting
• Dedicated lanes for surface public transport (planned) car, business permit, etc. personalisation
on the operation of public
transport and road Critical event indicator:
infrastructure warning before reaching a set threshold
Monitoring the operation Monitoring freight transport Autonomous New services:
• 100% reporting
on the performance
of rail transport movement transport MCC, MCDs, parking, river transport
of urban services
• Tracks • Vehicle registration card: licence plate number, make, • Location data online Key traffic events digest etc.
• Passenger traffic model, licence • Speed
• Intervals • Location data online (planned) • Vehicle registration card Rollout of the Integrated
Traffic Control system
28 THE TRAFFIC CONTROL CENTRE’S PERFORMANCE REPORT | 2020 | BUILDING A TRANSPORT SYSTEM OF THE FUTURE 29HOW A SMART Vehicle
INTERSECTION
The vehicle
WORKS The tram approaches approaches
the intersection, the sensor
The Smart Intersection System Tram
identifies it as a tram
the intersection,
the sensor
identifies
Launched in January 2020 The sensor exchanges it as a vehicle
data with the local
The Smart Intersection system
uses inductive-loop detectors THE SYSTEM’S BENEFITS adaptive control centre
The tram is prioritised Daytime:
and is one of the world’s most
for a green light the green light
reliable and popular systems Up to 25% shorter waiting time The average public transport The intersection's capacity is up
Positive impacts
for pedestrians at daytime speed is up 15% 15%–20% operates in adaptive
for traffic flow management.
The green light ensures mode
The pedestrian has 100% priority Passenger traffic volumes 20%–40% – average reduction pedestrians’ safety when Nighttime: vehicles
when getting off a tram with intelligent devices cover- in waiting time at intersections thanks getting on and off the tram always have a green
ing the whole route are increased to the elimination of any unneces- light when there are no
Underground inductive-loop detectors
by up to 10% sary pedestrian phases (in all up pedestrians
identify public and private transport
to 4 hours saved during nighttime)
and help streamline the traffic
at the nearest traffic lights.
Adaptive mode Priority Adaptive mode
Priority (call button) Adaptive mode Priority (if no pedestrians)
The pedestrian Interesting fact
SMART INTERSECTION approaches the traffic In the future, a neural
Daytime lights and pushes network and machine
Pedestrian Surface transport Private transport
the call button vision will be used to
Pedestrian determine the priority of
Reducing travel REGULAR INTERSECTION Nighttime travel at intersections and
time for all traffic from
Daytime: the green light
control the adaptively
participants Fixed phases (basic mode) 9:00 p.m. operates in adaptive mode
coordinated mode of
to 7:00 a.m.
operation of traffic lights.
Longer waiting times Failure to keep traffic moving Idling during Nighttime: the green light
Inductive-loop operates in priority mode
Drawbacks
encourage jaywalking at a steady pace unnecessary phases
detector:
The yellow-light mode Decrease in passenger Decrease in the intersection’s capacity due
>465 99.9%
is unsafe at night traffic volumes to sub-optimal traffic light operation
Longer fleet
turnaround times accuracy Leading cities SCATS (Sydney) –
smart in vehicle type
identification
for Smart a leading system
intersections Adaptive mode means that traffic lights process real-time data about the current traffic situation on a given road segment and align
the signals correspondingly to streamline traffic.
Intersections Singapore London Sydney 42,000 intersections
in 1,800 cities
over 40 countries
worldwide
30 THE TRAFFIC CONTROL CENTRE’S PERFORMANCE REPORT | 2020
2020| BUILDING
| BUILDING
A TRANSPORT
A TRANSPORT
SYSTEM
SYSTEM
OFOF
THETHE
FUTURE
FUTURE 31Informs road users about the traffic situation
and optimal diversions
The core of
the Command Centre
is the ITS server
PB
TOTAL STORAGE
For details, see pages 66,68–69 CAPACITY
Command Centre WHAT DOES OF THE ITS SERVER
THE COMMAND
at the Traffic Control Centre CENTRE DO? Monitors the condition
the total volume
OF ALL INTERNET DATA
PROCESSED BY GOOGLE
of the street and road
IN 2008
The Command Centre sources data from: infrastructure: pavement, traffic
25,000
lights, road signs, displays and
other elements of traffic control and
sends requests to relevant units to
years
Gathers full
take remedial actions
OF CONTINUOUS 1,300
40,000 3,900 180,000
LISTENING
TO MP3 MUSIC
years
TRAFFIC LIGHTS VEHICLE DETECTORS CCTV CAMERAS information Helps drivers on the road: OF CONTINUOUS
Controls in the event of an emergency, the FILM WATCHING
about Command Centre can send in the nearest
the traffic traffic Road Patrol crew or provide a mobile
photo and video recorder
situation For details, see page 76
in the city
2,960 177 27 The Command
PHOTO AND VIDEO
RECORDERS
TRAFFIC INFORMATION
DISPLAYS
ROAD PATROL CREWS
Controls traffic lights
Centre is scheduled
to redistribute traffic flows for renovation
and eliminate traffic jams
by end-2022
THE COMMAND CENTRE Quickly gets in contact
with the Main Directorate
AT THE TRAFFIC CONTROL CENTRE
For details, see page 86–87
for Traffic Safety and other
relevant authorities in
is a single headquarters ensuring the event of an emergency
On-duty operators
at the Command Centre:
24/7 monitoring and management The Command Centre was set
18
up in 2013 and currently has
of traffic in Moscow in real time The main screen at the Command operators
80 employees. With the help of
advanced technology, they are
able to monitor the traffic of the
Centre displays road network utilisation monitor whole megacity in real time.
and all traffic monitoring data the traffic
situation
24/7
32 THE TRAFFIC CONTROL CENTRE’S PERFORMANCE REPORT | 2020 | BUILDING A TRANSPORT SYSTEM OF THE FUTURE 33How Does 2 3
the ITS ITS
server
The Command
Centre
Respond Neural networks The Command Sends in a Road Patrol
to Emergencies? ITS
identify slowdowns
in traffic, traffic jams,
Centre’s on-duty
operator receives
crew to help manage
the incident
2
road accidents and a signal from
1 equipment other emergencies and the ITS server and Speaks to the Main
transmit the information takes action:
The ITS equipment Directorate for Traffic
to the Command Centre
1
Safety (if necessary) Traffic lights
includes machine automatically
vision cameras, sensors adjust their
and detectors that can operation mode
recognise emergencies Information displays
and digital road signs
indicate that a section
Driver information of road is closed
display
! shows information
on traffic congestion
2 The Road Patrol
controls the traffic
Digital road signs
are signalled
Road in place
Accident to reduce closures
speed limits
The Moscow Transport mobile app
takes account of closures and offers
Traffic lights alternative routes
change their 1
operation mode Major road closures are reported in advance
to streamline traffic via Moscow Transport’s social media
ITS server pages, TV (Moscow 24) and radio channels
The road closure parameters (Moskva FM, Kommersant FM)
Informing are entered into the static model,
on the traffic congestion via media and the traffic situation is modelled Personalised updates via SMS:
channels (radio, TV) and on the Traffic automatically frequent users of the now closed road
Control Centre’s social media pages section receive a text message with landing
links to alternative routes
34 THE TRAFFIC CONTROL CENTRE’S PERFORMANCE REPORT | 2020 | BUILDING A TRANSPORT SYSTEM OF THE FUTURE 35ROAD SAFETY Moscow is No. 1 in Russia
for road safety
Moscow
has reached
3.5
Social risk across Russia (2019),
a record-high level 2,343 road fatalities per 100,000 residents
of road safety human lives
saved since
2010
Population, Number of vehicles,
million people million Social risk
social risk rate
in Moscow
Despite heavy traffic and the growing number of vehicles, Moscow’s accident Moscow 12.5 4.7
8.0
3.50
Moscow is leading Russia
rates have been steadily declining over the last nine years. The Moscow Region 7.4 3.3 11.03 by population and number
of vehicles, while also being
One-day snapshot of the street Saint Petersburg 5.3 2.0 4.12 the country’s safest region.
and road network of Moscow:
Executive Order of the Russian The Republic of Tatarstan 3.9 1.3 9.41
3.2 million Social risk
decreased
President No. 204 On National
Goals and Strategic Objectives
of the Russian Federation through
The Nizhny Novgorod Region 3.3 1.2 10.79
3.5
UNIQUE VEHICLES
47%
to 2024, dated 7 May 2018:
8 million
TRIPS ON INDIVIDUAL
by
since 2010
social risk rate
at the end
of 2019
In developing a national project
to build safe and effective roads,
the Russian Government should proceed
The social risk rate in Moscow is in line
with those of other global capital cities
from the need to ensure the achievement
TRANSPORT
of the following goals and targets
0.5 0.8 1.0 1.1 1.5 1.7 1.8 2.2 2.4 2.6 3.5 3.6 4.0 6.4
by 2024 ... reduce the number of road
Changes in social risk in Moscow,road fatalities per 100,000 residents accidents ... to a level not exceeding
four persons per 100,000 residents
(with the ambition to achieve zero road
6.6 6.5
7.1 7.0
7.3
Social risk almost halved since 2010.
The Russian President’s instruction
accidents by 2030).”
to achieve a social risk rate of 4.0
3.5
5.0
Integration of the Troitsky and Novomoskovsky 4.5 or below by 2024 has been
Administrative Areas, with Moscow expanding 2.4 times 4.0
3.7 COMPLETED AHEAD
OF SCHEDULE.
2010 2011 2012 2013 2014 2015 2016 2017 2018 2019 Paris Stockholm Tokyo Berlin London Madrid Hong Kong Singapore Shanghai New York Moscow Chicago Milan Los Angeles
36 THE TRAFFIC CONTROL CENTRE’S PERFORMANCE REPORT | 2020 | BUILDING A TRANSPORT SYSTEM OF THE FUTURE 37Moscow’s photo and video
recording system
Photo and video
recording system 2,960
Moscow operates an AI-based photo and video recording system.
Moscow is No. 1
in Russia by number
of traffic violation types
Moscow
The Moscow Region
The Republic of Tatarstan
18
18
55
55
traffic violation
27 .5 million
traffic tickets
issued in 2019 based
recorders
types captured by
2,618
captured by photo and The Krasnodar Territory 20 on processed recorder
AI processes traffic violations captured by cameras to support further
video recording systems
The Samara Region 22 the Moscow system data
FIXED
administrative tickets punishable by a fine.
Overall, installing new recorders or changing recorder locations improves
driving discipline and fosters more careful and prudent driving.
Top 3
MOST FREQUENT
3
traffic violations 3
Objectives Impacts 1
2
59
PORTABLE
30%
The layout
Monitoring traffic Failure to comply of photo and video
2
on a 24/7 basis up to with markings Stopping cameras in the city
fewer road accidents Using a transit-only in a yellow box is information open
Recording traffic lane
176
at recorder locations junction to citizens, it is posted
violations Speeding at a red light on the Unified
(2/3 of all tickets) Transport Portal.
1 MOBILE (TRAFFIC
Reversing CONTROL CENTRE MOBILE
at a crossroads COMPLEXES OF PHOTO
AND VIDEO RECORDING)
Interesting facts
1.5
Failing to yield
During the pandemic, photo and video recording systems to a pedestrian Interesting facts
tracked the cars of people who should have been isolating,
million
as well as people who did not have digital permits to travel potential Top 3 NEW violations
Road safety cameras have learned to identify
passages through parking lots. In the nearest future
violations
during lockdown.
captured daily captured by the photo they will be able to identify drivers with unfastened
safety-belts, mobile phone use while driving 107
For details, see page 91 and video recording system and other traffic violations. MOUNTED ON THE ROLLING
STOCK OF MOSGORTRANS
38 THE TRAFFIC CONTROL CENTRE’S PERFORMANCE REPORT | 2020 | BUILDING A TRANSPORT SYSTEM OF THE FUTURE 39The development outlook of the photo
and video recording system until 2025
HOW THE PHOTO AND VIDEO 0.0032%
risk of system error
RECORDING SYSTEM OPERATES pgrading
U Increased capacity
the camera fleet
with next-gen ore complex
M new pilot system for intercepting
A
neural networks and searching launched in the Central
Phase Recording Phase Verification Phase Drafting recorders
1 of violations
and number plate
2 of violations 3 a ticket
recognition
Artificial
Robot Robot
intelligence The Traffic system
Human
instead
of manual labour 100%
violations within the area
80% standard
violations
The checked photos are handed over to traffic police
or the Moscow Administrative Road Inspectorate.
They double-check the violation and issue
Photo and video recorders monitor all traffic
flows in Moscow on a 24/7 basis.
covered by recorders an administrative ticket.
The system provides
20 recorders based on neural a full analysis of all
networks process data by checking
the vehicle make and number plate
All data
coincide vehicle movements within
Moscow, which helps law
80 million
against traffic police information. VEHICLE TRIPS
enforcement authorities RECORDED PER DAY
Photo and video to quickly identify vehicles
recorders recognise and/or persons wanted
and record offending
vehicles. Human
by the police: stolen
vehicles, vehicles driven 5 times
FEWER CAR THEFTS
20%
by criminals, vehicles
SINCE 2010
Sophisticated failing to stop after
cases an accident or illegal
carriers.
What is sophisticated cases? Examples
An employee of the Traffic Control
Centre checks whether the recorder Violations are considered “sophisticated” if there
are a number of factors that rule out a violation: Running Failure
correctly recognised the number a red light to comply
plate, colour and make of the vehicle construction works, re-marking, completing
a manoeuvre, etc. with road signs
and analyses more sophisticated and markings
cases to identify whether a violation
took place.
40 THE TRAFFIC CONTROL CENTRE’S PERFORMANCE REPORT | 2020 | BUILDING A TRANSPORT SYSTEM OF THE FUTURE 41Collision with
a pedestrian outside
pedestrian crossings Key causes
and factors VISION ZERO INITIATIVES
Vision Zero of road accidents
Moscow is committed to Vision Breaching the rules
Zero, a global concept identifying for driving across Effective traffic control Installing photo Data transmission Addressing accident
443
key mortality and accident drivers
and implementing a wide range pedestrian crossings and video recorders to navigation services cluster sites
of initiatives to address them.
ROAD FATALITIES
A unique service in Russia
IN MOSCOW IN 2019
30% 3.5
TRAFFIC SCHEME REVISED ALONG
Trucks 3,200
Information on roadworks and closures, accident site clusters
Accident statistics – Up to TIMES
and camera locations
For details, see page 14 KM FEWER ROAD ACCIDENTS FEWER ACCIDENT CLUSTER SITES
OF MOSCOW’S STREET AND ROAD AT RECORDER LOCATIONS IN MOSCOW SINCE 2010
NETWORK (80%)
Safe geometry to reduce speeds Photo and video recorders prevent The Vision Zero team has been analysing
and prevent chaotic parking speeding within accident cluster sites severe road accidents and designing
improvements since 2019
For details, see pages 48–51 For details, see pages 38–41
What do we do as part Motorbikes
of our commitment to Vision Zero? Map Map Map Team members
of accident of road of camera
cluster sites closures locations
1. A nalyse accident rates and improve the road
Traffic Control Mosgortrans
Centre
safety performance of the Traffic Control Centre ц
Traffic offences Roadworks Freight transport The safety of children Association of Administrative
2. Communication campaigns to promote
Traffic police and Technical Inspectorates
in residential areas
(OATI)
movement control on roads
compliance with traffic rules Prefectures
of administrative
Automobile
Roads
districts
3. Designing a safe road Department Department
transport infrastructure Driving while under of Housing, Utilities of Major Repairs
24/7 21% 79
and Amenities and Construction
the influence of alcohol CHILDREN’S LIVES
MONITORING OF THE STREET AND ROAD FEWER ROAD ACCIDENTS SAVED SINCE 2010
NETWORK CONDITION INVOLVING TRUCKS
100% Educating and raising
The transmission of data on the location
Speeding Freight framework, truck passes, truck
of children’s facilities to navigation
services, video lessons from the Moscow
awareness on road safety
weigh stations Government, road safety lessons at
OF ROADS ARE IN GOOD CONDITION schools, etc.
For details, see pages 46–47
For details, see page 70
42 THE TRAFFIC CONTROL CENTRE’S PERFORMANCE REPORT | 2020 | BUILDING A TRANSPORT SYSTEM OF THE FUTURE 43SPEEDING IS THE MAIN CAUSE Minimum fine, RUB ‘000 What happens
OF ROAD ACCIDENTS at high speeds? Safer roads require:
Moscow is among the cities with the highest speed limits and lowest fines
globally. This results in high accident crash fatality rates.
Moscow
São Paulo
Chicago
1.3
2.3
0.5 100°
40
65°
72
Toronto 1.9
KM/H KM/H A tolerance
Tokyo 5.2
Berlin 1.1
threshold
Risk of road fatality for pedestrians, %
Stockholm 14.9 reduction to
10
Copenhagen 6.3
Amsterdam 1.9
Narrows down KM/H
London 9.8 the driver’s field of view
FORCE
100 Moscow Singapore 6.1
São Paulo
95
New York 3.2
Lower
Chicago
90
SPEED
speed limits in
85 Tokyo
Speed limit and tolerance threshold, km/h
Increases the Augments the risk the city centre
80
Higher force of impact of fatality
60 20
75
70
35%
speeds
65 Toronto
60
Copenhagen
Stockholm
Moscow 80
Increased
55
Amsterdam
Singapore
Berlin
São Paulo 60 7
64
67
Extends the braking distance penalty charges
Chicago 48 16
50
45
London
New York
Toronto 50 10 60 for breaking
40
Tokyo 60
3 53
60
traffic rules
35
Berlin
Stockholm
50
50 3 53
Increases the thinking distance
30 Copenhagen 50 3 53
25 Amsterdam 50 3 53
20 London 48 3 51
32 19 м
15 Singapore 50 1 51 KM/H
New York 40 10 50
Percent (%)
10
48 36 м
KM/H
5 0 10 20 30 40 50 60 70 80
Speed (km/h)
50 60 70 80 Maximum speed Tolerance threshold 64 50 м
KM/H
DECISION-MAKING BRAKING
44 THE TRAFFIC CONTROL CENTRE’S PERFORMANCE REPORT | 2020 | BUILDING A TRANSPORT SYSTEM OF THE FUTURE 45You can also read


